

Translate this page into:
Biogenic AgNPs for the non-cross-linking detection of aluminum in aqueous systems
⁎Corresponding authors. mtayyab@ksu.edu.sa (Mohd Ubaidullah), dinesh.kumar@cug.ac.in (Dinesh Kumar)
-
Received: ,
Accepted: ,
This article was originally published by Elsevier and was migrated to Scientific Scholar after the change of Publisher.
Peer review under responsibility of King Saud University.
Abstract
Nanoparticle synthesis is one of the most innovative areas of the 21st century in which the implication of the experimental biogenesis process is significant. We report biogenesis of silver nanoparticles (AgNPs) using cinchona bark extract in which cinchona bark extract acts as a reducing agent and stabilizing agent and does not require additional reducing and stabilizing agent. The cinchona-silver nanoparticles (C-AgNPs) were monodispersed with a size of 3–4 nm, stable, highly selective, and used for non-cross-linking detection of aqueous Al3+ ion colorimetrically. C-AgNPs provide a good limit of detection (LOD) of 0.01 ppm for Al3+ that is well below the detection limit set by USEPA (50 ppm) and WHO (0.199 ppm) and is based on the deep yellow to brown color tuning of the C-AgNPs based detection system. The synthesis of C-AgNPs was optimized in terms of pH, concentration of extract, and the effect of temperature. Morphology and the size of AgNPs were characterized by HRTEM and DLS analysis. Thus, without an additional noxious agent and any labeling agent that is required for cross-linking, a simple, fast, and selective colorimetric method is proposed for ultrasensitive detection of health hazardous aluminum ions. Moreover, this non-toxic, biocompatible plant extract allows the successful detection of Al3+ ions in real water samples.
Keywords
Non-cross-linking detection
Biomediated AgNPs
Cinchona bark extract
Al3+ ions

1 Introduction
Nanoscience is one of the most recent developing field and finds applications in various modern technologies such as hydrogen storage, photocatalysis, green energy devices (Nozik, 2010), sensors, biomedical implants (Bhuvaneswari et al., 2021; Serrano et al., 2009), and photovoltaics (Colmenares et al., 2009). Although the most common method used to prepare nanostructures is chemical synthesis (Al-Hartomy et al., 2013; Dhillon et al., 2017a, 2017b), that needs expensive instruments, and chemicals. Therefore, economically viable, and bio-compatible nanoparticles steer toward green chemistry. Surface modification in the synthesis of NPs is significant for controlling the size of NPs, either by increasing colloidal stability or by adding functionality to the NPs. Colloidal stability is maintained by steric and electrostatic forces required for maintaining repulsive force necessary for preventing aggregation of NPs in aqueous solution(Olenin, 2019; Vergara-Barberán et al., 2017). However, these cross-linking colorimetric detections have been employed by many researchers for the application of identification, specific labeling agents (aptamer, peptides, and oligonucleotides) due to the need for a time-consuming and tedious process. Thus, these may be replaced by non–cross-linking detection, which has been investigated for the detection of DNA targets (Dhillon et al., 2018). With this, we use the non-cross-linking approach, which is being applied with rapid and selective detection of metal ions. Biomed synthesis of nanostructures satisfies the entire requirements, especially waste, reducing the use of reducing chemical hazards, thus preventing pollution (Al-Enizi et al., 2020). Moreover, the dual role of biomass as a reducing and stabilizing agent minimizes the complexity of the synthesis procedure11. Many of the heavy metal ions are toxic even in trace amounts; their sensing and quantification are urgent issues to be addressed. Much attention has been focused on aluminum (Al3+) sensing as it is not a biologically essential element. An increased amount of Al3+ in the human body causes damage to the nervous system, loss of memory, listlessness, and Alzheimer’s disease (Shaw and Tomljenovic, 2013). Al3+ is also responsible for intoxication in hemodialysis patients (Sorenson et al., 1974). This increased amount is toxic for growing plants and water animals (Sorenson et al., 1974).
Therefore, a highly selective, sensitive, and on-site detection of Al3+ is needed to avoid its hazardous effects. Several techniques have been used to detect low levels of Al3+ ions in various samples. For instance, atomic absorption spectrometry (AAS), fluorimetry, inductively coupled plasma mass spectroscopy (ICP-MS), inductively coupled plasma emission spectrometry (ICP-AES), fluorescent, and liquid chromatography-mass spectrometry (LC-MS) etc. However, background signals, the requirement of professional operators, longer assay time, and complicated synthesis procedures limit their application. Nanoparticles show an extensive application in the detection of heavy metal ions (Firdaus et al., 2017; Li et al., 2010). Although very limited sensors have been reported for the colorimetric detection of the Al3+ ion, most of them were synthesized using chemical methods (Chen et al., 2013; Xue et al., 2014). Ascorbic acid capped gold nanoparticles (AA-AuNPs) were used for facile and simple colorimetric detection of Al3+ in aqueous media (Kim et al., 2018). Au NPs have been used for aluminum detection by functionalization with a capping of 4-Benzoyl pyrazolone (Rastogi et al., 2017), casein peptide (Abubaker et al., 2018), 5-Hydroxy indole-2-carboxylic acid (5H-I2CA) (Shinde et al., 2017) etc. Although silver nanoparticles show excellent detection properties and have been used to detect many metal ions such as Fe2+ (Basiri et al., 2018), Pb2+ (Naushad, 2014), Cd2+ Cu2+, Co2+, Pb2+ and Ni2+ (Modrzejewska-Sikorska and Konował, 2020; Zafer et al., 2020), Cr3+(Gao et al., 2020), Hg2+ (Faghiri and Ghorbani, 2019) but very little explored for Al3+ detection. On the other hand, the-state-of-the-art biogenic nanoparticles fulfill the ultimate needs of sensing the metal ions in the biological system. We report a facile and biocompatible method for synthesizing very small AgNPs with high monodispersity and exploring their use as a highly selective and sensitive sensor for Al3+. Silver nanoparticles were synthesized by green biomasses such as Ficus benjamina leaves (Puente et al., 2019), Carica papaya (Achan et al., 2011).
We used cinchona bark extract as a multifunctional agent to synthesize and stabilize AgNPs and detect Al3+ ions. The cinchona bark has long been used in the treatment of malaria and various other medicinal activities (Vinod Kumar et al., 2014). Our proposed method is easy to use because it does not require sophisticated laboratory conditions, applies to room temperature, and works near physical pH. The use of water as a medium in this method enhances its usefulness in various water samples.
2 Materials and methods
Silver nitrate (AgNO3) from (Merck India) and metal salts calcium chloride (CaCl2), ferrous chloride (FeCl2), ferric chloride (FeCl3), barium chloride (BaCl2), zinc chloride (ZnCl2), cadmium chloride (CdCl2), mercuric chloride (HgCl2), lead chloride (PbCl2), copper sulphate pentahydrate (CuSO4·5H2O), manganese chloride (MnCl2), chromium trichloride (CrCl3), aluminum chloride (AlCl3), and NaOH procured from Sigma-Aldrich, and Merck, India were used as received to test the selective colorimetric sensitivity of the AgNPs probe to the metal ions Ca2+, Fe2+, Fe3+, Ba2+, Zn2+, Cd2+, Hg2+, Pb2+, Cu2+, Mn2+, Cr3+, and Al3+. Stock and other aqueous solutions were prepared to rule out any possible analytical measurement interference using Millipore water. All the glassware was thoroughly washed with freshly prepared aqua regia and thoroughly washed with Millipore water before use. The characterization part described in supplementary as Text S-1, preparation of cinchona extract elaborated as Text S-2 and preparation of C-AgNPs as Text S-3.
2.1 Colorimetric selectivity test of C-AgNPs
The selectivity step was crucial in cutting down finally to one specific heavy metal ion to which the developed C-AgNPs probe was colorimetrically sensitive. Aqueous solutions of all metal ions were prepared by dissolving their respective salts in Millipore water and stored at room temperature. To scrutinize the recognition ability of C-AgNPs probe towards metal ions, 200 µL of the previously prepared metal ion solutions were added to the 500 µL of C-AgNPs. The test solutions were allowed to stand for 25 min at room temperature. UV–Vis spectra checked the changes in the color of the test solution. This helped to achieve precise and interference-free detection of Al3+ ions.
2.2 Quantitative analysis of Al3+ using C-AgNPs
To quantitatively deduce the LOD of C-AgNPs for Al3+, various concentrations of Al3+ were prepared by serial dilution of stock solution. From the prepared Al3+ solutions, 200 μL each was added separately into 500 µL of AgNPs solution. The solutions were checked for the color change, and after completion of the reaction, the UV–Vis spectra of the solution were recorded.
2.3 Application of the sensor
To confirm the practical applicability of synthesized detection probe (C-AgNPs), pond water and drinking water samples were collected from our campus and research laboratory (Banasthali University, Jaipur, India) and used as such without filtration. The collected samples were spiked with different concentrations of Al3+ (0.2 ppm and 0.6 ppm) and analyzed by the procedure mentioned above.
3 Results and discussion
3.1 Formation of C-AgNPs
3.1.1 UV–Vis spectra and HRTEM images
The formation of AgNPs was confirmed by a change in color of the solution from colorless to yellow as a straightforward approach upon the addition of extract to it at room temperature. The UV–Vis spectra of pure plant extract peaked at 279 nm (Fig. 1a) due to the π-π∗ transition. This peak disappeared in the UV–Vis spectra of synthesized AgNPs at room temperature. A new sharp characteristic peak was seen at 402 nm due to the excitation of gaseous electrons from the highest occupied cluster orbital to the lowest unoccupied orbital (Fig. 1b). The disappearance of the peak at 279 nm confirms the participation of easily excitable electrons in reducing Ag+ to Ag0. C-AgNPs synthesized at 80 ℃ showed a red-shift in peak position to 417 nm with a decrease in intensity (Fig. 1c). A comparison of full-width half maximum (fwhm) values was obtained for the particles synthesized at room temperature (Fig. S 1a) and by heating method (Fig. S 1b). A smaller value of fwhm suggests the synthesis of monodispersed particles, while a higher value results due to particles' polydispersity. Thus, a higher value of fwhm (111 nm) for the particles synthesized by heating supports poly-dispersed particles' synthesis.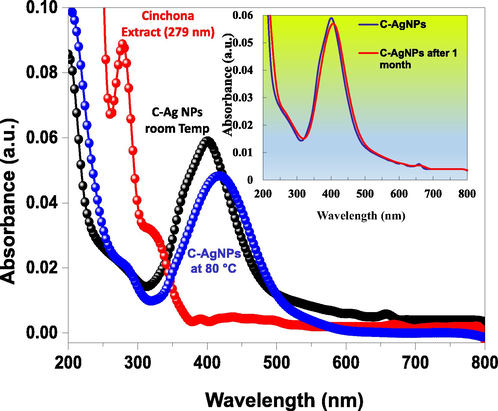
UV–Vis spectra of cinchona bark extract (a), C-AgNPs at room temperature (b), and at 80 °C (c).
In comparison, the lower value of fwhm (97 nm) for the particles synthesized at room temperature supports monodispersed nanoparticles' synthesis. These results were further confirmed by the corresponding HRTEM images of C-AgNPs (Fig. 2a and b). Moreover, the results show that the particles synthesized at room temperature could be more useful for sensitive detection of metal ions. The prepared AgNPs were stable up to a month at room temperature, and their stability was confirmed by SPR spectra (Fig. S2).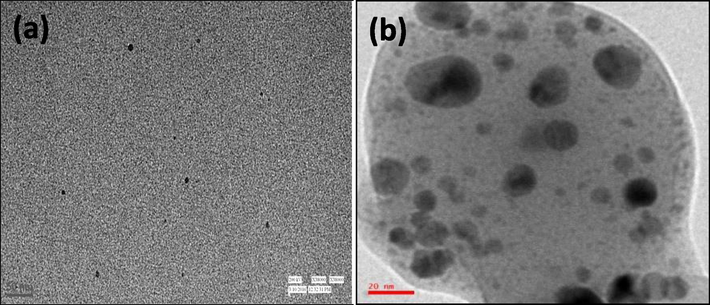
TEM images of C-AgNPs synthesized at room temperature (a) and at 80 °C (b).
3.1.2 FT-IR spectra
The active constituents in most plant extracts are polyphenols, flavonoids, and alkaloids (Kacprzak, 2013). These active constituents are well known for their antioxidant activity, which is an indirect measure of their reducing power (2010). Consequently, these active components can reduce and stabilize the nanoparticles.
We utilized cinchona bark extract for the synthesis of nanoparticles. Cinchona alkaloids are the major components of bark extract (Kacprzak, 2013). The main alkaloids present in the extract are quinine, cinchonidine, quinidine, and cinchonine. Many of their close derivatives that share their basic skeleton with the difference in their side chains have been found in the bark (Kacprzak, 2013). Therefore, it is probable that these alkaloids impart reducing characteristics to the bark extract, which is exploited in the present work for the synthesis of C-AgNPs by the reduction of Ag+ to Ag0. We performed FT-IR measurement of the cinchona bark extract and C-AgNPs to confirm alkaloids' presence and their involvement in the reduction (Dictionary of Alkaloids, 2010).
The FT-IR spectra of the extract before the reduction of Ag+ show characteristic peaks at 3414 cm−1, 2924 cm−1, 1616 cm−1, 1318 cm−1, 1279 cm−1, and 1060 cm−1, which may be associated with –OH, C − H, CH = CH2, aromatic and aliphatic C—N, respectively (Fig. 3a). The data show the presence of alkaloids as the major components in the extract. After the reduction of Ag+ to Ag0, peaks at 3414 cm−1, 1616 cm−1, 1279 cm−1, and 1060 cm−1 disappeared while slight shift was observed in peaks at 1313 cm-1to 1360 cm−1 (Fig. 3b). These changes in FT-IR spectra show the involvement of alkaloids in the reduction process.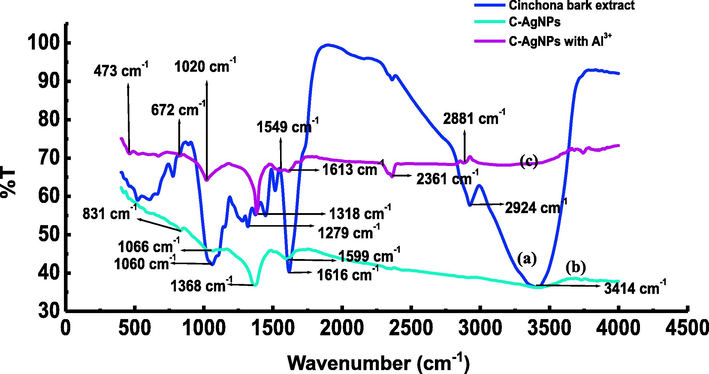
FT-IR spectra of cinchona extract (a), C-AgNPs (b), and C-AgNPs in the presence of Al3+ (c).
Accordingly, we propose a possible mechanism of reduced synthesis of C-AgNPs (Scheme 1). In the basic medium –OH group tends to lose its hydrogen as a proton, which was confirmed by a decline in the medium's pH as the reaction proceeds. In addition, the high basicity of aliphatic N also supports the reduction process. Likewise, the disappearance of the peak at 1616 cm−1 in the C-AgNPs spectrum supports the vinyl group's involvement in the reduction process. After the reduction due to the high affinity of Ag to N, it attaches to the surface of nanoparticles in such a way that the negatively charged oxygen protrudes out in the solution to provide electrostatic stability to the C-AgNPs.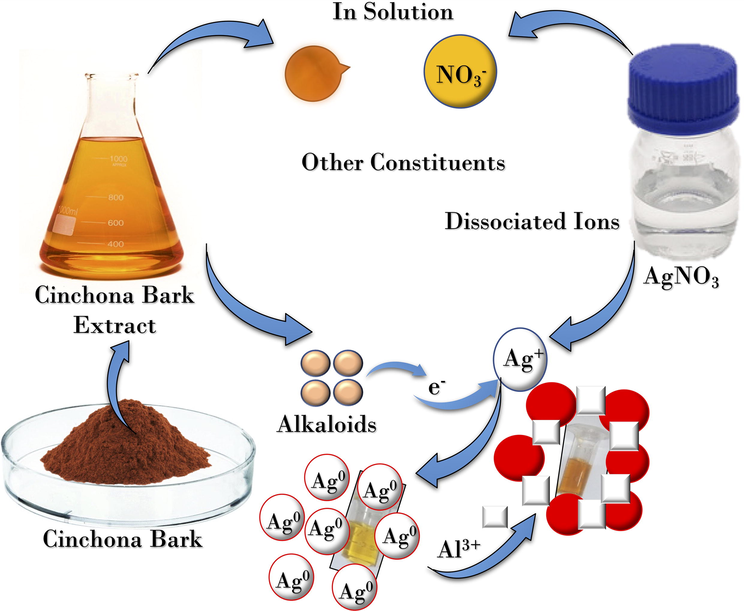
Schematic representation of the synthesis of C-AgNPs and their aggregation in the presence of Al3+.
3.2 Role of pH and cinchona bark extract concentration on the synthesis of C-AgNPs
We have observed in our previous studies (Joshi et al., 2017) that bioprocess parameters such as pH and plant extract concentration play a vital role in the synthesis of nanoparticles. Here, we studied the effect of pH and cinchona bark extract concentration on nanoparticles' synthesis at room temperature.
3.2.1 Effect of volume of extract
To study the effect of volume of cinchona bark extract, the reaction was conducted in the presence of various volumes ranging from 50 μL to 2000 μL, and the formation of AgNPs was monitored by UV–Vis spectrophotometer (Fig. 4). The results showed that at minimum volume (50 μL), no peak was observed in the visible region and on increasing the volume of extract from 250 μL to 1000 μL, a continuous increase in the intensity of peak was observed along with a shift in peaks from 419 nm to 402 nm (blue shift). After that, only a slight change in peak intensity was observed on increasing volume from 1000 μL to 2000 µL, indicating completion of the reaction. Accordingly, the colorless solution of AgNO3 gradually changed to yellow with the volume of plant extract, as shown in inset of Fig. 4. Therefore, 1000 μL was selected as an optimized volume to synthesize C-AgNPs.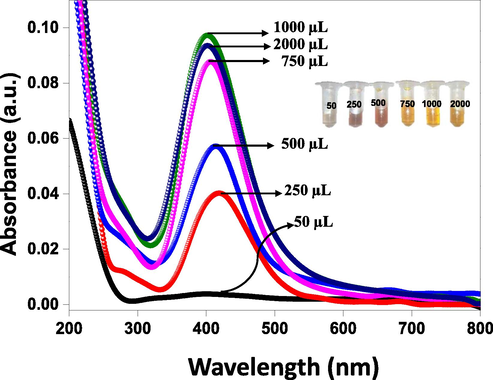
UV–Vis spectra of AgNPs synthesized by various volumes (50–2000 µL) of cinchona bark extract.
3.2.2 Effect of pH
The reaction mixture's pH was adjusted using 0.01 M NaOH, after the addition of which, an instant change in color of the reaction mixture was seen. Therefore, the formation of C-AgNPs was monitored primarily by UV–Vis spectroscopy. We varied the amount of NaOH to obtain pH from 5.0 to 11.0. At pH 9.0, a sharp and intense band was seen at 402 nm. When the reaction mixture's pH was lower than 9.0, a continuous decrease in intensity was seen with a red-shift of the peak. Finally, the peak disappeared at pH 5.0. The red-shift of peak shows increased particle size with polydispersity. However, at pH 10 and 11, no notable change was observed in peak position and peak intensity (Fig. 5). The corresponding change in color of C-AgNPs is shown in inset of Fig. 5. Thus, we optimized the pH of the reaction medium at 9.0 for further studies.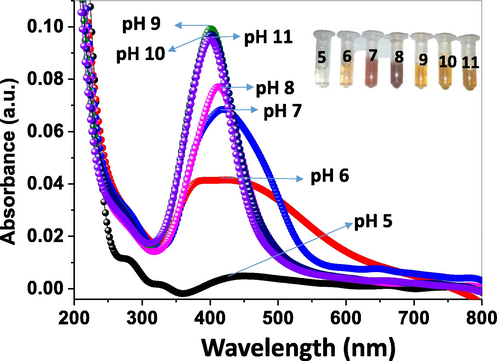
UV–Vis spectra of C-AgNPs synthesized at different pH ranging from 5 to11.
Although cinchona bark extract itself works as both a reducing and stabilizing agent at pH 9.0, this phenomenon did not work when the pH of the reaction lowered from 9.0. This may be due to pH-dependent redox nature of active components of bark extract. The strong acidic or alkaline condition reduces the active compounds' capacity, which is completely deactivated, thus slowing down the formation of AgNPs.
In most of the reports, nanoparticles' photosynthetic protocols were not efficient to produce nanoparticles with uniform shape and size (Annadhasan et al., 2015). But, in our study, we successfully synthesized mainly spherical particles with a size range of 3–4 nm. Moreover, since we did not use any external stabilizing agent, the synthesis of nanoparticles was not tedious and time-consuming, making the method preferable to other reported methods.
3.3 Selectivity of C-AgNPs
The synthesized C-AgNPs were well dispersed and displayed characteristic yellow color with a strong SPR band at 402 nm. We hypothesized that the C-AgNPs might be developed as an efficient colorimetric sensor to detect toxic metal ions. To demonstrate the sensor's selectivity toward Al3+ ion, other environmentally relevant metal ions like Ca2+, Fe2+, Fe3+, Ba2+, Zn2+, Cd2+, Hg2+, Pb2+, Cu2+, Mn2+, Cr3+, and Al3+ were also examined under optimized conditions. All the metal ions were added separately into the C-AgNPs solution. On addition of Al3+ to the C-AgNPs solution, an instant change in color from dark yellow to brown was observed. This may be due to decreased distance between nanoparticles on the interaction of Al3+ with active components in bark extract. However, it was observed that other metal ions induced no or a very slight change in the color of C-AgNPs solution (Fig. 6a). Correspondingly the SPR peak at 402 nm shows a decrease in intensity with a slight red-shift in the presence of Al3+. This red-shift of the peak could be attributed to aggregation of nanoparticles (Saion et al., 2013). UV–Vis spectra of C-AgNPs in the presence of other metal ions were also obtained. The noticeable decrease in intensity with red-shift is a unique feature for the Al3+ containing AgNPs (Fig. 6b). The selectivity of C-AgNPs towards various metal ions was further showed by plotting the absorption of the C-AgNPs solution in the presence of each metal ion. The selectivity of C-AgNPs for Al3+ was demonstrated by comparing absorption difference (A0-A) with that of a solution containing other metal ions as shown in Fig. 6c. A higher absorbance difference in absorbance indicates aggregated particles and a lower difference indicates well-dispersed particles (Irfan et al., 2020). A much higher value of A0-A was seen for C-AgNPs in the presence of Al3+ ions compared to that with other metal ions. Hence, AgNPs synthesized by cinchona extract responded selectively for Al3+ ion as indicated by a much higher increase in A0-A due to aggregation of C-AgNPs.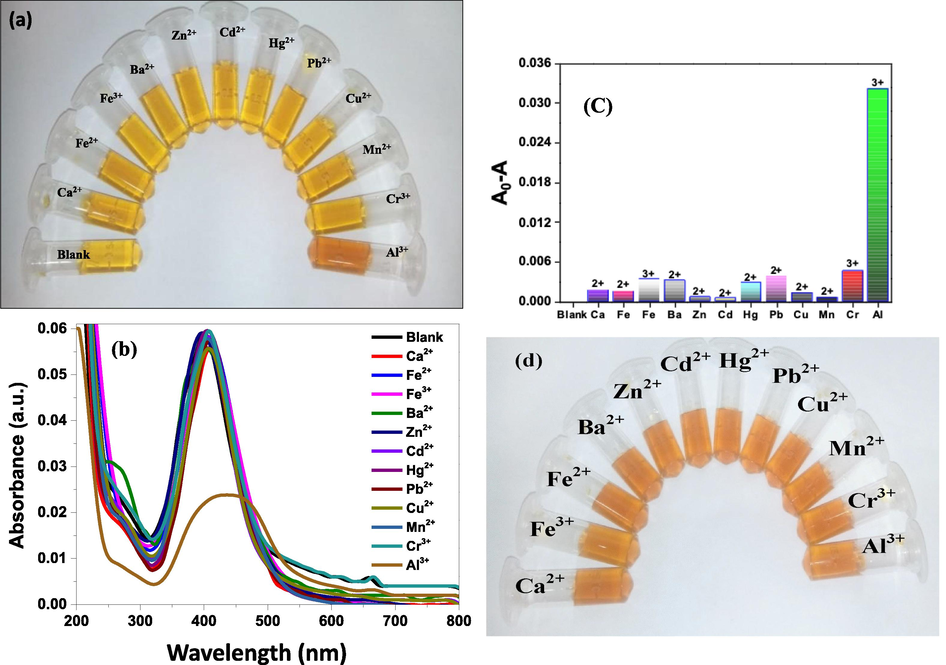
Photographs show the colorimetric response of C-AgNPs in the presence of various metal ions (a), UV–Vis spectra of C-AgNPs in the presence of different metal ions (b), the corresponding difference in absorbance in the presence of metal ions; each data point is a mean of three measurements; the error bars show standard deviation (c), visual change in color of C-AgNPs in the presence of a mixture of Al3+ with other metal ions (d).
For monitoring interference, a solution of metal ions was prepared by mixing Al3+ with other metal ions. Prepared metal ion solution was added to the C-AgNPs solution. Fig. 6d shows that Al3+ mixed samples show a change in color of C-AgNPs from dark yellow to brown. These results confirm that other metal ions did not significantly interfere with the detection of Al3+ ions. Thus, the colorimetric assay could now be narrowed down to Al3+ only, ruling out all another metal ion tested for the selectivity.
3.4 Sensitivity of C-AgNPs
The performance of the developed Al3+ sensor is pH-dependent because the pH of the solution influences the synthesis of nanoparticles and affects the interaction between C-AgNPs and Al3+ ions. Since the synthesis of C-AgNPs was not much affected by pH in the range of 9.0 to 11.0, we tested the sensor's sensitivity for Al3+ in this range. The value of A0-A was maximum at pH 9.0, as shown in Fig. 7a and in Inset of 7a. This shows that at pH 9.0, bonds between Al3+ and cinchona alkaloids formed more easily and resulted in a change in color of the C-AgNPs solution. The color of C-AgNPs changed as the function of Al3+ concentration, which was monitored by UV–Vis spectroscopy. The color of the C-AgNPs solution changed progressively from dark yellow to brown and finally started to become transparent, as shown in Fig. 8a. A decrease in intensity at 402 nm with a continuous red-shift was seen with an increasing concentration of 0.01 ppm to 1 ppm (Fig. 8b). The difference in absorption was measured in triplicates for the quantitative detection of Al3+, as shown in Fig. 8c. A linear correlation of the difference in absorption intensity increased linearly with increasing concentration of Al3+ in the range of 0.05 ppm to 1 ppm with an R2 value of 0.9908.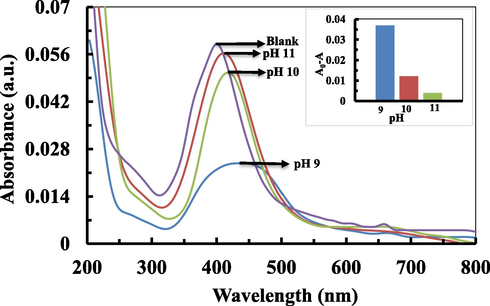
UV–Vis spectra show the effect of pH on the Al3+ sensing; inset bars also represent the effect of pH on sensing of Al3+.
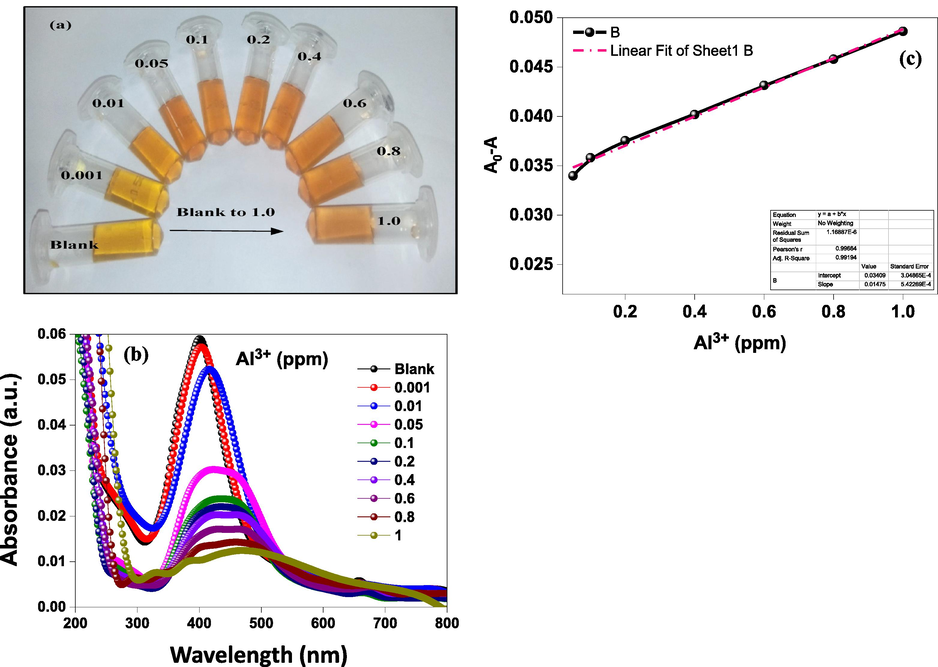
Optical images showing the visual change in color of C-AgNPs as the function of Al3+ concentration (a) UV–Vis spectra of C-AgNPs as the function of the concentration of Al3+ (b), calibration plot of the difference in absorbance with various concentration of Al3+ showing the linearity of the probe in the range of 0.05–1 ppm (c).
HRTEM and DLS studies were carried to support the results. The aggregation of C-AgNPs in the presence of Al3+ was directly supported by HRTEM (Fig. 9a and c) and increased in hydrodynamic diameter from 17 nm to 379 nm as shown by DLS analysis (Fig. 9b and d). This difference in HRTEM and DLS results is because DLS records higher values as light scattered from both core particles and the layer on the surface of nanoparticles, while in the electron-microscopic analysis, only metallic particles core is measured. Zeta potential of the synthesized C-AgNPs was −19.9 mV, which reduced to 13.9 mV on the addition of Al3+ (Fig. S3). The change in zeta potential from negative to positive confirms the interaction between negative charges present on the surface of nanoparticles which cause non-cross-linking aggregation of C-AgNPs.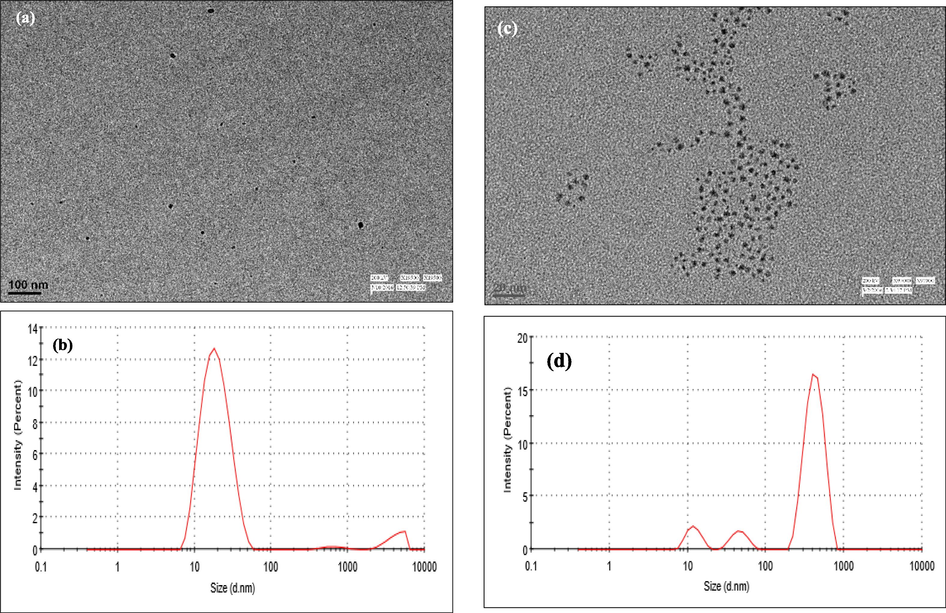
HRTEM images (a) and size distribution (b) of C-AgNPs in the presence of Al3+, the average diameter of C-AgNPs is 3–4 nm, HRTEM images (c) and size distribution (d) of C-AgNPs in the absence of Al3+.
Based on the above results, a possible sensing mechanism of Al3+ has been proposed (Scheme 1). Al3+ is a hard acid, and it has a strong attraction toward hard bases such as N and O (Chen et al., 2015). Alkaloids present in the bark extract contain N and O atoms. Thus, Al3+ can coordinate with N and hydroxyl O of alkaloids. This coordination was further confirmed by the FT-IR spectra (Fig. 3c). Two new peaks appeared at 667 cm−1 and 1020 cm−1, showing the coordination of N and O to the Al3+. The coordination results in non-crosslinking aggregation of C-AgNPs, which causes a visual change in the color of nanoparticles.
3.5 Application of sensor in a real water sample
To show the applicability of our sensor in real water samples, a recovery test was performed. The concentrations (0.2 ppm and 0.6 ppm) Al3+ were spiked in drinking and pond water. These samples were analyzed by using C-AgNPs and AAS. Results from the determination of Al3+ ion from water sources are compiled in Table 1. These results show that the proposed method shows good recoveries in the range of 85–108.34%. The results are in accordance with AAS results.
Sample
Added amount (ppm)
Found amount (ppm) (mean ± E, n = 3)
Recovery (%)
AAS
Drinking water
0.2
0.19 ± 0.01
95 ± 5
0.2
0.6
0.61 ± 0.02
105 ± 3.34
0.59
Pond water
0.2
0.18 ± 0.01
90 ± 5
0.2
0.6
0.59 ± 0.01
98.33 ± 1.67
0.6
Therefore, this method could be successfully used for the determination of Al3+ in real water samples. The performance of the reported colorimetric method was compared with that of several other methods for detecting Al3+ (Table S1). Evidently, the present method involves a simple green method for synthesizing AgNPs and allows us to detect Al3+ conveniently with a LOD lower than the limit set by USEPA and WHO. Therefore, the present method provides a highly selective and sensitive probe for detecting Al3+ ions without any tedious procedure.
4 Conclusion
We successfully fabricated cinchona bark extract stabilized AgNPs by a biocompatible method. The resulting colloidal nanoparticles were used for the detection of Al3+ with a LOD of 0.01 ppm. High stability and sensitivity of the probe were obtained at pH 9.0. Change in characteristic SPR band at 402 nm of C-AgNPs in the presence of Al3+ ion was due to aggregation of C-AgNPs. The aggregation of nanoparticles was confirmed by HRTEM and DLS analysis. Zeta potential measurement confirms the interaction of Al3+ with moiety present on the surface of AgNPs. The synthesized C-AgNPs did not show any interference during detection of Al3+ in the presence of other environmentally relevant metal ions. The proposed method was successfully applied to the real water samples analysis. The advantage of the present protocol is a synthesis of mono-dispersed AgNPs with 3–4 nm size by a simple, rapid, cost-effective, and moreover, a biocompatible method that can be used for real water sample analysis.
Acknowledgments
Dinesh Kumar is also thankful to DST, New Delhi, for this work's financial support (sanctioned vide project Sanction Order F. No. DST/TM/WTI/WIC/2K17/124(C). The authors extend their sincere appreciation to the Researchers Supporting Project number (RSP-2020/266), King Saud University, Riyadh, Saudi Arabia for the support. Priyanka also thanks AIIMS, New Delhi, and the University of Rajasthan for providing an HRTEM facility.
Declaration of Competing Interest
The authors declare that they have no known competing financial interests or personal relationships that could have appeared to influence the work reported in this paper.
References
- Colorimetric determination of Al(III) based on the aggregation of gold nanoparticles functionalized with novel 4-benzoyl pyrazolone derivative. AIP Conf. Proc.. 2018;1972:30012.
- [CrossRef] [Google Scholar]
- Quinine, an old anti-malarial drug in a modern world: role in the treatment of malaria. Malar. J.. 2011;10:144.
- [CrossRef] [Google Scholar]
- Synthesis of NiOx@NPC composite for high-performance supercapacitor via waste PET plastic-derived Ni-MOF. Compos. Part B Eng.. 2020;183:107655
- [CrossRef] [Google Scholar]
- Dielectric properties of Ba1-xSrxZrO3 (0 ≤ x ≤ 1) nanoceramics developed by citrate precursor route. J. Mater. Res.. 2013;28:1070-1077.
- [CrossRef] [Google Scholar]
- Green synthesis of gold nanoparticles under sunlight irradiation and their colorimetric detection of Ni2+ and Co2+ ions. RSC Adv.. 2015;5:11458-11468.
- [CrossRef] [Google Scholar]
- A sensitive triple colorimetric sensor based on plasmonic response quenching of green synthesized silver nanoparticles for determination of Fe2+, hydrogen peroxide, and glucose. Colloids Surfaces A Physicochem. Eng. Asp.. 2018;545:138-146.
- [CrossRef] [Google Scholar]
- Fabrication and characterization of p-Si/n-In2O3 and p-Si/n-ITO junction diodes for optoelectronic device applications. Surf. Interf.. 2021;23:100992
- [CrossRef] [Google Scholar]
- Colorimetric detection of Al(iii) in vermicelli samples based on ionic liquid group coated gold nanoparticles. RSC Adv.. 2015;5:62260-62264.
- [CrossRef] [Google Scholar]
- Colorimetric detection of Al3+ ions using triazole–ether functionalized gold nanoparticles. Talanta. 2013;117:70-74.
- [CrossRef] [Google Scholar]
- Nanostructured photocatalysts and their applications in the photocatalytic transformation of lignocellulosic biomass: an overview. Materials (Basel). 2009;2:2228-2258.
- [CrossRef] [Google Scholar]
- Excellent disinfection and fluoride removal using bifunctional nanocomposite. Chem. Eng. J.. 2018;337:193-200.
- [CrossRef] [Google Scholar]
- Dual adsorption behaviour of fluoride from drinking water on Ca-Zn(OH)2CO3 adsorbent. Surf. Interfaces. 2017;6:154-161.
- [CrossRef] [Google Scholar]
- Enhanced fluoride removal performance by Ce–Zn binary metal oxide: adsorption characteristics and mechanism. J. Fluor. Chem.. 2017;199:67-76.
- [CrossRef] [Google Scholar]
- Colorimetric and naked eye detection of trace Hg2+ ions in the environmental water samples based on plasmonic response of sodium alginate impregnated by silver nanoparticles. J. Hazard. Mater.. 2019;374:329-340.
- [CrossRef] [Google Scholar]
- Green synthesis of silver nanoparticles using Carica Papaya fruit extract under sunlight irradiation and their colorimetric detection of mercury ions. J. Phys. Conf. Ser.. 2017;817:12029.
- [CrossRef] [Google Scholar]
- Determination of Cr(III) ions based on plasmonic sensing and anodic stripping voltammetry with amplification of Ag nanoparticles. Microchem. J.. 2020;157:104995
- [CrossRef] [Google Scholar]
- Size and stability modulation of ionic liquid functionalized gold nanoparticles synthesized using Elaeis guineensis (oil palm) kernel extract. Arab. J. Chem.. 2020;13:75-85.
- [CrossRef] [Google Scholar]
- Kacprzak, K., 2013. Chemistry and Biology of Cinchona Alkaloids 21.
- Label-Free Colorimetric Nanosensor for the Selective On-Site Detection of Aqueous Al3+. ACS Sustainable Chemistry & Engineering. 2017;5:4552-4562.
- [Google Scholar]
- Al3+ ion sensing at attomole level via surface-potential mapping of gold nanoparticle complexes. Sens. Actuat. B Chem.. 2018;255:2179-2186.
- [CrossRef] [Google Scholar]
- Gold nanoparticle-based colorimetric assay for selective detection of aluminium cation on living cellular surfaces. Chem. Commun.. 2010;46:988-990.
- [CrossRef] [Google Scholar]
- Silver and gold nanoparticles as chemical probes of the presence of heavy metal ions. J. Mol. Liq.. 2020;302:112559
- [CrossRef] [Google Scholar]
- Surfactant assisted nano-composite cation exchanger: Development, characterization and applications for the removal of toxic Pb2+ from aqueous medium. Chem. Eng. J.. 2014;235:100-108.
- [CrossRef] [Google Scholar]
- Nanoscience and nanostructures for photovoltaics and solar fuels. Nano Lett.. 2010;10:2735-2741.
- [CrossRef] [Google Scholar]
- Chemically modified silver and gold nanoparticles in spectrometric analysis. J. Anal. Chem.. 2019;74:355-375.
- [CrossRef] [Google Scholar]
- Selective colorimetric sensing of Zn(II) ions using green-synthesized silver nanoparticles: Ficus benjamina extract as reducing and stabilizing agent. Mater. Res. Bull.. 2019;112:1-8.
- [CrossRef] [Google Scholar]
- Selective colorimetric/visual detection of Al3+ in ground water using ascorbic acid capped gold nanoparticles. Sens. Actuat. B Chem.. 2017;248:124-132.
- [CrossRef] [Google Scholar]
- Size-controlled and optical properties of monodispersed silver nanoparticles synthesized by the radiolytic reduction method. Int. J. Mol. Sci.. 2013;14:7880-7896.
- [CrossRef] [Google Scholar]
- Nanotechnology for sustainable energy. Renew. Sustain. Energy Rev.. 2009;13:2373-2384.
- [CrossRef] [Google Scholar]
- Aluminum in the central nervous system (CNS): toxicity in humans and animals, vaccine adjuvants, and autoimmunity. Immunol. Res.. 2013;56:304-316.
- [CrossRef] [Google Scholar]
- Shinde, S., Kim, D.-Y., Saratale, R.G., Syed, A., Ameen, F., Ghodake, G., 2017. A Spectral Probe for Detection of Aluminum (III) Ions Using Surface Functionalized Gold Nanoparticles. Nanomater. (Basel, Switzerland) 7, 287. 10.3390/nano7100287.
- Aluminum in the environment and human health. Environ. Health Perspect.. 1974;8:3-95.
- [CrossRef] [Google Scholar]
- Polymeric sorbents modified with gold and silver nanoparticles for solid-phase extraction of proteins followed by MALDI-TOF analysis. Microchim. Acta. 2017;184:1683-1690.
- [CrossRef] [Google Scholar]
- Bio-functionalized silver nanoparticles for selective colorimetric sensing of toxic metal ions and antimicrobial studies. Spectrochim. Acta Part A Mol. Biomol. Spectrosc.. 2014;129:35-42.
- [CrossRef] [Google Scholar]
- Specific and sensitive colorimetric detection of Al3+ using 5-mercaptomethyltetrazole capped gold nanoparticles in aqueous solution. Talanta. 2014;119:306-311.
- [CrossRef] [Google Scholar]
- Highly sensitive determination of Co(II) ions in solutions by using modified silver nanoparticles. Spectrochim. Acta Part A Mol. Biomol. Spectrosc.. 2020;239:118487
- [CrossRef] [Google Scholar]
- 0. Dictionary of Alkaloids. Second Edition with CD-ROM. Anticancer Res. 30, 1036.
Appendix A
Supplementary data
Supplementary data to this article can be found online at https://doi.org/10.1016/j.jksus.2021.101527.
Appendix A
Supplementary data
The following are the Supplementary data to this article:


