

Translate this page into:
Benthic foraminifera as bioindicators of anthropogenic pollution in the Red Sea Coast, Saudi Arabia
⁎Corresponding author. mymohamed@ksu.edu.sa (Mohamed Youssef)
-
Received: ,
Accepted: ,
This article was originally published by Elsevier and was migrated to Scientific Scholar after the change of Publisher.
Peer review under responsibility of King Saud University.
Abstract
The concentrations of Fe, Mn, Cu, Ni, Zn, Pb, Cr, Co, and Cd were measured in the tests of two foraminiferal species (Sorites orbibulus and Peneroplis planatus) using ICP-MS to assess the marine contamination. Iron was the most abundant metal (3294 μg/g), followed by Mn (133 μg/g), Cu (34.7 μg/g), Zn (28.3 μg/g), Cr (25 μg/g), Ni (18.9 μg/g), Pb (12.2 μg/g), Co (9.5 μg/g), and Cd (0.85 μg/g). The values enrichment factor, geo-accumulation index, and contamination factor show that the foraminiferal shells are enriched in (Cd, Cu, Pb) posing an ecological risk. Iron shows highest concentration amongst the heavy metals recorded in the study shells, however, shows low concentration in comparison with surrounding areas of Red Sea coast in Saudi Arabia and Egypt. Other heavy metals show higher concentrations than those recorded in Egypt and Saudi Arabia. The elevated heavy metal concentrations in the foraminiferal tests may be attributed to the industrial and urban activities along Yanbu coast.
Keywords
Heavy metals
Benthic foraminifera
Contamination
Red Sea
Saudi Arabia

1 Introduction
The heavy metal incorporation into foraminiferal tests is a good tool for environmental applications, and facilitates monitoring of anthropogenic footprints on the environmental systems (Schmidt et al., 2021). Many attempts used foraminiferal tests to assess the heavy metal contamination in polluted coastal environments (Frontalini and Coccioni, 2008; Frontalini, 2012; Al-Kahtany et al., 2015; Youssef, 2015; Price et al., 2019; AlKahtany et al., 2015; Al-Kahtanya et al., 2020; Sagar et al., 2021; Oron et al., 2021; Barik et al., 2022; Piwoni-Piórewicz et al., 2022). Large benthic foraminifera in the shallow shelf areas have algal symbionts (Hallock, 1999). Large benthic foraminifera are used also as bio-indicators of environmental conditions in many reef settings (Hallock et al., 2003; Gebhardt et al., 2013; Sagar et al., 2021).
The coastal area rapidly changed with the transformation of Saudi Arabia into modern industrial country (Badr et al., 2009). Many studies use sediments and water samples to analyze and monitor the ecosystem of the Red Sea coast's coastal zones (e.g. El-Sorogy et al., 2020; Youssef and El-Sorogy, 2016; Kahal et al., 2020; Youssef et al., 2020; El Zokm et al., 2020).
Few studies have examined the Red Sea's environmental contamination in Saudi Arabia using geochemical analysis of benthic foraminiferal tests for heavy metal levels (e.g. Youssef, 2015; Youssef et al., 2021). The aim of this study is to use the foraminiferal shell as bioindicators for the natural and anthropogenic inputs affect coastal areas along the Red Sea coast in Yanbu.
2 Materials and methods
The study area lies along the Yanbu coastline, Saudi Arabia, between 23° 40́ 33́́ N – 38° 29′ 11″ E and 24° 15′ 52″ N – 37° 43′ 03″ E (Fig. 1). The samples were collected from the subtidal zone of the Yanbu coastline (Fig. 1). The grain size analysis shows that the main component of the most samples are silt and sand (El-Sorogy et al., 2021).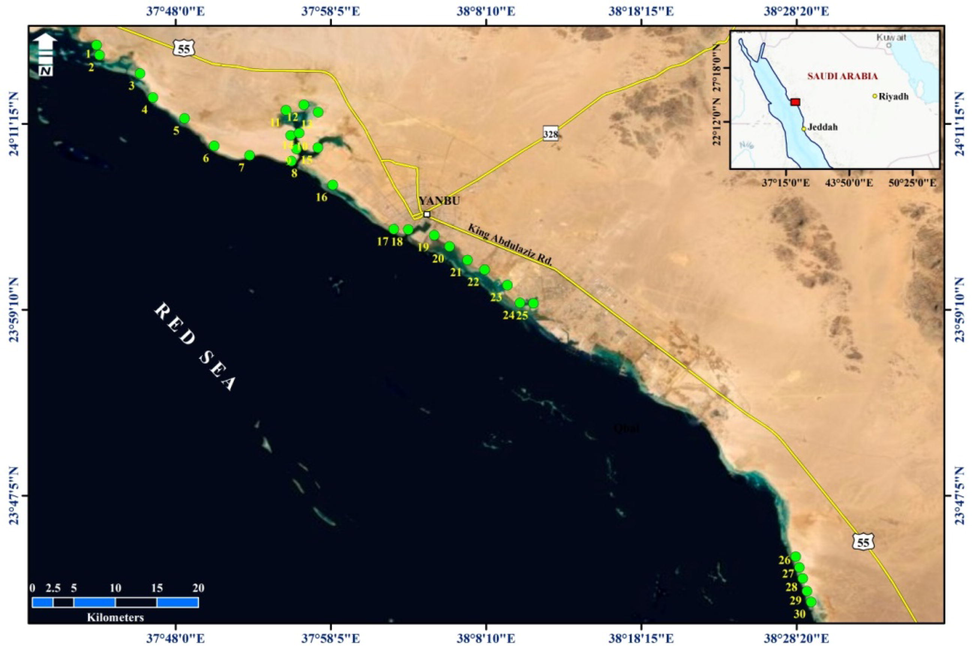
Location map for the Study Area and Sampling Stations (El-Sorogy et al., 2021).
Rose Bengal solution (5 g of Rose Bengal in 1 L of ethanol) is used to stain the samples in the field. The standard preparation technique of foraminifera is used; sediment was stored for 15 days before washing with tap water over a 0.625-mm mesh to remove fine silt and clay. The residues were examined under stereo zoom microscope after drying; the selected foraminiferal species were picked. The taxonomic classification of Hottinger et al. (1993) was used in the identification.
We picked the living tests of S. orbiculus, P. planatus from 14 samples as follows (1, 3, 4, 5, 7, 8, 13, 14, 15, 17, 18, 19, 20, and 30). We picked ≤0.2 g of each studied species and analyzed them for Iron, manganese, copper, zinc, chromium, nickel, lead, cobalt, and cadmium. The samples were analyzed with ICP-MS (Inuctive Coupled Plasma-Mass Spectrometer, Thermo Fisher scientific, Instrument) in central laboratory college of science (CLCS) King Saud University, Riyadh, KSA. Each sample was analyzed in three replicates. Digestions of samples were performed on Topwave Analytik Jena microwave digestion system using ultra-pure Nitric acid (HNO3, 63 %), Hydrogen Fluoride (40 %) and Hydrochloric acid (HCl, 36 %). About 0.1 gm sample was put into the DAP 60 digestion vessels of 60 ml capacity. Add 6 ml Hydrochloric acid, 2 ml nitric acid and 2 ml Hydrochloric acid then shake the mixture carefully. A blank without the sample was also carried out through the complete procedure. Univariate statistical analyses were conducted using SPSS (ver. 23, IBM Corp., Armonk, NY, USA). Correlation coefficient analysis was used to create a correlation matrix between metal concentrations. Univariate statistical analyses were conducted using hierarchical clustering between groups (Ward’s method) to determine Euclidean distances. Principal component analysis (PCA) was applied to identify possible the sources of the metals in the studied sediments.
3 Results
The most abundant heavy-metal (Table 1 and Figs. 2, 3) was Fe (3294 μg/g), Mn (133 μg/g), followed by Cu (34.7 μg/g), Zn (28.3 μg/g), Cr (25 μg/g), Ni (18.9 μg/g), Pb (12.2 μg/g), Co (9.51 μg/g), and Cd (0.85 μg/g). The HM concentrations in sediments of the studied samples show the same trend (El-Sorogy et al., 2021).
S. No
Species
Lat.
Long.
Fe
Mn
Cu
Zn
Cr
Ni
Pb
Co
Cd
Y-1
S. orbiculus
24° 15′ 52″
37° 43′ 03″
3000
150
34.8
30.8
21
18
11.9
9.8
1.1
P. planatus
3010
165
35.2
31.1
21.6
17.6
11.3
10.2
1
Y-3
S. orbiculus
24° 14′ 31″
37° 45′ 41″
3205
165
37.2
29.5
23.9
17.6
11.5
10
1
P. planatus
3003
170
36.8
31
24.1
17
12.5
10.2
0.9
Y-4
S. orbiculus
24° 12′ 58″
37° 46′ 31″
3817
195
45.5
37.2
37.2
20.8
9.2
11.4
0.9
P. planatus
3750
193
44.8
36.8
35.5
20.6
9.8
12
0.7
Y-5
S. orbiculus
24° 11′ 36″
37° 48′ 34″
2080
105
32.8
23.6
26.6
21.3
13
7.2
0.7
P. planatus
2003
104
31.3
24
25.2
20.1
12.9
8
1.2
Y-7
S. orbiculus
24° 09′ 12″
37° 52′ 48″
2550
109
32.3
21.4
26.3
19.5
14.1
7.9
0.9
P. planatus
1483
107
34.8
20.8
25.5
20.1
13.8
8
0.5
Y-8
S. orbiculus
24° 08′ 50″
37° 55′ 31″
3995
129
37.3
33.6
21.1
21
13.2
11.2
0.6
P. planatus
4013
127
36.8
32.4
20.8
20.2
12.8
11
0.6
Y-13
S. orbiculus
24° 12′ 01″
37° 57′ 15″
4150
125
33.9
31.9
25.3
18
12.1
9.9
0.9
P. planatus
4061
127
32
33
24.5
18.8
11.8
10.2
0.8
Y-14
S. orbiculus
24° 10′ 39″
37° 56′ 01″
3497
131
35.8
31.2
25.8
18.2
12.4
8.6
0.6
P. planatus
3605
135
36.3
31
26.2
18
12
8.3
0.9
Y-15
S. orbiculus
24° 09′ 42″
37° 57′ 14″
2807
135
33
31.2
22.8
16.7
13.2
9.4
0.8
P. planatus
4101
137
31.7
29.8
23
16.5
13
9
0.7
Y-17
S. orbiculus
24° 04′ 24″
38° 02′ 10″
4001
133
36.4
29.2
24.5
17.6
11.8
9.6
0.8
P. planatus
3975
131
36
28.8
24
17.4
11.5
9.2
0.6
Y-18
S. orbiculus
24° 04′ 23″
38° 03′ 06″
3550
111
34
24.2
29
20.2
11.6
11.6
0.9
P. planatus
3597
109
33.4
22.9
30.1
20
10.2
11.2
1
Y-19
S. orbiculus
24° 04′ 01″
38° 04′ 48″
2805
110
32
31
23
17.5
11.8
9
1.3
P. planatus
3580
108
29
20.9
21.2
18.5
12
8.5
1
Y-20
S. orbiculus
24° 03′ 17″
38° 05′ 47″
3970
135
28.7
24
25.3
16.5
11.7
10
1.2
P. planatus
4000
131
33.7
25
21.1
21
13
7.8
0.8
Y-30
S. orbiculus
23° 40′ 33″
38° 29′ 11″
2560
125
31.5
21.3
24.2
19.6
14.1
8
0.7
P. planatus
2075
127
33.3
24
20.7
21.3
13
9.2
0.6
Average
3294
133
34.7
28.3
25
18.9
12.2
9.51
0.85
Maximum
4150
195
45.5
37.2
37.2
21.3
14.1
12
1.3
Minimum
1483
104
28.7
20.8
20.7
16.5
9.2
7.2
0.5
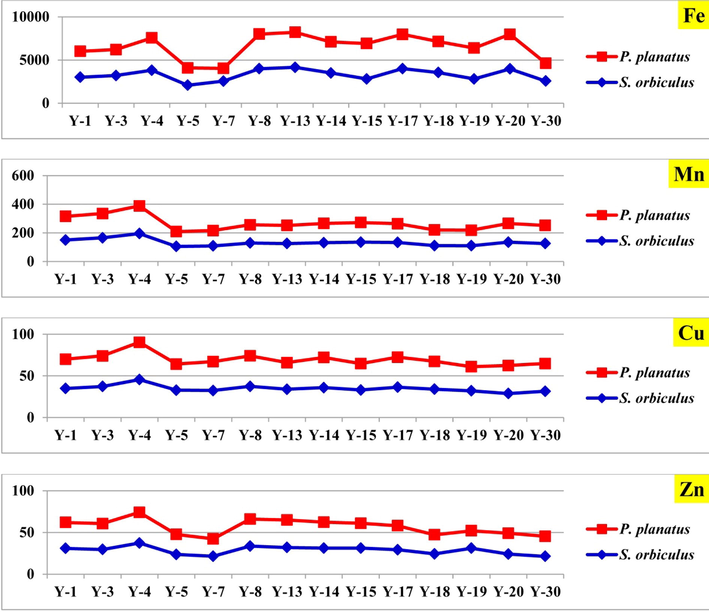
Heavy-metal concentrations of foraminiferal tests of the study coastal area; Fe, Mn, Cu, and Zn.
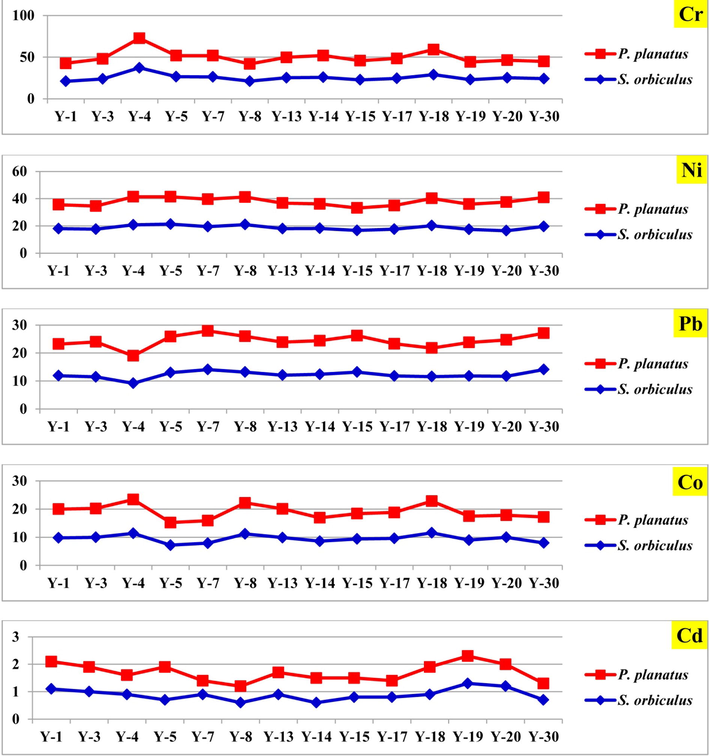
Heavy-metal concentrations of foraminiferal tests of the study coastal area; Cr, Ni, Pb, Co, and Cd.
The average concentration of Fe (Table 1; Fig. 2) was lower than the average value recorded in the shells of S. orbiculus, P. planatus from Sharma (Youssef et al., 2021), also lower than the average values recorded in Jeddah (Youssef, 2015), While the recorded values higher than those reported at Egyptian Red Sea coast (e.g. Youssef et al., 2017). S. orbiculus shows the highest concentration of Mn (195 μg/g), where P. planatus shows the lowest value (104 μg/g) in samples 4 and 5 respectively (Table 1; Fig. 2). Mn shows higher concentration than was recorded in Jeddah and Egyptian Coast (e.g. Madkour and Ali, 2009; Youssef, 2015). El-Sorogy et al. (2021) reported 192 μg/g of Mn in the sediments, may be due to terrestrial influx by wadies and aeolian deposition (Bantan et al., 2020), or human activities. The Cu bioaccumulation in foraminifera record average value 34.7 μg/g, where the highest value (45.5 μg/g) was recorded in in sample 4 and the lowest value (28.7 μg/g) was recorded in in S. orbiculus sample 20 (Table 1; Fig. 2). The comparison between our average Cu levels and those in other sites was shown in Table 3), where it is higher than south Saudi coast (Youssef, 2015) and lower than northern Saudi coast and Egyptian coast (e.g. Mansour et al., 2005; Youssef et al., 2021). The average concentration of Zn in foraminiferal tests in Yanbu Coast is 28.3 μg/g. The highest value (37.2 μg/g) was recorded in S. orbiculus in sample 4 where the lowest value (20.8 μg/g) was reported in P. planatus in sample 7 (Table 1; Fig. 2). Sediments show 80.4 μg/g average concentration of Zn (El-Sorogy, et al., 2021). Zinc remains in the marine environment for long time after precipitate with calcium carbonate (Rothenstein et al., 2012).
Cr concentration record highest value in S. orbiculus (37.2 μg/g) of sample 4, while the lowest (20.7 μg/g) was in P. planatus in sample 30 (Table 1; Fig. 3). The comparison of the average concentration of Cr with the different areas along Red Sea coast (e.g. Youssef, 2015; Youssef et al., 2021) indicate low average value, while it nearly around the background concentration in uncontaminated sediment (Oana, 2006). The average concentration of Ni in the shells is 18.9 μg/g and the values range from 16.5 μg/g to 21.3 μg/g in S. orbiculus in samples 20 and 5 respectively (Table 1; Fig. 3). High average value of Ni was recorded comparing to that recorded on the Egyptian and Saudi coast (Table 2). The average value of Ni concentrations in sediments was 23.5 μg/g (El-Sorogy et al., 2021). Anthropogenic and industrial discharge may be the possible sources for Ni, however De Carlo and Spencer (1995) suggest little importance for anthropogenic contribution for Ni to sediment. The concentration of Pb ranges from 9.2 μg/g in S. orbiculus of sample 4 to 14.1 μg/g in sample 30 (Table 1; Fig. 3). In comparison with the Pb concentration with other areas, it is significantly lower than the reported values from Egyptian coast, and higher than those recorded from Jeddah (Table 2). Industrial origin of lead is the probable source (Abu-Zied et al., 2013; Youssef, 2015). The lowest value of Co (7.2 μg/g) was recorded in S. orbiculus of sample 5, the highest value (12 μg/g) was recorded in P. planatus in sample 4 (Table 1; Fig. 3). The concentration of Cd was relatively low. The lowest value (0.5 μg/g) is recorded in P. planatus in samples 7, while the highest value (1.3 μg/g) is recorded in S. orbiculus of sample 19 (Table 1; Fig. 3). The average concentration of Cd is 0.85 μg/g. In comparison with the surrounding areas low average value was reported (Table 2). Cd concentration shows 0.89 μg/g average value in sediments samples.
Location
Fe
Mn
Cu
Ni
Zn
Pb
Cr
Co
Cd
References
Yanbu, Red Sea
3294
133
34.7
28.3
25
18.9
12.2
9.51
0.85
Present study
Sharma-Maqnah, Red Sea
3367
142
30.4
13.9
24.1
6.95
20.9
4.6
0.8
Youssef el al., 2021
Red Sea Coast, Egypt
901.2
–
5.4
19.9
13.8
9.4
8.6
2.5
0.3
El-Kahawy et al., 2020
Red Sea Coast, Egypt
2098
124.1
7.3
11.5
11.1
6.7
–
2.6
0.7
Youssef et al., 2017
South Jeddah, Saudi Arabia
7182
27.6
8.7
23.3
14.9
22.9
38.5
–
0.09
Youssef, 2015
Salman Bay, Saudi Arabia
7698
14.3
8.2
24.2
13.3
10.8
36.24
–
0.1
Coastal lagoons, Red Sea, Egypt
1115.3
35.02
17.5
28.2
18.2
23.9
–
–
1.5
Madkour and Ali, 2009
Red Sea coast, Egypt
760
43.3
46.9
33.9
22
28.5
–
–
1.6
Mansour et al., 2005
4 Discussion
The shells exhibit enrichment in certain elements with ecological risk values for EF, Igeo, and CF (Table 3). For the calculation of different indicators please see supplementary table. Cd record the highest average value of EF (>10), indicating possible source of pollutants from urban, industrial activities and tourism projects in the coast. The average values for Cu and Pb were >5; and for Zn, Cr, and Co they were >2, indicating natural origins. Cd had the highest degree of enrichment (EF = 44 and 41 in S.orbiculus and P. planatus respectively. The lowest reported value of EF is for Mn < 2 indicate no enrichment to minor enrichment (Youssef et al., 2020). The average CF value for Cd indicated a moderate contamination (CF = 2.95 and 2.69 at S. orbiculus and P. planatus, respectively). The average CF value for the rest of the heavy metals indicated low contamination factor. The average Igeo value of Cd (Igeo = 1.34 and 1.25 in S. orbiculus and P. planatus respectively) indicated that the shells were moderately polluted, where are unpolluted for the rest of heavy metals. Q mode HCA subdivided the studied heavy metals into two different clusters (Fig. 4). The first cluster contains Fe, while the second cluster includes the rest of the recorded heavy metals. The Pearson's correlation shows high positive correlations between certain element pairs, for example: Fe-Zn (r = 512), Fe-Co (r = 0.523), Mn-Cu (r = 0.763), Mn-Zn (r = 0.706), and Mn-Co (r = 0.533). Cu-Zn (r = 0.696), Cu-Cr (r = 0. 036), and Cu-Co (r = 0.554). Zn-Co (r = 0.584). In contrast, there are negative correlations between Fe-Pb and Ni (r = − 0.466, −0.248), Pb-Cr, Co (−0.637, −0.674). See (Table 4) for detailed correlations between the studied heavy metals. The correlations of Zn and Co with Fe suggest that those metals were strongly associated with the Fe oxy-hydroxides phase, and they have a common source (Reitermajer et al., 2011). The positive correlation of Cu, Zn, and Co with Mn is a good proxy for terrigenous material (El-Sorogy et al., 2021). The extraction method of the principal component analysis (PCA) subdivided the variables into three components, accounting 45.37 %, 18.81 %, and 13.29 % of the total variance, respectively (Table 5). The first component presents significant positive loading for Fe, Mn, Cu, Zn, Cr, and Co (0.562, 0.823, 0.846, 0.808, 0.624, 0.803, respectively). The second component presents positive loading for Ni (0.855). The third component presents high positive loading for Cr and Cd (0.530 and 0.664). The moderately severe enriched HMs (Fe, Mn, Cu, Cr, and Co) with positive loading in the first component may have significant anthropogenic origins connected to urbanization, industrial, and agricultural activities (El-Sorogy et al., 2021). Agricultural activities marked by Cd content (Kelepertzis, 2014; Kahal et al., 2020). A varimax method with Kaiser Normalization was used to explain these components. Corresponding to the results from the PCA the HMs in the component plot was distributed into three groups, (Fig. 5). Extraction Method: Principal Component Analysis. a. 3 components extracted.
Metals
Species
EF
Igeo
CF
Min
Max
Aver
Min
Max
Aver
Min
Max
Aver
Fe
S. marginalis
–
–
–
−5.09
−4.09
−4.46
0.04
0.09
0.07
P. planatus
–
–
–
−5.58
−4.11
−4.48
0.03
0.09
0.07
Mn
S. marginalis
1.67
2.86
2.30
−3.60
−2.71
−3.28
0.12
0.23
0.16
P. planatus
1.68
4.01
2.41
−3.62
−2.72
−3.28
0.12
0.23
0.16
Cu
S. marginalis
7.58
16.54
11.44
−1.23
−0.57
−0.97
0.64
1.01
0.77
P. planatus
8.11
24.61
12.04
−1.22
−0.59
−0.97
0.64
1.00
0.77
Zn
S. marginalis
3.00
5.64
4.42
−0.87
−0.32
−0.59
0.22
0.39
0.30
P. planatus
2.90
6.97
4.46
−0.90
−0.33
−0.62
0.22
0.39
0.29
Cr
S. marginalis
2.77
6.71
4.21
−0.89
−0.32
−0.71
0.23
0.41
0.28
P. planatus
2.72
9.02
4.27
−0.90
−0.36
−0.74
0.23
0.39
0.27
Ni
S. marginalis
2.88
7.11
4.15
−1.13
−0.87
−1.00
0.24
0.31
0.28
P. planatus
2.79
9.41
4.46
−1.13
−0.87
−0.99
0.24
0.31
0.28
Pb
S. marginalis
5.69
14.75
9.29
−0.49
−0.06
−0.21
0.46
0.71
0.61
P. planatus
6.17
21.96
9.69
−0.43
−0.08
−0.22
0.49
0.69
0.61
Co
S. marginalis
5.93
8.60
7.35
−1.98
−1.30
−1.59
0.38
0.61
0.50
P. planatus
4.84
13.40
7.69
−1.87
−1.25
−1.60
0.41
0.63
0.50
Cd
S. marginalis
23.63
72.92
44.06
0.98
1.75
1.34
2.00
4.33
2.95
P. planatus
23.52
94.26
41.80
0.80
1.67
1.25
1.67
4.00
2.69
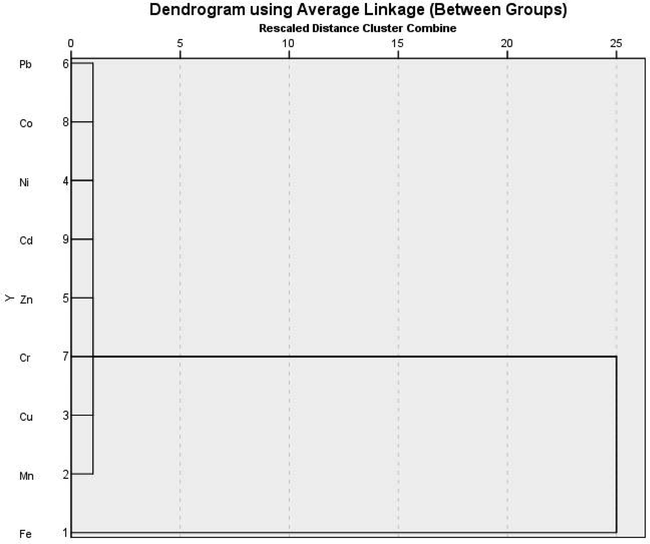
Dendrogram of 9 metals in bottom sediment samples taken from the North Red Sea coast using hierarchal cluster analysis.
Fe
Mn
Cu
Ni
Zn
Pb
Cr
Co
Cd
Fe
1
Mn
0.307
1
Cu
0.231
0.763**
1
Ni
−0.248
−0.150
0.274
1
Zn
0.512**
0.706**
0.696**
−0.186
1
Pb
−0.466*
−0.575**
−0.564**
0.042
−0.502**
1
Cr
0.103
0.392*
0.603**
0.288
0.237
−0.637**
1
Co
0.523**
0.533**
0.554**
0.042
0.584**
−0.674**
0.391*
1
Cd
−0.012
−0.005
−0.293
−0.359
−0.061
−0.320
0.028
0.044
1
Component
1
2
3
Fe
0.562
−0.398
−0.323
Mn
0.823
−0.040
−0.134
Cu
0.846
0.415
−0.102
Ni
−0.001
0.855
0.201
Zn
0.808
−0.148
−0.372
Pb
−0.830
0.167
−0.403
Cr
0.624
0.362
0.530
Co
0.803
−0.073
0.014
Cd
0.004
−0.665
0.664
% of Variance
45.371
18.810
13.287
Cumulative %
45.371
64.181
77.468
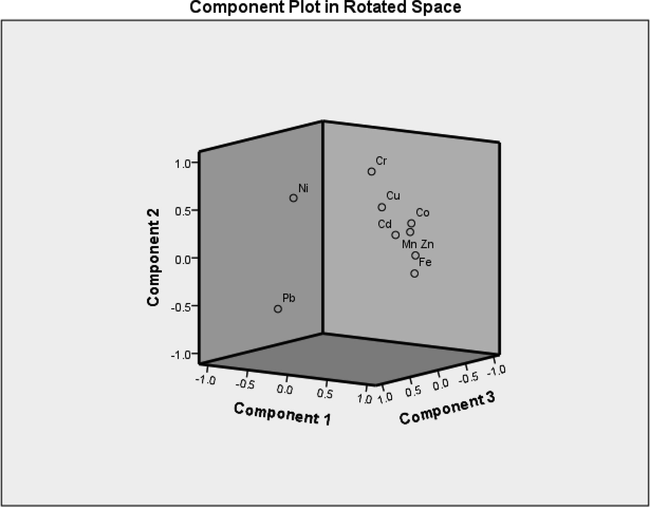
Three component plots using the varimax method with Kaiser Normalization.
5 Conclusion
The concentrations of heavy metals (HM) Fe, Mn, Cu, Ni, Zn, Pb, Cr, Co, and Cd were measured in the two most common species of benthic foraminifera S. orbibulus and P. planatus. The analyses of HMs in the shells of S. orbiculus and P. planatus of 14 surface coastal sediments from Yanbu coastline, Saudi Arabia indicated the following concentrations of heavy metals: Fe (3294) > Mn (133) > Cu (34.7) > Zn (28.3) > Cr (25) > Ni (18.9) > Pb (12.2) > Co (9.51) > Cd (0.85). Among the heavy metals detected in the study area, the foraminiferal tests reveal the highest concentration of Iron. The concentrations of heavy metals in Yanbu are higher than in other regions along the Red Sea coast in Saudi Arabia and Egypt. The HM concentrations along the Yanbu Coast could be attributable to natural sources or anthropogenic resources from industrial and urban activities.
Acknowledgement
This project was funded by the National Plan for Science, Technology and Innovation (MAARIFAH), King Abdulaziz City for Science and Technology, Kingdom of Saudi Arabia, Award Number (14-ENV138-02).
Declaration of Competing Interest
The authors declare that they have no known competing financial interests or personal relationships that could have appeared to influence the work reported in this paper.
References
- Effect of municipal wastewaters on bottom sediment geochemistry and benthic foraminifera of two Red Sea coastal inlets, Jeddah, Saudi Arabia. Environ. Earth Sci.. 2013;68(2):451-469.
- [Google Scholar]
- Geochemical and foraminiferal analyses of the bottom sediments of Dammam coast, Arabian Gulf, Saudi Arabia. Arab. J. Geosci.. 2015;8(12):11121-11133.
- [Google Scholar]
- Geochemical and foraminiferal analyses of the bottom sediments of Dammam coast, Arabian Gulf, Saudi Arabia. Arab. J. Geosci.. 2015;8(12):11121-11133.
- [Google Scholar]
- Benthic foraminifera as bioindicators of environmental quality of Dammam Al-Jubail area, Arabian Gulf, Saudi Arabia. Arab. J. Geosci.. 2020;13:427.
- [Google Scholar]
- Metal pollution records in core sediments of some Red Sea coastal areas, Kingdom of Saudi Arabia. Environ. Mon. Ass.. 2009;155:509-526.
- [Google Scholar]
- Geo-environmental assessment of heavy metals in the bottom sediments of the Southern Corniche of Jeddah, Saudi Arabia. Marine Pollut. Bull.. 2020;161:111721
- [Google Scholar]
- Pintu PrustyBioavailability of metals in coastal lagoon sediments and their influence on benthic foraminifera. Sci. Total Environ.. 2022;825(2022):153986
- [Google Scholar]
- Records of lead and other heavy metal inputs to sediments of the Ala Wai Canal, O’ ahu. Hawai’I Pac Sci Univ Hawaii Press. 1995;49:471-491.
- [Google Scholar]
- Benthic ostracods (crustacean) as a nearshore pollution bio-monitor: examples from the Red Sea Coast of Egypt. Environ. Sci. Poll. Res. 2020
- [CrossRef] [Google Scholar]
- Ecological risk indices for heavy metal pollution assessment in marine sediments of Jeddah Coast in the Red Sea. Int. J. Environ. Anal. Chem. 2020
- [CrossRef] [Google Scholar]
- Distribution, source, contamination, and ecological risk status of heavy metals in the Red Sea-Gulf of Aqaba coastal sediments, Saudi Arabia. Mar. Pollut. Bull.. 2020;158:111411
- [Google Scholar]
- Evaluation of coastal sediments for heavy metal contamination, Yanbu area, Red Sea coast, Saudi Arabia. Marine Pollut. Bull.. 2021;163
- [Google Scholar]
- The response of benthic foraminiferal assemblages to copper exposure: a pilot mesocosm investigation. J. Environ. Prot.. 2012;3:342-352.
- [Google Scholar]
- Benthic foraminifera for heavy metal pollution monitoring: a case study from the central Adriatic Sea coast of Italy. Estuar. Coast. Shelf Sci.. 2008;76(2):404-427.
- [Google Scholar]
- Middle to Late Eocene paleoenvironmenal changes in a marine transgressive sequence from the northern Tethyan margin (Adelholzen Germany) Austr. J. Earth Sci.. 2013;106(2):45-72.
- [Google Scholar]
- Foraminifera as bioindicators in coral reef assessment and monitoring: the FORAM index. Environ. Monit. Assess.. 2003;81:221-238.
- [CrossRef] [Google Scholar]
- Hallock, P. 1999. In Modern Foraminifera (ed. Sen Gupta, B. K.), 123-149. Kluwer Academic Publishers.
- Recent Foraminiferida from the Gulf of Aqaba, Red Sea. Dela SAZU, Ljubljana. 1993;33:1-179.
- [Google Scholar]
- Contamination and ecological risk assessment of the Red Sea coastal sediments, southwest Saudi Arabia. Mar. Pollut. Bull.. 2020;154:111125
- [Google Scholar]
- Accumulation of Heavy Metals in Agricultural Soils of Mediterranean: insights from Argolida Basin, Peloponnese, Greece. Geoderma. 2014;221–222:82-90.
- [CrossRef] [Google Scholar]
- Heavy metals in the benthic foraminifera from the coastal lagoons, Red Sea, Egypt: indicators of anthropogenic impact on environment (case study) Environ. Geol.. 2009;58:543-553.
- [Google Scholar]
- Metals concentration of recent invertebrates along the Red Sea Coast of Egypt: a tool for monitoring environmental hazards. Sedimentology Egypt. 2005;13:171-185.
- [Google Scholar]
- Chromium impact on marine ecosystem. Bull. Univ. Agric. Sci. Vet. Med. Cluj-Napoca. 2006;63:379-384.
- [Google Scholar]
- Benthic foraminifera geochemistry as a monitoring tool for heavy metal and phosphorus pollution- A post fish-farm removal case study. Mar. Pollut. Bull.. 2021;168:112443.
- [Google Scholar]
- Mineralogical and geochemical composition of CaCO3 skeletons secreted by benthic invertebrates from the brackish Baltic Sea. Estuar. Coast. Shelf Sci.. 2022;268:107808.
- [Google Scholar]
- Effects of heavy-metal contaminants (Cd, Pb, Zn) on benthic foraminiferal assemblages grown from propagules, Sapelo Island, Georgia (USA) Marine Micropaleontol.. 2019;147:1-11.
- [CrossRef] [Google Scholar]
- Heavy metal distribution in the sediment profiles of the Sauípe River Estuary, north seashore of the Bahia State, Brazil. Microchem. J.. 2011;99(2):400-405.
- [Google Scholar]
- Rothenstein, D., Baier, J., Schreiber, T., Barucha, V., Bill, J. 2012. Influence of zinc on the calcium carbonate biomineralization of Halomonas halophile Rothenstein, et al. Aquat Biosyst 8:31.
- Geochemistry of large benthic foraminifera Amphisorus hemprichii as a high-resolution proxy for lead pollution in coastal environments. Mar. Pollut. Bull.. 2021;162:111918
- [Google Scholar]
- Heavy metal uptake of near-shore benthic foraminifera during multi-metal culturing experiments. Biogeoscinces discussions 2021
- [CrossRef] [Google Scholar]
- Youssef, M. 2015. Heavy metals contamination and distribution of benthic foraminifera from the Red Sea coastal area, Jeddah, Saudi Arabia. Oceanologia 57 (3), 236–250.
- Environmental assessment of heavy metal contamination in bottom sediments of Al-Kharrar lagoon, Rabigh, Red Sea, Saudi Arabia. Arab. J. Geosci.. 2016;9:474.
- [Google Scholar]
- Invertebrate shells (Mollusca, Foraminifera) as pollution indicators, Red Sea coast Egypt. Journal of African earth sciences. 2017
- [Google Scholar]
- Distribution and metal contamination in core sediments from the North Al-Wajh area, Red Sea, Saudi Arabia. Marine Pollut. Bull.. 2020;152:110924
- [Google Scholar]
- Benthic foraminifera as bio-indicators of coastal marine environmental contamination in the Red Sea-Gulf of Aqaba, Saudi Arabia. Bull. Environ. Contam. Toxicol.. 2021;106(6):1033-1043.
- [Google Scholar]
Appendix A
Supplementary data
Supplementary data to this article can be found online at https://doi.org/10.1016/j.jksus.2022.102383.
Appendix A
Supplementary data
The following are the Supplementary data to this article:


