

Translate this page into:
Association between gliadin content and celiac disease antigenicity using polyclonal and monoclonal antibodies in Indian wheat cultivars
⁎Corresponding author at: Division of Quality & Basic Sciences, PO Box-158, Agrasain Marg, ICAR-Indian Institute of Wheat & Barley Research, Karnal 132001, India. sewa.ram@icar.gov.in (Sewa Ram)
-
Received: ,
Accepted: ,
This article was originally published by Elsevier and was migrated to Scientific Scholar after the change of Publisher.
Abstract
Objectives
Wheat despite being an important staple food across the world has been linked to celiac disease in genetically susceptible individuals predominantly caused by gliadins. In this investigation, varietal differences with respect to celiac antigenicity and their relationship with gliadin content were identified.
Methods
In this study, we analyzed 62 Indian wheat varieties released over six decades (1961–2020) for gliadin content using BSA and gliadin as calibration standards, and assessed their antigenicity using celiac disease-specific polyclonal antibody (pAb).
Results
In addition, a set of 25 wheat varieties was scanned using monoclonal antibody (mAb) raised against gliadin. Large variations in gliadin content (2.75 to 6.98 g 100-1 g whole wheat flour) were observed with the lowest in PBW 34 and the highest in HS 420. Comparative analysis revealed that gliadin content measured using the standard gliadin calibrant was 1.5 times higher than using BSA as calibrant. A positive correlation was observed between total antigenic gliadin and total gliadin content using pAb (r2 = 0.5841; r = 0.763**) and mAb (r2 = 0.4923; r = 0.728**) indicating that total gliadin content is the major factor for eliciting celiac antigenicity.
Conclusion
The study also exhibited that celiac causing potential of wheat is not different among the varieties developed across different periods. The findings contribute to our understanding of the relationship between gliadin content and antigenicity, and thus have potential implications in management of celiac disease.
Keywords
Gliadin correlation
Celiac disease
Antigenicity
Poly- and Monoclonal antibody

1 Introduction
Wheat, a widely consumed crop in nearly 100 countries, is an annual herb belonging to the Gramineae or Poaceae family. It plays a crucial role in ensuring global food security, providing food for 2.5 billion human population across the world (Ramadas et al., 2019). It is the second most consumed staple after rice and contributes approximately 20 % of the calorie needs and 25 % of the dietary protein (Shewry, 2009). Alongside carbohydrates, wheat contains 10–15 % protein, as well as significant amount of dietary fiber and micronutrients (Shewry and Tatham, 2016; Zhao et al., 2009). The protein in wheat grains is comprised of various fractions including albumins, globulins, gliadins (prolamins) and glutenins identified based on their solubility. When wheat flour is mixed with water, a viscoelastic complex called gluten composed of glutenins and gliadins is developed, which determines the end-product quality.
Wheat gluten, comprising 75–80 % of total proteins, is a complex mixture consisting of α/β, γ-, and ω-gliadins, as well as high- and low molecular weight (HMW; LMW) glutenins. These proteins are encoded by medium to large multigene families (Shewry, 2009; Shewry, 2019). Gluten's viscoelastic and extensible properties provide binding and shape-forming characteristics that are highly desirable in the processed food industry and essential for dough making. Gluten imparts a chewy and palatable texture to baked and processed foods. However, for genetically predisposed individuals, gluten can be associated with certain disorders and allergies. Some people experience harmful immune responses against wheat gluten proteins after consumption, leading to inability to tolerate wheat and its products (Cabanillas, 2020; Shewry and Tatham, 2016). One notable disorder linked to gluten is celiac disease (CD), an autoimmune condition directly associated with gluten proteins (Stamnaes and Sollid, 2015). Celiac disease affects approximately 1 % of the global population (pre-dominant in females), with variations based on sex, age, and geographical location (Caio et al., 2019; Narwal et al., 2020). The disease afflicts individuals having HLA-DQ2 and DQ8 genetic backgrounds, and shows intolerance towards gluten proteins of wheat along with prolamins of barley (hordiens), rye (secalins), and oats (avenins) (McAllister et al., 2019; Narwal et al., 2020). Among all the protein fractions, α- and γ-gliadins play significant role in the progression of CD (Balakireva and Zamyatnin, 2016; Garcia-Calvo et al., 2021).
The toxicity of CD is primarily attributed to the presence of large repeat domains containing homologous and repetitive sequences of six-to-eight amino acids, rich in proline (P) and glutamine (Q) (Shewry, 2019). Within the α-gliadin protein, the central domain contains two key sequences: the P and Q-rich heptapeptide PQPQPFP and the pentapeptide PQQPY. Extensive in vitro and in vivo studies conducted in rats and humans have revealed that this domain encompasses a 33-mer peptide of gliadin (LQLQPFPQPQLPYPQPQLPYPQPQLPYPQPQPF), consisting of six overlapping epitopes that play a significant role in the pathogenesis of CD. Remarkably, this 33-mer peptide resists digestion by gastric, pancreatic, and intestinal brush-border membrane endo-proteases (Shan et al., 2002; Ozuna et al., 2015). The 33-mer peptide along with similar peptides, serve as a primary stimulator of the inflammatory response in genetically predisposed individuals (Narwal et al., 2020; Shan et al., 2002). Current guidelines of diagnosing CD suggest anti-tTG-IgA as the initial serological test, complemented by a determination of total IgA levels to rule out concurrent IgA deficiency in both adults and children, however, this approach has certain adversaries towards children. Alternatively, deamidated gliadin peptides-IgG (together with anti-tTG-IgG) estimation remains as the test of choice in patients with IgA deficiency (Raiteri et al., 2022). Though, the serological tests are more related to human trials, our investigation was restricted to in vitro quantification of the celiac antigenicity in wheat flour samples. In this investigation, varietal differences with respect to celiac antigenicity and their relationship with gliadin content were assessed in 62 Indian wheat varieties released over the last six decades using pAb. In addition, a subset of 25 varieties was investigated for their antigenicity using mAb.
2 Materials and methods
2.1 Chemicals
The standard gliadin, bovine serum albumin (BSA), polyclonal antibody (Sigma-Aldrich; G9144), and 3,3′,5,5′-Tetramethylbenzidine (TMB) Horseradish Peroxidase Substrate (soluble) (TMB/E) employed in this experiment were acquired from Sigma-Aldrich, Steinheim, Germany. All chemicals utilized in the study were of the highest purity and obtained from reputable sources such as Invitrogen (HRP-labeled secondary antibody, monoclonal antibody) and other well-established firms.
2.2 Experimental material
Sixty-two wheat varieties (59 Triticum aestivum and 3 Triticum durum) released in India during 6 decades (1961–2020) for commercial cultivation across different wheat growing regions of the country were employed for pAb antigenic study, while a subset of 25 varieties (T. aestivum) was used for mAb antigenic study. All the varieties were grown at the ICAR-IIWBR experimental farm at Karnal location, following standard agricultural practices. Further details of wheat varieties utilized in this study have been provided in Table 1.
Decade
Variety
Year of release*
Total gliadin (g 100 g−1 WWF)
Total protein (@12 %
moisture basis)
Gliadin/total
protein ratio (%)
Gliadin as calibrant
BSA as calibrant
1961–1970
Choti lerma
1969
3.76 ± 1.43
2.71 ± 0.70
9.61
39.13
HYB 633
1967
4.43 ± 0.15
3.04 ± 0.07
9.61
46.10
NP 404
1967
4.46 ± 0.33
3.06 ± 0.16
11.81
37.76
NP 818
1967
4.91 ± 0.57
3.28 ± 0.28
13.42
36.62
C 306
1969
5.18 ± 0.42
3.41 ± 0.21
10.66
48.60
NP 839
1967
5.72 ± 0.37
3.68 ± 0.18
11.08
51.68
Bijaya red
1965
5.89 ± 0.44
3.76 ± 0.22
10.56
55.79
1971–1980
A-9–30
1974
4.46 ± 0.84
3.06 ± 0.41
11.15
39.99
HD 2189
1980
4.84 ± 0.99
3.25 ± 0.48
10.10
47.88
A 28
1978
4.98 ± 0.50
3.31 ± 0.24
13.38
37.24
GW 10
1976
5.10 ± 0.78
3.37 ± 0.38
11.82
43.11
NI 5439
1975
5.11 ± 1.05
3.38 ± 0.51
10.42
49.04
D 134
1974
5.29 ± 0.38
3.47 ± 0.19
10.61
49.89
GW 1 (d)
1980
5.46 ± 0.46
3.55 ± 0.23
10.67
51.21
GW 18
1978
5.68 ± 0.33
3.65 ± 0.16
11.99
47.36
HD 2177
1980
5.90 ± 0.82
3.76 ± 0.40
12.93
45.67
HD 1925
1976
5.98 ± 0.27
3.80 ± 0.13
11.81
50.54
1981–1990
PBW 34
1985
2.75 ± 0.65
2.22 ± 0.32
11.08
24.78
DWR 39
1985
2.96 ± 0.60
2.32 ± 0.29
9.12
32.43
CPAN 1796
1985
3.38 ± 0.38
2.53 ± 0.19
10.98
30.81
DWR 16
1985
3.40 ± 1.03
2.54 ± 0.51
9.82
34.59
ROHINI
1984
3.82 ± 0.41
2.74 ± 0.20
12.97
29.46
GW 120
1985
3.91 ± 0.35
2.79 ± 0.17
10.33
37.80
GW 2 (d)
1985
4.20 ± 0.84
2.93 ± 0.41
10.56
39.80
GW 89
1984
4.35 ± 0.98
3.00 ± 0.48
9.10
47.74
BW 11
1987
4.53 ± 0.70
3.09 ± 0.34
10.11
44.83
1991–2000
HD 4672
2000
3.17 ± 0.85
2.43 ± 0.42
9.33
33.98
HD 2687
1999
4.02 ± 0.71
2.84 ± 0.35
10.71
37.53
DT 46
1995
4.08 ± 0.62
2.87 ± 0.30
9.77
41.72
DWR 195
1995
4.20 ± 1.08
2.93 ± 0.53
10.64
39.51
PBW 396
2000
4.30 ± 1.16
2.98 ± 0.57
12.00
35.86
PBW 373
1997
4.67 ± 0.68
3.16 ± 0.33
14.30
32.67
AKW 1071
1995
4.73 ± 0.83
3.19 ± 0.41
10.20
46.35
DL 784–3
1993
4.81 ± 0.92
3.23 ± 0.45
9.67
49.77
HI 1454
2000
5.96 ± 0.67
3.79 ± 0.33
11.60
51.38
HI 1418
2000
6.11 ± 0.60
3.87 ± 0.29
11.60
52.77
2001–2010
HPW 251
2008
4.32 ± 1.25
2.98 ± 0.61
15.40
27.97
HI 8627
2007
4.32 ± 0.33
2.99 ± 0.16
11.80
36.59
VL 907
2010
4.53 ± 0.27
3.09 ± 0.13
11.80
38.39
WH 711
2002
5.27 ± 1.11
3.45 ± 0.54
12.90
40.82
CBW 38
2009
5.37 ± 0.40
3.50 ± 0.20
11.40
47.07
GW 322
2002
5.52 ± 1.37
3.58 ± 0.67
10.80
51.12
PBW 509
2005
5.52 ± 1.59
3.58 ± 0.78
13.10
42.15
MACS 6145
2005
5.71 ± 0.87
3.67 ± 0.42
11.00
51.87
HI 1531
2006
5.78 ± 0.35
3.70 ± 0.17
10.10
57.19
VL 804
2002
5.95 ± 0.36
3.79 ± 0.17
13.40
44.37
HW 2045
2002
6.43 ± 1.09
4.24 ± 0.68
12.40
51.95
HS 420
2003
6.98 ± 0.63
4.29 ± 0.31
12.00
58.17
2011–2020
DBW 222
2020
4.22 ± 0.29
2.94 ± 0.14
12.40
34.02
WB 2
2017
4.42 ± 0.25
3.04 ± 0.12
14.88
29.68
DBW 187
2019
4.54 ± 0.33
3.10 ± 0.16
14.32
31.73
UAS 466
2015
4.69 ± 0.27
3.17 ± 0.13
12.10
38.72
PBW 343
2017
4.81 ± 0.33
3.23 ± 0.16
13.10
36.74
HD 3086
2014
4.91 ± 0.64
3.28 ± 0.31
13.92
35.29
HD 2987
2011
5.21 ± 0.25
3.42 ± 0.12
10.60
49.15
HD 3059
2013
5.39 ± 0.78
3.51 ± 0.38
14.79
36.47
DDW 47 (d)
2020
5.51 ± 0.33
3.57 ± 0.16
11.60
47.47
DBW 110
2015
5.66 ± 1.03
3.65 ± 0.51
11.60
48.82
DBW 303
2021
5.66 ± 0.96
3.65 ± 0.47
12.64
44.80
HD 2985
2011
5.82 ± 0.46
3.72 ± 0.22
13.60
42.78
MP 3336
2013
5.90 ± 0.49
3.76 ± 0.24
13.94
42.36
AKAW 4627
2012
6.94 ± 1.75
4.27 ± 0.86
12.00
57.83
2.3 Extraction of gliadin
Gliadins were extracted from whole wheat flours (WWF) which were obtained using a Cyclotec mill (FOSS) with a 0.5 mm screen. Hundred mg of WWF was mixed with 1.0 mL of 60 % alcohol and homogenized in a water bath for 30 min at 35 ± 2 °C followed by centrifugation at 3000 g for 15 min (Narwal et al., 2020). The supernatant obtained was used for measurement of gliadin content as well as antigenicity studies. To ensure robustness, two biological replicates with two technical replicates were performed for each experiment.
2.4 Determination of gliadin content
Gliadins were quantified by using the Bradford assay method (1976) as modified by Rekowski et al. (2021) and standardized using a Gen5 BioTek Absorbance Microplate Reader (Biotek, USA) on a 96-well microplate. Standard gliadin obtained from Sigma-Aldrich was dissolved in a solution consisting of 60 % alcohol and 10 % acetic acid (@1 µg/µL), with mild heating and constant shaking. The assay was conducted using a total reaction mixture volume of 300 µL containing 5 µL of diluted standard or sample, 95 µL of double-distilled water, and 200 µL of Bradford reagent. The reaction mixture was incubated at room temperature for 11 min, and then the absorbance was recorded at 595 nm. Standard curves were prepared using both bovine serum albumin (BSA) and gliadin as calibrant and the concentration was expressed as g gliadin 100 g−1 WWF.
2.5 Determination of total protein
The protein content of the samples was measured using near-infrared (NIR) instrument (Foss Infratech® 1241 Grain Analyzer, Denmark) and expressed at 12 % moisture basis.
2.6 Estimation of antigenicity using polyclonal (pAb) and monoclonal antibody (mAb)
For estimation of antigenicity, indirect ELISA coupled with microplate assay was employed following a standardized protocol (Gregorini et al., 2009). The pAb [Sigma-Aldrich, G9144; Anti-Gliadin, polyclonal (Wheat) antibody] raised against native and heat-treated wheat gliadin in rabbit while mAb (Thermo Fischer Scientific, HYB-314–01-02; gliadin monoclonal antibody, IgG) raised against gliadin antigen having immunogen synthetic peptide corresponding to residues K(58)LQPFPQPELPYPQPQ(73) of gliadin peptide produced in mouse, were employed in this study. While pAb has specificity to native wheat gliadin, mAb reacts specifically with the deamidated peptide. The experiments were performed in duplicate and repeated twice for accurate estimation. Separate calibration curves were prepared using standard gliadin for pAb as well as mAb to quantitate antigenicity. The dilutions of the antigen, primary antibodies, and secondary antibody (In vitrogen; Pierce Goat Anti-Mouse IgG (H + L), HRP; 31430; peroxidase conjugated, 1:10000) were optimized using the standard checkerboard method. The pAb was 1000 times diluted while for mAb, the dilution was 1500 times. The horse radish peroxidase (HRP)-labelled secondary antibody was used at 7500 times dilution for both the experiments. The data were calculated as the total antigenic gliadins in g 100 g−1 WWF (%).
3 Results
3.1 Comparative analysis of gliadin quantification using bovine serum albumin (BSA) and gliadin as calibrants
The gliadin content and antigenicity of 62 wheat varieties released during 1961–2020 were assessed. Gliadin is a component of wheat gluten known to be implicated in CD. The variation in gliadin content was determined using BSA and gliadin as calibrants (Fig. 1). Table 1 presents the detailed data on the average total gliadin content, total protein content, and the ratio of gliadin to total protein content. The total gliadin content (measured by using gliadin as standard) varied from 2.75 (PBW 34) to 6.98 (HS 420) g 100 g−1 WWF. Protein content ranged from 9.10 (GW 89) to 15.40 (HPW 251) g 100 g−1 and gliadin to total protein ratio ranged from 24.8 % (PBW 34) to 58.2 % (HS 420) (Table 1). To compare the quantification of gliadin using different standards, the gliadin content was also determined using BSA as a standard which ranged from 2.22 to 4.29 g 100 g−1 WWF (Table 1). Though there was highly significant positive correlation (r = 0.99) between gliadin content measured by both BSA and gliadin as calibrant, the absolute values were different. Gliadin content measured using the standard gliadin calibrant was 1.5 times higher than using BSA as standard. Similar variations were observed in gliadin content of old and new cultivars indicating no correlation between the cultivar release year and the gliadin content.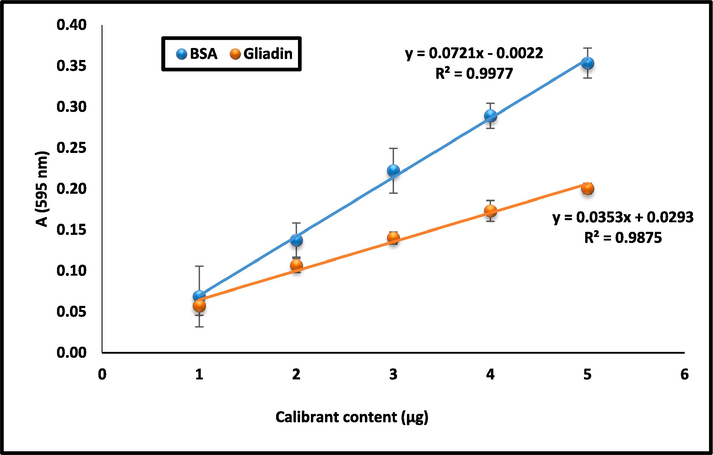
Standard curves using gliadin and BSA as calibrant.
3.2 Determination of total antigenicity employing polyclonal antibody (pAb)
To assess antigenicity of celiac toxic epitopes, gliadins extracted from all 62 wheat varieties were analysed for total antigenicity using pAbs (Fig. 2). Among the varieties, AKAW 4627 (2011–20) exhibited the highest antigenicity (0.067 g 100 g−1 WWF), while Rohini (1981–90) recorded the lowest one (0.016 g 100 g−1 WWF) (Fig. 2). Furthermore, the antigenic/total gliadin ratio ranged from 0.0042 (Rohini) to 0.0119 (HD 4672) (Fig. 2). Overall averages for total antigenicity, total gliadin, and ratio of antigenic vs. total gliadin for the varieties taken under investigation were 0.044 (%), 4.93 (%) and 0.009, respectively. There was a significant positive correlation (r = 0.763**) between total antigenic gliadin (determined via ELISA-based assay) and total gliadin (measured using the Bradford assay) (Fig. 3). Strong positive correlation between total gliadin content and CD antigenicity indicated that CD toxicity depends on gliadin content and not on variety or the release year of the variety.
Total antigenicity and its ratio to total gliadin using polyclonal antibody: For decades 1961–2000 (2a); for decades 2001–2020 (2b).
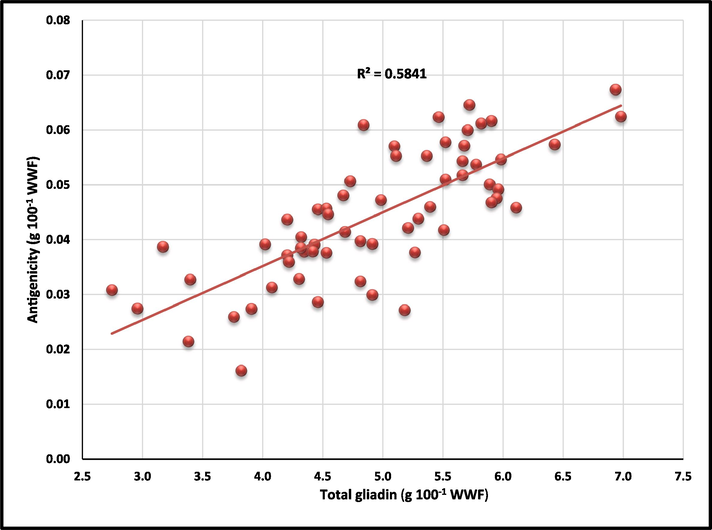
Correlation between antigenicity to total gliadin content using polyclonal antibody (Varieties: 62; period: 1961 to 2020).
3.3 Determination of total antigenicity utilizing monoclonal antibody (mAb)
The celiac antigenicity also screened and quantified using more specific mAbs in the gliadin extracts of a subset of 25 wheat varieties (Fig. 4). Among the varieties under investigation, MACS 6145 (2005) exhibited the highest % antigenicity (0.092), while PBW 34 (1985) recorded the lowest one (0.036). The antigenic/total gliadin ratio ranged from 0.0083 (WB 2) to 0.0143 (DBW 222). Overall averages for total antigenicity, total gliadin, and ratio of antigenic vs. total gliadin were 0.054 (%), 4.78 (%) and 0.0113, respectively. A significant positive relationship (r2 = 0.4923; r = 0.728**) was observed between total antigenic gliadin and total gliadin present (Fig. 5). In the same subset, the correlation between total gliadin vs. pAb-mediated total antigenicity was also highly significant (r = 0.843**). In addition, the correlation between mAb- and pAb-mediated antigenicity was found statistically significant (r = 0.686**).
Total antigenicity and its ratio to total gliadin using monoclonal antibody (Varieties: 25; period: 1981 to 2020).

Correlation between antigenicity to total gliadin using monoclonal antibody (Varieties: 25; period: 1981 to 2020).
4 Discussion
Wheat the second most important cereal crop, consumed widely in developed and developing countries. For developing world, it acts as protein and energy source (Govindan et al., 2023). It is a staple crop that contains approximately 10–15 % grain protein content, along with significant amount of carbohydrates, dietary fiber, and micronutrients (Shewry and Tatham, 2016). Dough viscoelasticity and extensibility necessary for an array of processed products (bread, pasta, biscuit etc.) and their quality, are attributable to wheat seed storage proteins (gliadins and glutenins) (Shewry and Hey, 2015; Sissons, 2008) which are stockpiled is seed endosperm clubbed with starch (Sharma et al., 2020). In the present study, the gliadin content (measured using gliadin as calibrant) in wheat varieties ranged from 24.8 % to 58.2 %. Some of the previous reports showed gliadin concentrations in the range of 30–40 % as a proportion of total proteins in wheat grains (Malik, 2009; Urade et al., 2018). Other mentioned albumin-cum-globulin, gliadin and glutenin contents in the range of 10.7–44.0 %, 18.6–34.3 %, and 27.4–43.9 % respectively for different wheat varieties (Mohan Kumar et al., 2017; Siddiqi et al., 2016; Siddiqi et al., 2021; Žilić et al., 2011). This shows that the content of gliadin and other protein fractions can vary depending on the variety as well as environmental factors.
Two methods of gliadin measurement, using bovine serum albumin (BSA) and gliadin as calibrant, were compared. The data showed that gliadin content measured using the standard gliadin calibrant was 1.5 times higher than using BSA as standard. However, in one of the recent study, Rekowski et al. (2021) reported a conversion factor of 4.25 (gliadin concentration estimated using BSA calibrant was 4.25 times lower than as with gliadin calibrant) by comparing wheat gliadin content using BSA and gliadins (extracted from wheat flour; cultivar Akteur) as calibrants. In our study, there was very high significant positive correlation (r = 0.99) between gliadin content measured by both the calibrants using 62 diverse Indian wheat varieties, indicating high reliability of using BSA as standard by employing a factor of 1.5.
Though gliadin being the component of gluten important for dough making properties, it has been found accountable for developing certain intolerances to some people including CD. Celiac disease (CD) is an autoimmune disorder that primarily affects genetically predisposed individuals upon consumption of a gluten-containing diet (Kumar et al., 2024). Celiac occurs in individuals with specific genetic backgrounds, particularly those carrying the HLA-DQ2 and DQ8 genes, who exhibit intolerance to the gluten proteins found in wheat, particularly highly immunogenic α-gliadins (Caio et al., 2019; Sharma et al., 2020). For CD, serological testing can be accomplished using anti-gliadin or anti-deaminated gliadin antibodies, anti-tissue transglutaminase-2 antibodies and anti-endomysium antibodies (Al-Toma et al., 2019; Sharma et al., 2020; Tye-Din et al., 2018). In the current study, antibodies raised against native gliadins and/or heat-treated gliadins have been employed for calculating antigenicity. There was strong positive correlation (r = 0.76) between total antigenic gliadin and total gliadin content, using pAb. Poirier et al. (2021) also used pAbs to discriminate wheat, barley, and oat prolamins in an indirect ELISA assessment. Schopf and Scherf (2018) compared different ELISA kits and found that the pAb ELISA was less affected by gluten variability and was able to detect gluten from einkorn wheat too. In addition, mAbs have been employed by various researchers to demonstrate the CD mediated antigenicity in wheat protein fractions (Gregorini et al., 2009; Narwal et al., 2020; Ribeiro et al., 2016; Spaenij-Dekking et al., 2005). In this study, mAb destined against the α-gliadin peptides p58-73 (KLQPFPQPELPYPQPQ) containing a core region reported to cause CD toxicity was employed for screening antigenicity. A significant positive correlation (r2 = 0.4923; r = 0.728**) was also found between total antigenic gliadin and total gliadin using mAb showing a strong correlation between antigenicity and gliadin content. However, there are few exceptions having higher gliadin content and lower antigenicity. It can be explained by the fact that antigenic peptides are not uniformly distributed among all wheat genetic resources as stated by Schalk et al. (2017) and Garcia-Calvo et al. (2021).
Conflicting results have been reported for old and modern bread varieties regarding their antigenic behaviour (Shewry, 2018). Van den Broeck et al. (2010) reported that ancient wheat varieties have a smaller number of CD antigenicity (gilaα9) compared to modern ones. While others reported that modern wheat varieties have fewer CD antigenicity as compared to ancient varieties (Colomba and Gregorini, 2012; Prandi et al., 2017). On the other hand, Narwal et al. (2020) observed varietal differences in antigenicity, but they did not find noteworthy changes in antibody reactivity for the wheat varieties released after 1960 in India. Malalgoda et al. (2018) reported that the cultivar release year and the number of immunogenic epitopes and α-gliadin have no relation with each other. According to Pronin et al. (2021), the immune-reactive potential of old and modern wheat cultivars is similar. In addition, Ribeiro et al. (2016) stated that breeding has no contribution towards the prevalence of CD antigenic epitopes. Our results are in conformity with Malalgoda et al. (2018), Narwal et al. (2020) and Pronin et al. (2021) in that year of release has no relation to antigenicity.
5 Conclusion
In conclusion, the study reveals significant variations in gliadin content among the wheat varieties tested, emphasizing their potential implications for CD. A positive correlation was observed between total antigenic gliadin and total gliadin content using pAb (r2 = 0.5841; r = 0.763**) and mAb (r2 = 0.4923; r = 0.728**) indicating that total gliadin content is the major factor for eliciting celiac antigenicity.
CRediT authorship contribution statement
Sunil Kumar: Writing – review & editing, Writing – original draft, Supervision, Project administration, Methodology, Investigation, Formal analysis, Data curation, Conceptualization. Ankush: Methodology, Investigation. Sewa Ram: Writing – review & editing, Writing – original draft, Supervision, Project administration, Funding acquisition, Formal analysis. Arun Gupta: Visualization, Resources. Om P Gupta: Writing – review & editing. Vanita Pandey: Writing – review & editing. Anuj Kumar: Writing – review & editing. Gyanendra Singh: Supervision, Project administration.
Acknowledgement
The authors are thankful to the Indian Council of Agricultural Research and Indian Institute of Wheat and Barley Research for providing the necessary infrastructure and resources for conducting the research. This research was funded by ICAR-Indian Institute of Wheat & Barley Research under institutional project (IXX15473) and Consortium Research Project on Bio-fortification (1006422) funded by Indian Council of Agricultural Research.
Declaration of competing interest
The authors declare that they have no known competing financial interests or personal relationships that could have appeared to influence the work reported in this paper.
References
- European Society for the Study of Celiac Disease (ESsCD) guideline for celiac disease and other gluten-related disorders. United European Gastroenterol J. 2019;7(5):583-613.
- [Google Scholar]
- Properties of gluten intolerance: gluten structure, evolution, pathogenicity and detoxification capabilities. Nutrients. 2016;8(10):644.
- [Google Scholar]
- Gluten-related disorders: Celiac disease, wheat allergy, and nonceliac gluten sensitivity. Crit. Rev. Food Sci. Nutr.. 2020;60(15):2606-2621.
- [Google Scholar]
- Are ancient durum wheats less toxic to celiac patients? A study of alpha-gliadin from Graziella Ra and Kamut. The Scientific World J.. 2012;8:837416
- [Google Scholar]
- From polyclonal sera to recombinant antibodies: A review of immunological detection of gluten in foodstuff. Foods. 2021;10(1):66.
- [CrossRef] [Google Scholar]
- Govindan, V., Gupta, O.P., Kumar, S., Mishra, C.N., Singh, G., 2023. Wheat nutraceutomics: Breeding, genomics, biotechnology, and nanotechnology, in Kole, C. (Ed.), Compendium of Crop Genome Designing for Nutraceuticals. Springer, Singapore, pp. 23, 10.1007/978-981-19-3627-2_2-1.
- Immunogenicity characterization of two ancient wheat α-gliadin peptides related to celiac disease. Nutrients. 2009;1:276-290.
- [Google Scholar]
- Kumar, S., Singh, A., Singh, A.P., Ram, S., Gupta, O.P., Pandey, V., Khan, H., Soni, R., Singh, G.P., 2024. Gluten-Related Disorders: Current Understanding, Myths, and Facts, in Gupta, OP., Kumar, S., Pandey, A., Khan, M.K., Singh, S.K., Singh, G.P. (Eds.), Wheat Science. CRC Press, US, pp. 321-338. 10.1201/9781003307938.
- Detection and quantitation of immunogenic epitopes related to disease in historical and modern hard red spring wheat cultivars. Food Chem.. 2018;264:101-107.
- [Google Scholar]
- Malik, A.H., 2009. Nutrient uptake, transport and translocation in cereals: influences of environmental and farming conditions. No. 2009: 1 pp. 11. ISSN 1654-3580.
- A comprehensive review of celiac disease/gluten-sensitive enteropathies. Expert Rev. Clin. Immunol.. 2019;57:226-243.
- [Google Scholar]
- Immunogenicity characterization of hexaploid and tetraploid wheat varieties related to celiac disease and wheat allergy. Food Agric. Immunol.. 2017;28(5):888-903.
- [Google Scholar]
- Exploring Indian wheat genotypes for less celiac disease toxic epitopes. J. Cereal Res.. 2020;12(1):79-82.
- [Google Scholar]
- Diversification of the celiac disease α-gliadin complex in wheat: a 33-mer peptide with six overlapping epitopes, evolved following polyploidization. Plant J.. 2015;82(5):794-805.
- [Google Scholar]
- Evaluation of the discriminatory potential of antibodies created from synthetic peptides derived from wheat, barley, rye and oat gluten. PLOS One. 2021;16(9):e0257466.
- [Google Scholar]
- Peptides from gluten digestion: A comparison between old and modern wheat varieties. Food Res. Int.. 2017;91:92-102.
- [Google Scholar]
- Old and modern wheat (Triticum aestivum L.) cultivars and their potential to elicit celiac disease. Food Chem.. 2021;339:127952
- [Google Scholar]
- Current guidelines for the management of celiac disease: A systematic review with comparative analysis. World. J Gastroenterology.. 2022;28:154-175.
- [Google Scholar]
- Ramadas, S., Kumar, K.T.M., Singh, G.P., 2019. Wheat production in India: Trends and prospects, in Shah, F., Khan, Z., Iqbal, A., Turan, M., Olgun, M. (Eds.), Recent Advances in Grain Crops Research. IntechOpen Limited, UK. 10.5772/intechopen.86341.
- Determination of soluble wheat protein fractions using the Bradford assay. Cereal Chem.. 2021;98(5):1059-1065.
- [Google Scholar]
- New insights into wheat toxicity: Breeding did not seem to contribute to a prevalence of potential celiac disease’s immunostimulatory epitopes. Food Chem.. 2016;213:8-18.
- [Google Scholar]
- Quantitation of the immunodominant 33-mer peptide from α-gliadin in wheat flours by liquid chromatography tandem mass spectrometry. Sci. Rep.. 2017;7(1):45092.
- [Google Scholar]
- Wheat cultivar and species influence variability of gluten ELISA analyses based on polyclonal and monoclonal antibodies R5 and G12. J. Cereal Sci.. 2018;83:32-41.
- [Google Scholar]
- Structural basis for gluten intolerance in celiac sprue. Sci.. 2002;297(5590):2275-2279.
- [Google Scholar]
- Pathogenesis of celiac disease and other gluten related disorders in wheat and strategies for mitigating them. Front. Nutr.. 2020;7:6.
- [Google Scholar]
- Do ancient types of wheat have health benefits compared with modern bread wheat? J. Cereal Sci.. 2018;79:469-476.
- [Google Scholar]
- The contribution of wheat to human diet and health. Food Energy Security. 2015;4(3):178-202.
- [Google Scholar]
- Improving wheat to remove coeliac epitopes but retain functionality. J. Cereal Sci.. 2016;67:12-21.
- [Google Scholar]
- Effect of short-term sourdough fermentation on wheat protein. Cogent Food Agric.. 2016;2(1):1132983.
- [Google Scholar]
- Electrophoretic characterization and proportion of different protein fractions in wheat cultivars of north India. J. Agric. Food Res.. 2021;4:100137
- [Google Scholar]
- Role of durum wheat composition on the quality of pasta and bread. Food. 2008;2(2):75-90.
- [Google Scholar]
- Natural variation in toxicity of wheat: Potential for selection of nontoxic varieties for celiac disease patients. Gastroenterology. 2005;129(3):797-806.
- [Google Scholar]
- Celiac disease: autoimmunity in response to food antigen. Semin. Immunol.. 2015;27(5):343-352.
- [Google Scholar]
- Celiac disease: a review of current concepts in pathogenesis, prevention, and novel therapies. Front. Pediatr.. 2018;6:350.
- [Google Scholar]
- Gliadins from wheat grain: An overview, from primary structure to nanostructures of aggregates. Biophys. Rev.. 2018;10:435-443.
- [Google Scholar]
- Presence of celiac disease epitopes in modern and old hexaploid wheat varieties: Wheat breeding may have contributed to increased prevalence of celiac disease. Theor. Appl. Genet.. 2010;121(8):1527-1539.
- [Google Scholar]
- Variation in mineral micronutrient concentrations in grain of wheat lines of diverse origin. J. Cereal Sci.. 2009;49(2):290-295.
- [Google Scholar]
- Characterization of proteins from grain of different bread and durum wheat genotypes. Int. J. Mol. Sci.. 2011;12(9):5878-5894.
- [Google Scholar]
Appendix A
Supplementary material
Supplementary data to this article can be found online at https://doi.org/10.1016/j.jksus.2024.103335.
Appendix A
Supplementary material
The following are the Supplementary data to this article:


