

Translate this page into:
Association between air pollutants particulate matter (PM2.5, PM10), nitrogen dioxide (NO2), sulfur dioxide (SO2), volatile organic compounds (VOCs), ground-level ozone (O3) and hypertension
⁎Corresponding author. smeo@ksu.edu.sa (Sultan Ayoub Meo), sultanmeo@hotmail.com (Sultan Ayoub Meo),
-
Received: ,
Accepted: ,
This article was originally published by Elsevier and was migrated to Scientific Scholar after the change of Publisher.
Abstract
Background
Air pollution causes numerous debilitating diseases and premature deaths. This study explores the relationship between air pollutants particulate matter (PM2.5, PM10), nitrogen dioxide (NO2), sulfur dioxide (SO2), volatile organic compounds (VOC), ground-level ozone (O3) and hypertension (HTN).
Methods
The air pollutants and hypertension data were recorded from the “Pub Med, Web of Science, Scopus, and Google Scholar.” We searched the data using the keywords on exposure (air pollutants) and outcome (hypertension). Primarily, 108 documents were selected, and after studying the summaries and complete articles, 28 studies were selected for analysis and discussion. The impact of air pollutants on hypertension was investigated through a compilation of 28 studies, from multiple countries, encompassing a total sample size of 2,540,441.
Results
Increased exposure to environmental pollutants PM2.5 (OR = 1.05; 95 % CI:1.02, 1.08; p < 0.01); PM10 (OR = 1.25; 95 % CI: 1.04, 1.49; p = 0.02); NO2 (OR = 1.12; 95 % CI: 1.01, 1.25; p = 0.04); SO2 (OR = 1.17; 95 % CI:1.04, 1.31; p = 0.02); and VOCs (OR = 2.45;95 % CI:1.36, 4,41; p = 0.01) were significantly associated with increased incidence of HTN. However, O3 exposure was positive but not significantly linked with an elevated risk of HTN (OR = 1.35; 95 % CI: 0.67, 2,72; p = 0.27).
Conclusions
Air pollutants PM2.5, PM10, NO2, SO2, and VOC positively and significantly enhanced the risk of hypertension. Environmental pollutants-reducing policies could be a dynamic planned approach to lessen cardiovascular risks in global populations. The strategies such as emission controls, promotion of clean energy sources, and transportation policies, that directly impact air pollution levels will have direct implications on cardiovascular health and decrease the overall occurrence of hypertension in the global population. Additionally, public health campaigns to promote cardiovascular health should incorporate education about the risk of air pollution exposure.
Keywords
Environmental Pollution
Air Pollution
Particulate Matter
PM2.5
PM10
NO2
SO2
VOC
Hypertension
Cardiovascular Diseases

1 Introduction
Environmental pollution creates chaos on the planet, spreads diseases, develops various human health hazards, and can contribute to premature deaths (Meo et al., 2021). Worldwide, about 99 % of the residents reside in regions where air pollution exceeds the required air quality guidelines levels. The major pollutants in the atmosphere are “particulate matter (PM), nitrogen dioxide (NO2), sulfur dioxide (SO2), ozone (O3), and carbon monoxide (CO)”, often emitted from motor vehicles, industrial processes, and the burning of fossil fuels. Environmental pollution poses risks to human health, affecting the respiratory, cardiovascular, nervous, and other body systems. Worldwide, air pollution caused premature deaths of 6.7 million people per annum (World Health Organization (WHO), 2024).
Worldwide about 1.28 billion people have hypertension. The majority of the people are from low-middle-income nations, and about 46 % of people with high blood pressure are not aware that they are suffering from this chronic condition (World Health Organization, 2024). The literature highlights the role of genetics and lifestyle on hypertension (Takase et al., 2024). However, recently emerging evidence has provided additional insight into the link between environmental pollution and hypertension. Air pollution is made up of an intricate combination of particulate matter, gases, and chemical compounds from both man-made and natural sources that have been found to harm human health (Niu et al., 2023).
The possible mechanisms through which air pollution might increase blood pressure have been proposed with a role for “oxidative stress, inflammation, Autonomic Nervous System (ANS), imbalance, and endothelial dysfunction” (Brook et al., 2010; Krittanawong et al., 2023). While there has been a substantial and rapidly expanding body of evidence regarding air pollution and hypertension. Air pollutant levels continue to rise, so any evidence involving air pollution to health outcomes like hypertension is imperative for strengthened air quality regulations and public health policies, especially for susceptible inhabitants, pregnant females, children, the aged population, and those already suffering from chronic health conditions. This study aimed to investigate the association between “air pollutants particulate matter (PM2.5, PM10), nitrogen dioxide (NO2), sulfur dioxide (SO2), volatile organic compounds (VOC), ground-level ozone (O3)” and hypertension”.
2 Materials and Methods
This study was conducted in the “Department of Physiology, College of Medicine, King Saud University, Riyadh, Saudi Arabia.”.
2.1 Search Strategy
The PRISMA's “Preferred Reporting Items for Systematic Reviews and Meta-Analyses” protocol was used to select our study's documents. “PubMed, Web of Science, Scopus, and Google Scholar” were used to find literature exploring the relationship between the risk of hypertension and exposure to environmental pollutants. For the exposure, the keywords used were “air pollutants, particulate matter, PM2.5, PM10, nitrogen dioxide (NO2), carbon monoxide (CO), ozone (O3), sulfur dioxide (SO2) and volatile organic compounds (VOC)”. For outcome, key terms used were hypertension, high blood pressure (BP), and hypertensive diseases. A total of 108 articles were identified initially. After that, screening and applying the eligibility criteria, 38 studies were finally chosen for the analysis and to support the discussion (Fig. 1).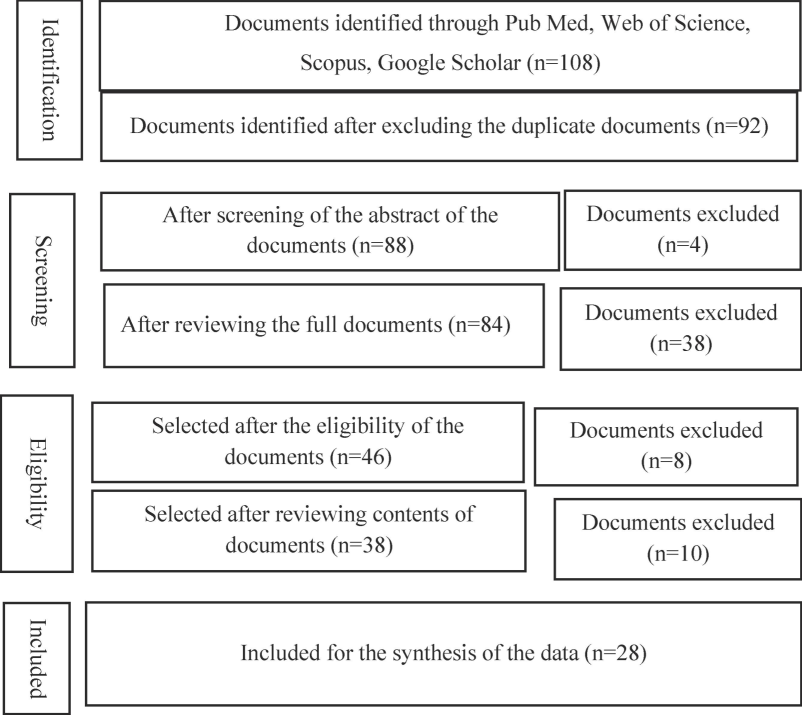
PRISMA Flow Diagram for the selection of documents.
2.2 Inclusion and exclusion criteria
The selection criteria for the studies were set as follows: The studies investigating exposure to air pollutants “PM2.5, PM10, NO2, SO2, O3, CO, VOC” and the risk of hypertension; Effect size measured was OR/RR; article language was in English; original studies. The exclusion criteria were established as follows: Air pollutants such as airborne metals; literature such as letters, editorials, review articles, conference abstracts, or systematic reviews; and studies for which full articles could not be found.
2.3 Data analysis
The analyses were performed using “RStudio version 4.3.2 and package ‘meta.’ Odds Ratio (OR) with 95 % confidence intervals (CIs)” were obtained from encompassed studies and pooled to evaluate the association concerning air pollutants and the risk of hypertension. The most adjusted model was used if multiple ORs were given within the same study. Different study designs were not mixed, and documents with the most repeated study design (cross-sectional) were used in the final analysis. The analysis was done for the pollutants with three or more studies, and a random effect model was used.
The inclusive outcome was found to be significant at p-value < 0.05. The pooled studies evaluated heterogenicity using the Cochrane chi-square test (Q) and I2. “Moderate to a high degree of heterogenicity was indicated when the p-value of the chi-square test was < 0.05 and the I2 value was ≥ 50 %” (5). RStudio version 4.3.2 was used to evaluate the existence of publication bias using Egger’s regression test and funnel plot, and sensitivity analysis was performed to evaluate the reliability of the analysis.
3 Results
In this study, 28 studies were selected that explored the link between different air pollutants and the risk of hypertension. These studies spanned multiple countries. A total of 2,540,441 individuals were included in these studies, of which 56 % of the demographic was women, and the remaining 44 % were men. In all the studies, the definition of hypertension was included in the required diagnostic criteria. The summary table for all the studies is present in the respective pollutant section, and it includes the author’s name, year of publication, sample characteristics (sample size, mean age, and number of men and women), and primary outcome (Table 1).
Author, Year of Study, Country
Study Type
Sample Size
Pollutants
Outcomes
Li J et al., 2022, China (Li et al., 2022)
Cross-sectional Study
Total: 37,610, Female: 18762, Male: 18848
7–18 years, mean age: 11 ysPM2.5
High PM2.5 19.6 μg/m3 was significantly related to HTN where average exposure was 61.3 μg/m3 OR 1.56 (95 % CI: 1.08, 2.25).
Song et al., 2021, China (Song et al., 2021)
Cross-sectional Study
Total: 883827, Female: 533832, Male 349995Mean age: 55.5
PM2.5
PM2.5, 10 μg/m3 increase in 1-year exposure linked with increased hypertension with average exposure was 49.2 μg/m3 OR 1.04 (95 % CI, 1.02 to 1.05).
Arku et al., 2020, 21 countries (Arku et al., 2020)
Cross-sectional Study
Total: 137809, Feamle: 79929, Male: 57880Mean age 50.6
PM2.5
OR 1.04 (95 % CI: 1.01, 1.07). PM2.5 was related to increased odds of HTN per 10 μg/m3 rise in PM2.5
Yang et al., 2019a, China (Yang et al., 2019)
Cross-sectional Study
Total: 24,845, Female: 12184, Male:12661Mean age 45.6
PM2.5
PM2.5 exposure was linked with higher odds of hypertension. OR 1.03, 95 % CI (1.00, 1.07). A 10-μg/m3.
Lin H et al., 2017, China (Lin et al., 2017)
Cross-sectional study
Total: 12,665, Female: 6770; Male: 5895Mean age: 63
PM2.5
Each 10 μg/m3 increase in PM2.5 exposure was correlated with high hypertension OR: 1.14 (95 % CI: 1.07, 1.22).
Yang et al, 2019b, China (Yang et al., 2019)
Cross-sectional Study
Total:15477, Female:7321; Male:8156; Mean age 45 ys
PM2.5
OR 1.07, 95 % CI (1.02–1.13), PM2.5 was linked with hypertension per 10-μg/m3 increase with a mean concentration of 82.0 μg/m3.
PM10
PM10 was associated with hypertension, with a mean level of 123 μg/m3. OR 1.09, 95 % CI (1.05–1.12).
NO2
NO2 was linked to hypertension, with a mean level of 35.3 μg/m3 OR 1.19, 95 % CI (1.10–1.29).
SO2
The mean levels of SO2 54.4 μg/m3 were related to hypertension, OR 1.05, 95 % CI (1.00–1.10).
O3
O3 mean concentration of 49.4 μg/m3 established a link with hypertension OR 1.05, 95 % CI (1.00–1.12.
Honda et al. 2018, USA (Honda et al., 2018)
Cross-sectional Study
Total: 4,121; Female: 2212; Male: 1909Mean age: 70
PM2.5
3.91 µg/m3 one-year exposure to PM2.5 was linked with hypertension. OR 1.24, 95 % CI: (1.11, 1.38).
Li H et al., 2023, China (Li et al., 2023)
Cross-sectional study
Total: 165075
Female: 79889
Male: 85186PM2.5
PM2.5 was allied to an elevated risk of hypertension prevalence. OR = 1.081, 95 % CI: 1.034–1.129.
Zhang B et al., 2023, USA (Zhang et al., 2023)
Cross-sectional Study
Total: 27857; Female: 15747; Male:12110Mean age 61 ys
PM2.5
No link between long-term PM2.5 exposure per 10.9 to 14.9 μg/m3 with hypertension. OR 0.99, 95 % CI (0.92,1.07.
Xu et al., 2021, China (Xu et al., 2021)
Cross-sectional
Total: 31462; Female: 16224; Male: 15238Mean age: 55 ys
PM2.5
Long-term PM2.5 was significantly allied with an increasing risk of hypertension. OR 1.08; 95 % CI, 1.04–1.12;
Babisch et al., 2014, Germany (Babisch et al., 2014)
Cross-sectional study
Total: 4166; Female: 2120; Male: 2046Mean age: 49.2
PM2.5
OR 1.08 (95 % CI: 0.99, 1.17). There was a relationship between PM2.5 and hypertension.
Chan et al., 2008 Taiwan (Chan et al., 2024)
Cross-sectional
Total: 18,867
PM10
OR: 1.10, (1.06–1.15), There was a significant association of PM10 on hypertension with concentration ranging from 47.7-84.0 μg/m3.
NO2
OR: 1.16, (1.08–1.25). There was a significant association of NO2 with hypertension with the concentration ranging from 4.5-27.4 ppb.
SO2
OR:1.21, (1.12–1.29). There was a significant association of SO2 with hypertension, with concentration ranging from 2.3-12.7 ppb.
Chen et al., 2015, Taiwan (Chen et al., 2015)
Cross-sectional Study
Total: 27,752; Female: 13338; Male:14414Mean age 74.8 ys
PM2.5
OR 0.991, 95 % CI (0.959, 1.023), No association between one-year exposure to air pollution and HTN.
PM10
OR 1.000, 95 % CI (0.939, 1.066), No association was found between hypertension and 1-year exposures to air pollution.
NO2
OR 0.999, 955 CI (0.956, 1.043). No relationship was found between one year of exposure to air pollution and HTN.
Dong et al., 2013, China
(Dong et al., 2013)Cross-sectional Study
Total: 24845; Female: 12184; Male: 12661 Mean age 45.59 ys
PM10
OR 1.12 (95 % CI, 1.08–1.16), Per 19 μg/m3 High PM10 increased odds of hypertension.
SO2
OR 1.11 (95 % CI, 1.04–1.18). Per 20 μg/m3 rise in SO2, there was increased odds of hypertension
O3
OR 1.13 (95 % CI, 1.06–1.20). 22 μg/m3 increase in O3, there was increased odds of hypertension
Johnson et al., 2009, USA (Johnson and Parker, 2009)
Cross-sectional Study
Total: 134,224.
Men:57864.Women: 76380; age: 30PM2.5
OR 1.05, 95 % CI (1.00–1.10), A 10 μg/m3 rise in PM2.5 was linked with an elevated risk of HTN.
Sørensen et al., 2012, Denmark (Sørensen et al., 2012)
Cross-sectional Study
Total: 44,436
Men: 21344
Women: 23029Median age: 55.9NO2
OR 0.97, 95 % CI (0.87–1.08). No clear associations were found between NO2 > 19.6 (µg/m3) and risk for hypertension.
Fuks et al., 2016, Germany (Fuks et al., 2016)
Cross-sectional Study
Total: 4359; Female: 2179; Male:2180Mean age: 59.5
PM2.5
OR 0.99, 95 % CI (0.94, 1.03), There was no association found between PM2.5 and hypertension.
Zeng et al., 2017, China (Zeng et al., 2017)
Cross-sectional Study
Total: 9354
Male: 4583
Female: 4771Mean age: 11.4PM10
Positive but not significantly linked with an increase in PM10 and an increase in blood pressure. OR 2.17 (95 % CI, 1.61, 2.93).
NO2
OR 1.26 95 % CI (0.92-). A positive and significant association between an increase in NO2 5-day mean exposure and an increase in blood pressure.
O3
OR 2.77 95 % CI (1.94, 3.95); Positive but not significant association between an increase in O3 5-day mean exposure and increase in blood pressure
SO2
OR 1.21 95 % CI (0.93–1.56). Positive but not significant association between an increase in SO2 5-day mean exposure & increase in blood pressure
Dong et al., 2014, China
(Dong et al., 2014)Cross-sectional study
Total: 9354; Female: 4583; Male: 4771Mean age 10.9 ys
PM10
OR = 1.68; 95 % CI: 1.53–1.86
A significant relationship between M10 and the prevalence of hypertension
NO2
(OR = 1.33; 95 % CI: 1.22–1.44). Significant link between prevalence of NO2 and hypertension
SO2
(OR = 1.33; 95 % CI: 1.21–1.47). A significant link between SO2 and hypertension
O3
(OR = 1.12; 95 %CI:1.10–1.13). Significant link between the prevalence of O3 & HTN
Zhang Z et al., 2019, China (Zhang et al., 2019)
Cross-sectional
Total: 43745; Men: 22037
Women: 21708.Mean age: 11.3 ysPM2.5
OR 1.31, 95 % CI (0.86,1.98). No significant relationship between PM2.5 and hypertension.
PM10
OR 1.45, 95 % CI (1.07,1.95). PM10 was associated with a high occurrence of hypertension
Hassanvand et al., 2018, Iran (Hassanvand et al., 2018)
Cross-sectional study
Total: 2847; Men: 1181
Women: 1666.Mena age: 52 ysPM10
PM10 was related to the occurrence of hypertension, OR 1.55, 95 % CI (1.21,1.99).
Lee et al., 2016, South Korea (Lee et al., 2016)
Cross-sectional study
Total: 680,202
PM10
OR 1.042 (95 % CI: 1.009, 1.077). PM10 exposure 10 μg/m3 was linked to hypertension
NO2
OR 1.077 (95 % CI: 1.044, 1.112). NO2 exposure (10 ppb) was associated with hypertension
Yang et al., 2019c, China (Yang et al., 2019)
Cross-sectional
Total: 194104; Men:102785
Women: 91319.Mean age 10.2 ysPM2.5
A significant association was found between PM2.5 and hypertension. OR 1.03, 95 % CI (1.02–1.05).
PM10
OR 1.03, 95 % CI (1.02–1.04). Positive significant associations between PM10 and high blood pressure
Chang et al., 2009a, Taiwan (Chang et al., 2009)
Cross-sectional study
Total: 59
Men:47
Women: 12Mean age: 39VOCs
OR 7.0, 95 % CI (1.0–48.4), organic solvents and toluene mixture were associated with high HTN although it was not significant.
Mohammadi et al., 2012, Iran (Mohammadi et al., 2012)
cross-sectional study
Total: 433
Female: 433Mena age: 31.72VOCs
High exposure: aOR:3.00, 95 % CI: 1.30–6.91, significantly increased the risk for hypertension.
Chang et al., 2020b, Taiwan (Chang et al., 2020)
cross-sectional study
Total: 155
Men: 105
Women: 50Mean age 27.6VOCs
(OR = 1.25; 95 % CI: 0.39–3.98;). Subjects co-exposed to ethanol, cyclohexanone and toluene ≥ 2500 ppb had an increased but not significant risk of HTN.
Attarchi et al., 2013, Iran (Attarchi et al., 2013)
Cross-sectional
Total: 101
All menMen age: 33.1VOCs
aOR:4.38, 95 % CI 1.27–10.53. Organic solvent exposure was significantly associated with hypertension in group 2.
Kotseva et al., 1998, Bulgaria (Kotseva and Popov, 1998)
Cross-sectional study
Total: 345 cases and 345 controls
VOCs
OR = 2.00; 95 % CI 1.11–3.61. Workers exposed to high concentrations of benzene and xylene (group 2) have a significantly increased prevalence of arterial hypertension
3.1 Particulate matter (PM2.5 µm) and hypertension
A total of 16 studies were found for PM2.5. The Cochrane chi-squared test (Q) and I2 statistic revealed a significant heterogeneity (Q = 49.77, p < 0.01, I2 = 70. Our forest plot (Fig. 2) showed a significantly elevated risk between increased exposure to PM 2.5 and incidence of HTN (OR = 1.05; 95 % CI: 1.02, 1.08; p < 0.01). Egger’s Regression Test shows no publication bias, though the funnel plot shows slight asymmetry.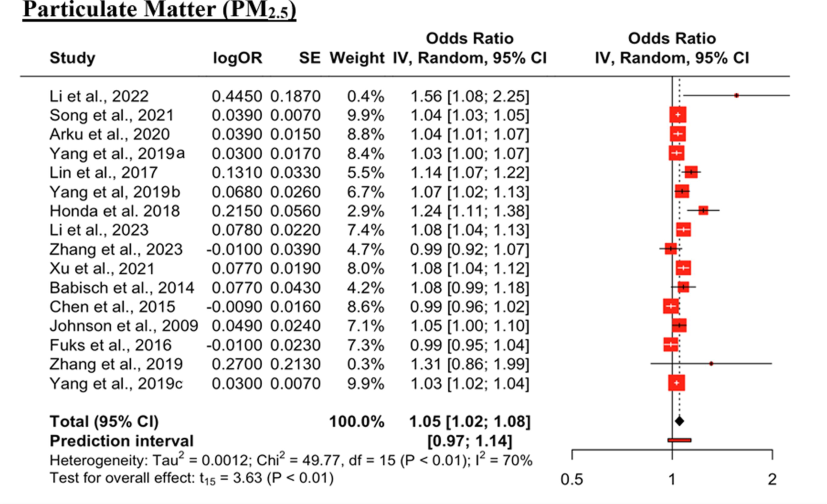
Effect of PM2.5 on hypertension. The black diamond represents the combined OR for all the studies. The red squares represent the individual OR for each study. The solid vertical line represents OR = 1. The dashed line represents the point estimate of the overall OR for all studies.
3.2 Particulate matter (PM10 µm) and hypertension
A total of 10 studies were found. The Cochrane chi-squared test (Q) and I2 showed significant heterogeneity (Q = 164, p < 0.01, I2 = 95 %). The forest plot analysis (Fig. 3) suggested that PM 10 was positively and significantly associated with an increased risk of HTN (OR = 1.25; 95 % CI: 1.04, 1.49; p = 0.02). Egger’s Regression and the funnel plot showed asymmetry indicating publication bias.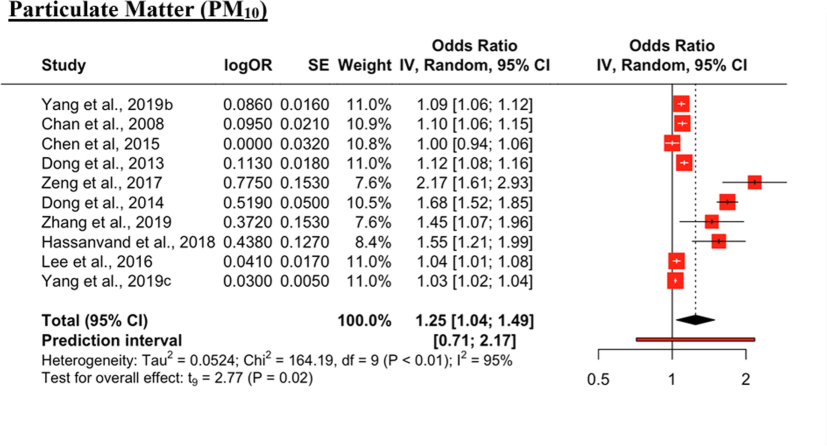
Forest Plot for PM10 impact on HTN. The black diamond represents the combined OR for all the studies. The red squares represent the individual OR for each study. The solid vertical line represents OR = 1. The dashed line represents the point estimate of the overall OR for all studies.
3.3 Nitrogen dioxide (NO2) and hypertension
A total of 7 studies were found. The Cochrane chi-squared test (Q) and I2 statistic revealed a significant heterogeneity (Q = 51, p < 0.01, I2 = 88 %). The forest plot (Fig. 4) analysis suggested that increased NO2 exposure was found to be a positive and significant risk factor for HTN (OR = 1.12; 95 % CI: 1.01, 1.25; p = 0.04). Egger’s Regression Test shows no publication bias, though the funnel plot shows slight asymmetry.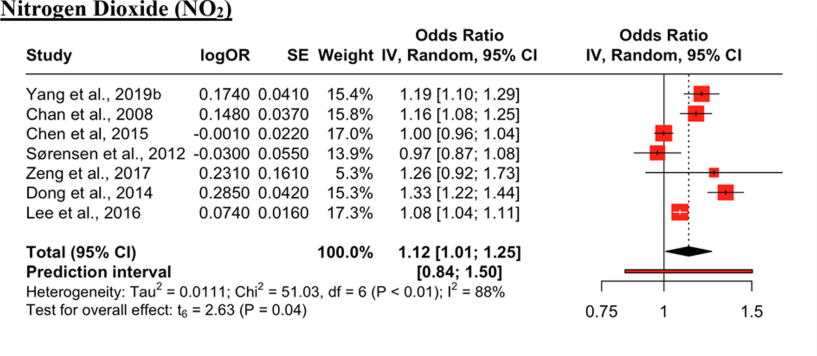
Forest Plot for impact of NO2 on HTN. The black diamond represents the combined OR for all the studies. The red squares represent the individual OR for each study. The solid vertical line represents OR = 1. The dashed line represents the point estimate of the overall OR for all studies.
3.4 Sulfur dioxide (SO2) and hypertension
A total of 5 studies were found. The Cochrane chi-squared test (Q) and I2 statistic revealed a significant heterogeneity (Q = 24, p < 0.01, I2 = 83 %). The forest plot (Fig. 5) analysis suggested that SO2 was significantly associated with an increased incidence of HTN (OR = 1.17; 95 % CI: 1.04, 1.31; p = 0.02). Egger’s Regression Test shows no publication bias, though the funnel plot shows slight asymmetry.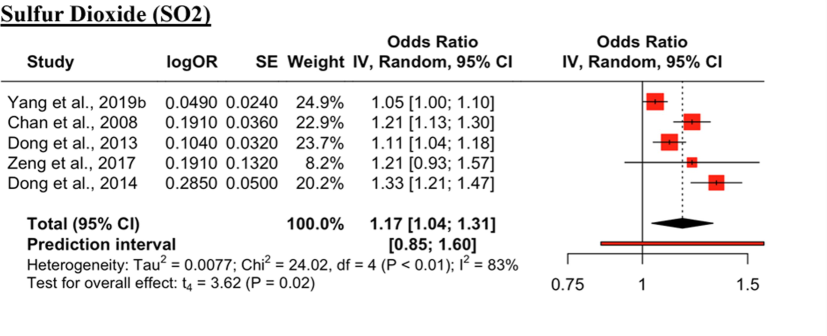
Forest Plot for SO2 Effect on Risk of HTN. The black diamond represents the combined OR for all the studies. The red squares represent the individual OR for each study. The solid vertical line represents OR = 1. The dashed line represents the point estimate of the overall OR for all studies.
3.5 Volatile organic compounds (VOC) and hypertension
A total of 5 studies were found for volatile organic compounds associated with HTN. The Cochrane chi-squared test (Q) and I2 statistic revealed a non-significant heterogeneity (Q = 4.25, p = 0.37, I2 = 6 %). The forest plot (Fig. 6) analysis suggested that high exposure to VOCs was positively and significantly related to increased HTN incidence (OR = 2.45; 95 % CI: 1.36, 4,41; p = 0.01). Egger’s Regression Test and funnel plot both indicate no publication bias.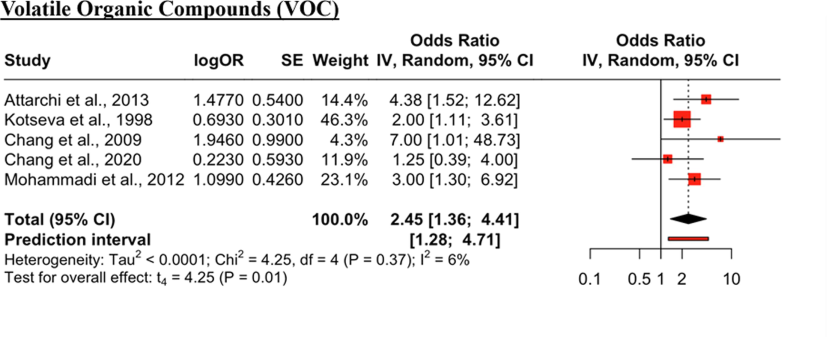
Forest Plot for VOC and hypertension. The black diamond represents the combined OR for all the studies. The red squares represent the individual OR for each study. The solid vertical line represents OR = 1. The dashed line represents the point estimate of the overall OR for all studies.
3.6 Ground level ozone (O3) and hypertension
A total of 4 studies were found. The Cochrane chi-squared test (Q) and I2 statistic revealed a significant heterogeneity (Q = 29.94p < 0.01, I2 = 90 %). The forest plot (Fig. 7) showed that increased exposures to O3 were positively but not significantly linked with an increased risk of HTN (OR = 1.35; 95 % CI: 0.67, 2,72; p = 0.27). Egger’s regression test shows no publication bias, though the funnel plot shows slight asymmetry.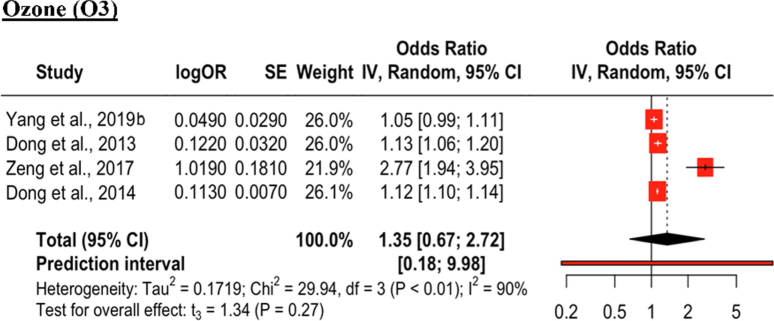
Forest Plot for O3 and Risk of HTN. The black diamond represents the combined OR for all the studies. The red squares represent the individual OR for each study. The solid vertical line represents OR = 1. The dashed line represents the point estimate of the overall OR for all studies.
4 Discussion
Worldwide, air pollution has become a highly threatening and challenging concern. The present study findings showed that PM2.5, PM10, NO2, SO2, and VOCs were positively and significantly allied with hypertension. The present study findings are based on global literature that established the rapport between air pollutants and hypertension. The worldwide scientific literature conducted by Li et al., 2022 China (Li et al., 2022), Song et al., 2021 China (Song et al., 2021), Arku et al., 2020, 21 countries (Arku et al., 2020), Yang et al., 2019 China (Yang et al., 2019), Lin et al., 2017 China (Lin et al., 2017), Yang et al, 2019 China (Yang et al., 2019), Honda et al. 2018 USA (Honda et al., 2018), Li et al., 2023 China (Li et al., 2023), Zhang et al., 2023 USA (Zhang et al., 2023), Xu et al., 2021 China (Xu et al., 2021), Babisch et al., 2014 Germany (Babisch et al., 2014), Chan et al., 2008 Taiwan (Chan et al., 2024), Dong et al., 2013 China (Dong et al., 2013), Johnson et al., 2009 USA (Johnson and Parker, 2009), Zeng et al., 2017 China (Zeng et al., 2017), Dong et al., 2014 China (Dong et al., 2014), Zhang et al., 2019 China (Zhang et al., 2019), Hassanvand et al., 2018 Iran (Hassanvand et al., 2018), Lee et al., 2016 South Korea (Lee et al., 2016), Yang et al., 2019 China (Yang et al., 2019), Chang et al., 2009 Taiwan (Chang et al., 2009), Mohammadi et al., 2012 Iran (Mohammadi et al., 2012), Chang et al., 2020 Taiwan (Chang et al., 2020), Attarchi et al., 2013 Iran (Attarchi et al., 2013), and Kotseva et al., 1998 Bulgaria (Kotseva and Popov, 1998), These studies reported that exposure to various environmental pollutants have an association with hypertension. However, Chen et al., 2015 Taiwan (Chen et al., 2015); Sørensen et al., 2012 Denmark (Sørensen et al., 2012), and Fuks et al., 2016 Germany (Fuks et al., 2016) did not find a significant link between air pollution and hypertension (Table 1).
The mechanisms behind air pollution associated with hypertension are integral to designing public health involvements to condense the cardiovascular impacts of air pollution. The known mechanisms via air pollutants could exacerbate or cause hypertension, which includes “systemic inflammation, oxidative stress responses, endothelial dysfunction, and autonomic nervous system imbalance” (Brook et al., 2010; Krittanawong et al., 2023). The inhalation of particulate initiates systemic proinflammatory and oxidative responses and the release of proinflammatory cytokines and ROS into the bloodstream, leading to inflammation in various systems, including the cardiovascular system. Oxidative stress can reduce the availability of nitric oxide, which is a key vasodilator molecule. This leads to vasoconstriction, increased vascular resistance, and high blood pressure (Brook et al., 2010). Vasoconstriction affects blood pressure and flow, making it harder for the heart to pump blood into the circulatory system through the already constricted blood vessels. This forces the heart to work harder, increasing the cardiac workload, this may, therefore, increase the chances of having other heart diseases. Systemic inflammation and oxidative stress can cause increased sympathetic activity, which then results in arterial remodelling (Krzemińska et al., 2022; Thangavel et al., 2022). Arterial remodelling is a change in blood vessel structure and or function. This causes the arteries to be more rigid and not be able to regulate the blood pressure and flow as much. Aside from the indirect influences, particulate matter can also have a direct effect on the cardiovascular system through its ability to cause vasoconstriction. The literature highlights that PM2.5 increases the imbalance of the Autonomic Nervous System, favouring the sympathetic over the parasympathetic component, and this imbalance results in vasoconstriction (Krzemińska et al., 2022; Thangavel et al., 2022).
The literature has a consensus on air pollution exposure and hypertension. The three presumed biological mechanisms that are involved in the pathophysiological influence of air pollution on cardiovascular diseases are “systemic inflammation, oxidative stress, Autonomic Nervous System imbalance, endothelial dysfunction, and vasoconstriction”, resulting in hypertension (Brook et al., 2010; Krittanawong et al., 2023; Huang et al., 2012).
4.1 Study strengths and limitations
The strength of this study is that the impact of air pollutants on hypertension has been investigated through a compilation of 28 studies from multiple countries, encompassing a total sample size of 2,540,441 individuals. The results based on such large sample-sized studies and populations provide a piece of better evidence. There are a few limitations, some evidence may be missed or overlooked due to human error. We limited our eligibility criteria to an odd ratio to better synthesize the results; however, this could have led to the exclusion of some important evidence. We also did not mix different study designs and used the most reported study design, which was cross-sectional studies, and this also could have led to the exclusion of some evidence. The concentration of the pollutants also varied widely throughout the studies, which may have affected the results.
5 Conclusions
The environmental pollutants PM2.5, PM10, NO2, SO2, and VOC significantly increased the risk of hypertension. Reducing levels of air pollutants could be a dynamic strategic approach to mitigate cardiovascular health risks in global populations. Public health initiatives aimed at reducing air pollution levels and targeted interventions to protect vulnerable populations and minimize the burden of hypertension associated with environmental exposures. Strategies such as emission controls, promotion of clean energy sources, and transportation policies that directly impact air pollution levels will have direct implications on cardiovascular health and decrease the overall prevalence of hypertension in the general population. Additionally, public health campaigns to promote cardiovascular health should incorporate education about the risk of air pollution exposure. Health officials and policymakers must establish strategies to minimize air pollution both at regional and global levels. Addressing air pollution improves cardiovascular outcomes and also contributes to the overall well-being of populations exposed to environmental stressors.
CRediT authorship contribution statement
Sultan Ayoub Meo: Writing – review & editing, Formal analysis, Conceptualization. Narmeen Shaikh: Methodology, Investigation, Formal analysis, Data curation. Metib Alotaibi: Investigation, Formal analysis, Data curation.
Funding
King Saud University, Riyadh, Saudi Arabia (RSP-2024 R47) .
Acknowledgements
The authors extend their appreciation to the “Researchers Supporting Project (RSP-2024 R47), King Saud University, Riyadh, Saudi Arabia”.
Conflicts of Interest: No conflict of interest.
Ethics Approval: The data were recorded from publicly available sources hence ethical approval was not required.
Informed Consent: Not required.
Availability of Data: The data may be provided on reasonable request.
Authors’ Contribution.
SAM: study concept, manuscript writing and editing, NA, MAO: writing a manuscript, literature review, data collection and data analysis.
Declaration of competing interest
The authors declare that they have no known competing financial interests or personal relationships that could have appeared to influence the work reported in this paper.
References
- Long-term exposure to outdoor and household air pollution and blood pressure in the Prospective Urban and Rural Epidemiological (PURE) study. Environ. Pollut.. 2020;262:114197
- [CrossRef] [Google Scholar]
- Combined effects of exposure to occupational noise and mixed organic solvents on blood pressure in car manufacturing company workers. Am J. Ind. Med.. 2013;56(2):243-251.
- [CrossRef] [Google Scholar]
- Associations between traffic noise, particulate air pollution, hypertension, and isolated systolic hypertension in adults: the KORA Study. Environ. Health Perspect.. 2014;122:492-498.
- [CrossRef] [Google Scholar]
- Particulate matter air pollution and cardiovascular disease: an update to the scientific statement from the American Heart Association. Circulation. 2010;121(21):2331-2378.
- [Google Scholar]
- Chan C, Yang HJ, Lin RT. 2024 A community-based study on the association between hypertension and air pollution. College of Public Health, National Taiwan University. Available at: https://citeseerx.ist.psu.edu/document?repid=rep1&type=pdf&doi=4d191e7e39a97404afd3da0aa94671a559c674bc. 2008; Cited date May 2.
- Effects of Co-exposure to noise and mixture of organic solvents on blood pressure. J. Occup. Health. 2009;51(4):332-339.
- [Google Scholar]
- Exposure to indoor volatile organic compounds and hypertension among thin film transistor liquid crystal display workers. Atmos.. 2020;11(7):718.
- [CrossRef] [Google Scholar]
- Associations between long-term air pollutant exposures and blood pressure in elderly residents of Taipei City: a Cross-sectional study. Environ. Health Perspect.. 2015;123(8):779-784.
- [CrossRef] [Google Scholar]
- Association between long-term air pollution and increased blood pressure and hypertension in China. Hypertension. 2013;61(3):578-584.
- [Google Scholar]
- Air pollution associated hypertension and increased blood pressure may be reduced by breastfeeding in Chinese children: the Seven Northeastern Cities Chinese Children's Study. Int. J. Cardiol.. 2014;176(3):956-961.
- [CrossRef] [Google Scholar]
- Association of long-term exposure to local industry- and traffic-specific particulate matter with arterial blood pressure and incident hypertension. Int. J. Hyg. Environ. Health. 2016;219(6):527-535.
- [Google Scholar]
- Effect of long-term exposure to ambient particulate matter on the prevalence of type 2 diabetes and hypertension in Iranian adults: an ecologic study. Environ. Sci. Pollut Res.. 2018;25:1713-1718.
- [Google Scholar]
- Associations of long-term fine particulate matter exposure with prevalent hypertension and increased blood pressure in older Americans. Environ. Res.. 2018;164:1-8.
- [CrossRef] [Google Scholar]
- Inflammatory and oxidative stress responses of healthy young adults to changes in air quality during the Beijing Olympics. Am J. Respir Crit. Care Med.. 2012;186(11):1150-1159.
- [CrossRef] [Google Scholar]
- Air pollution exposure and self-reported cardiovascular disease. Environ. Res.. 2009;109(5):582-589.
- [CrossRef] [Google Scholar]
- Study of the cardiovascular effects of occupational exposure to organic solvents. Int. Arch. Occup. Environ. Health.. 1998;71(Suppl):S87-S91.
- [Google Scholar]
- PM2.5 and cardiovascular diseases: state-of-the-art review. Int. J. Cardiol. Cardiovasc Risk Prev.. 2023;19:200217
- [CrossRef] [Google Scholar]
- Arterial hypertension-oxidative stress, and inflammation. Antioxidants (Basel).. 2022;11(1):172.
- [Google Scholar]
- Association between long-term exposure to air pollutants and prevalence of cardiovascular disease in 108 South Korean communities in 2008–2010: a cross-sectional study. Sci. Total Environ.. 2016;565:271-278.
- [Google Scholar]
- Long-term effects of PM2.5 components on blood pressure and hypertension in Chinese children and adolescents. Environ. Int.. 2022;161:107134
- [Google Scholar]
- Association between PM2.5 and hypertension among the floating population in China: a cross-sectional study. Int. J. Environ. Health Res. 2023:1-13.
- [CrossRef] [Google Scholar]
- Long-term effects of ambient PM2.5 on hypertension and blood pressure and attributable risk among older Chinese adults. Hypertension. 2017;69(5):806-812.
- [CrossRef] [Google Scholar]
- Sandstorm and its effect on particulate matter PM 2.5, carbon monoxide, nitrogen dioxide, ozone pollutants and SARS-CoV-2 cases and deaths. Sci. Total Environ.. 2021;795:148764
- [CrossRef] [Google Scholar]
- Effects of exposure to mixed organic solvents on blood pressure in non-smoking women working in a pharmaceutical company. Arch. Ind. Hyg. Toxicol.. 2012;63(2):161-169.
- [CrossRef] [Google Scholar]
- Association between long-term exposure to ambient particulate matter and blood pressure, hypertension: an updated systematic review and meta-analysis. Int. J. Environ. Health Res.. 2023;33(3):268-283.
- [Google Scholar]
- Association of long-term exposure to PM2.5 with hypertension prevalence and blood pressure in China: a cross-sectional study. BMJOpen. 2021;11:e050159
- [Google Scholar]
- Long-term exposure to traffic-related air pollution associated with blood pressure and self-reported hypertension in a Danish cohort. Environ. Health Perspect.. 2012;120(3):418-424.
- [Google Scholar]
- Associations of combined genetic and lifestyle risks with hypertension and home hypertension. Hypertens Res.. 2024;47(8):2064-2074.
- [CrossRef] [Google Scholar]
- Recent insights into particulate matter (PM2.5)-mediated toxicity in humans: an overview. Int. J. Environ. Res. Public Health.. 2022;19(12):7511.
- [Google Scholar]
- World Health Organization (WHO). Ambient (outdoor) air pollution. Available at: https://www.who.int/news-room/fact-sheets/detail/ambient-(outdoor)-air-quality-and-health. Cited date Oct 1, 2024.
- World Health Organization. Hypertension. Available at: https://www.who.int/news-room/fact-sheets/detail/hypertension. Cited date Oct 1, 2024.
- Long-term effects of ambient PM2.5 on hypertension in multi-ethnic population from Sichuan province, China: a study based. Environ. Sci. Pollut. Res. Int.. 2021;28(5):5991-6004.
- [CrossRef] [Google Scholar]
- Ambient PM1 air pollution, blood pressure, and hypertension: Insights from the 33 communities Chinese health study. Environ. Res.. 2019;170:252-259.
- [CrossRef] [Google Scholar]
- Association of long-term exposure to ambient air pollutants with risk factors for cardiovascular disease in China. JAMA Netw Open.. 2019;2(3):e190318.
- [Google Scholar]
- Short-term effects of ambient particulate matter on blood pressure among children and adolescents: a cross-sectional study in a city of Yangtze River delta, China. Chemosphere.. 2019;237:124510
- [Google Scholar]
- The positive association between short-term ambient air pollution exposure and children's blood pressure in China-Result from the Seven Northeast Cities (SNEC) study. Environ. Pollut.. 2017;224:698-705.
- [CrossRef] [Google Scholar]
- Exposure to ambient particulate matter air pollution, blood pressure and hypertension in children and adolescents: a national cross-sectional study in China. Environ. Int.. 2019;128:103-108.
- [Google Scholar]
- Hypertension and stroke as mediators of air pollution exposure and incident dementia. JAMA Netw Open.. 2023;6(9):e2333470
- [Google Scholar]


