

Translate this page into:
Assessment of the Biyadh groundwater quality and geochemical process in Saudi Arabia using statistical, modelling, and WQI methods
⁎Corresponding author at: Department of Geology and Geophysics, College of Science, King Saud University, P.O. box 2455, Riyadh 11451, Saudi Arabia. tgalharbi@ksu.edu.sa (Talal Alharbi)
-
Received: ,
Accepted: ,
This article was originally published by Elsevier and was migrated to Scientific Scholar after the change of Publisher.
Peer review under responsibility of King Saud University.
Abstract
This research aimed to understand the variations in the groundwater quality and hydrochemical processes in the Biyadh aquifers in central Saudi Arabia. The Biyadh Aquifer in the Riyadh area is the primary natural water resource for Wadi Sahba and Wasia Well Fields. The present study collected thirty groundwater samples from the Biyadh aquifer in the outcrop and confined parts. The samples were evaluated by multivariate statistical methods and hydrochemical modelling to understand the geochemical processes that control the groundwater. Also, it used various indexes to find the groundwater's suitability for drinking, agricultural, and industrial purposes. The analysis revealed a general evolution in groundwater quality as groundwater flowed east and northeast. The TDS increases from 1730 mg/l in WS to 2370 mg/l in WWF. The groundwater facies developed from Ca-Mg-SO4-Cl to Ca-Na-Mg-SO4-Cl in WS and ended with Ca-Na-SO4-Cl in WWF. Applying Pearson's correlation matrix, cluster analyses, and factor analyses indicate that the ions significantly influence groundwater mineralization. The geochemical modelling revealed that the dissolution of the calcite, halite, anhydrite, and gypsum minerals increases with the direction of groundwater flow. In addition, the agriculture activities in Wadi Sahba mixed with irrigation return water to groundwater and increase nitrate (NO3) concentration. Biyadh groundwater has a better quality for drinking in the confined aquifer than in the unconfined aquifer, and both areas are suitable for irrigation. The TH indicates that the groundwater becomes more suitable for industrial purposes as it flows toward the confined part of the aquifer.
Keywords
Groundwater quality
Geochemical process
Water Quality Index
Saudi Arabia
Biyadh aquifer

1 Introduction
Groundwater is a significant component of the Earth's water cycle and is essential for sustaining human life. This critical resource is being challenged by urbanization, climate change, and population growth. As there are issues obtaining sufficient water to meet the increasing demand, groundwater research is becoming more crucial to understanding the long-term sustainability of water resources, how climatic change affects the water cycle, how natural disasters affect groundwater sources, and how groundwater quality affects human health (Richey et al., 2015; DeNicola et al., 2015).
Groundwater plays a vital role in the economic and social development of arid countries like Saudi Arabia. With rising demands for water, especially from agriculture and urban sectors, groundwater resources must be managed to ensure balanced use and sustainable withdrawal. Riyadh, the capital of Saudi Arabia, is experiencing rapid economic growth due to tourism projects, resulting in abundant jobs and increased internal migration rates (Almatar, 2022). This continuous increase in population was accompanied by high groundwater exploitation, which affected its quantities and qualities (Alzahrani et al., 2022; Alharbi & Zaidi, 2018).
Wasia Well Field (WWF) and Wadi Sahba (WS) are the two important sites for providing water to Riyadh. They extract groundwater from the Biyadh aquifer in central Saudi Arabia. WWF provides 20% of the city's drinking and domestic needs, besides the 80% provided by desalination plants in the Arabian Gulf. Wadi Sahba is the main irrigation water for the Al Kharj area's agricultural fields and the primary food product supplier for Riyadh city (Al-Omran et al., 2015; Al-Harbi & Hussain, 2009). After decades of production, we need to check the groundwater quality in the Biyadh aquifer (Fallatah, 2020).
Previous studies of groundwater in Wadi Sahba and Wasia Well Field (Al-Harbi & Hussein, 2009; Alharbi & Zaidi, 2018; Khogali et al., 2020; Zaidi et al., 2016; Alfaifi et al., 2017) focused on ionic relationships and groundwater types to understand the hydrogeochemical processes that influence the Biyadh groundwater. Multivariate statistical analysis, particularly cluster and factor analysis, was used to determine the underlying processes driving groundwater chemistry in the aquifer. None of these studies investigates the differences in groundwater quality in Biyadh between the unconfined aquifer in WS and the confined beds in WWF.
It is crucial to conduct research tracking the spatial changes in the Biyadh groundwater quality from the outcrop to the confined beds. The current research addresses how the groundwater quality changed from the WS to the WWF regarding chemical processes and mineral saturation. Besides, the study will determine the groundwater's suitability for drinking, agricultural, and industrial uses. These objectives were achieved by determining the groundwater types using a Piper diagram, using various statistical techniques, identifying hydrogeochemical trends, and comparing the geochemistry in WWF and WS.
2 Study area
The research region is located in Saudi Arabia's centre, between 47° − 48oE and 24°−25.30oN. The research focuses on two sites, Wadi Sahba and Wasia Well Field (Fig. 1).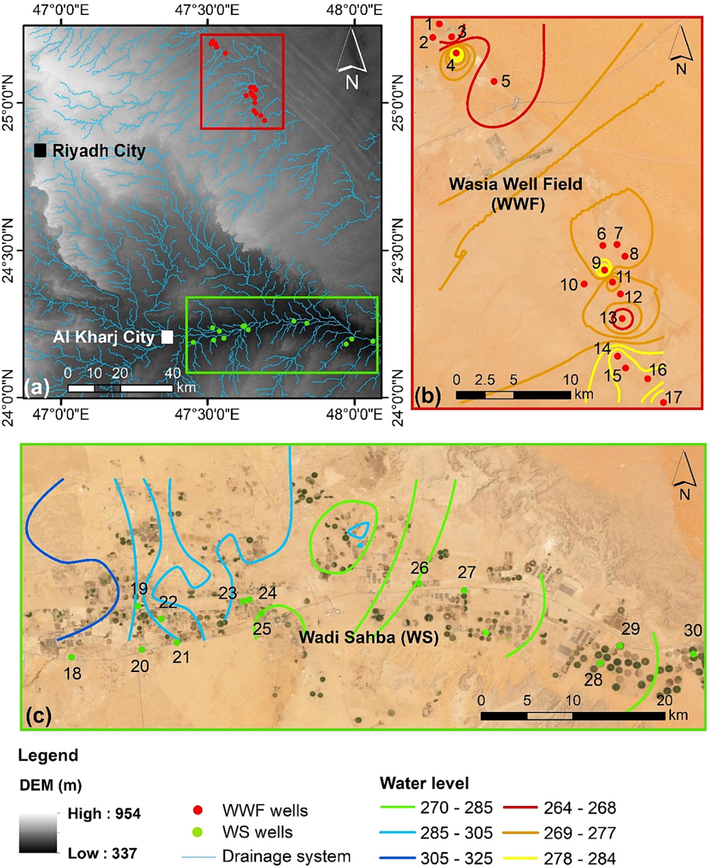
(a) Map showing the location of the study area and the drainage system. (b) Map showing the sampling locations of the Wasia Well Field (WWF) and the groundwater level map for the Biyadh aquifer in WWF. (c) Map showing the sampling locations of the Wadi Sahba (WS) and groundwater level map for the Biyadh aquifer in Wadi Sahba.
2.1 Topography and geology
The study area is underlain by series of sedimentary formations interrupted by Wadi Sahba, major depression in the south of WWF. This wadi primarily consists of recent deposits such as silt, sand, and conglomerate (Powers et al. 1966; BRGM, 1976; Alharbi & Zaidi, 2018). The area's elevation from west to east ranges from 954 m to 337 m AMSL. The lowest height in the area is the WS's alluvial sediments in the south and southeast (Fig. 1a). The Biyadh formation outcrop in the Wadi Dawasir is about 515 m; it decreases in thickness to 360 in the north of WS, then gradually disappears in the north. (Powers et al. 1966; BRGM, 1976). The Biyadh formation consists of conglomeratic to fine-grained sandstone with siltstone, mudstone, and claystone beds (Fig. 2). The Biyadh formation average thickness in WS is 400 m and 425 m in WWF (Keller et al., 2019; Jaju et al. 2016).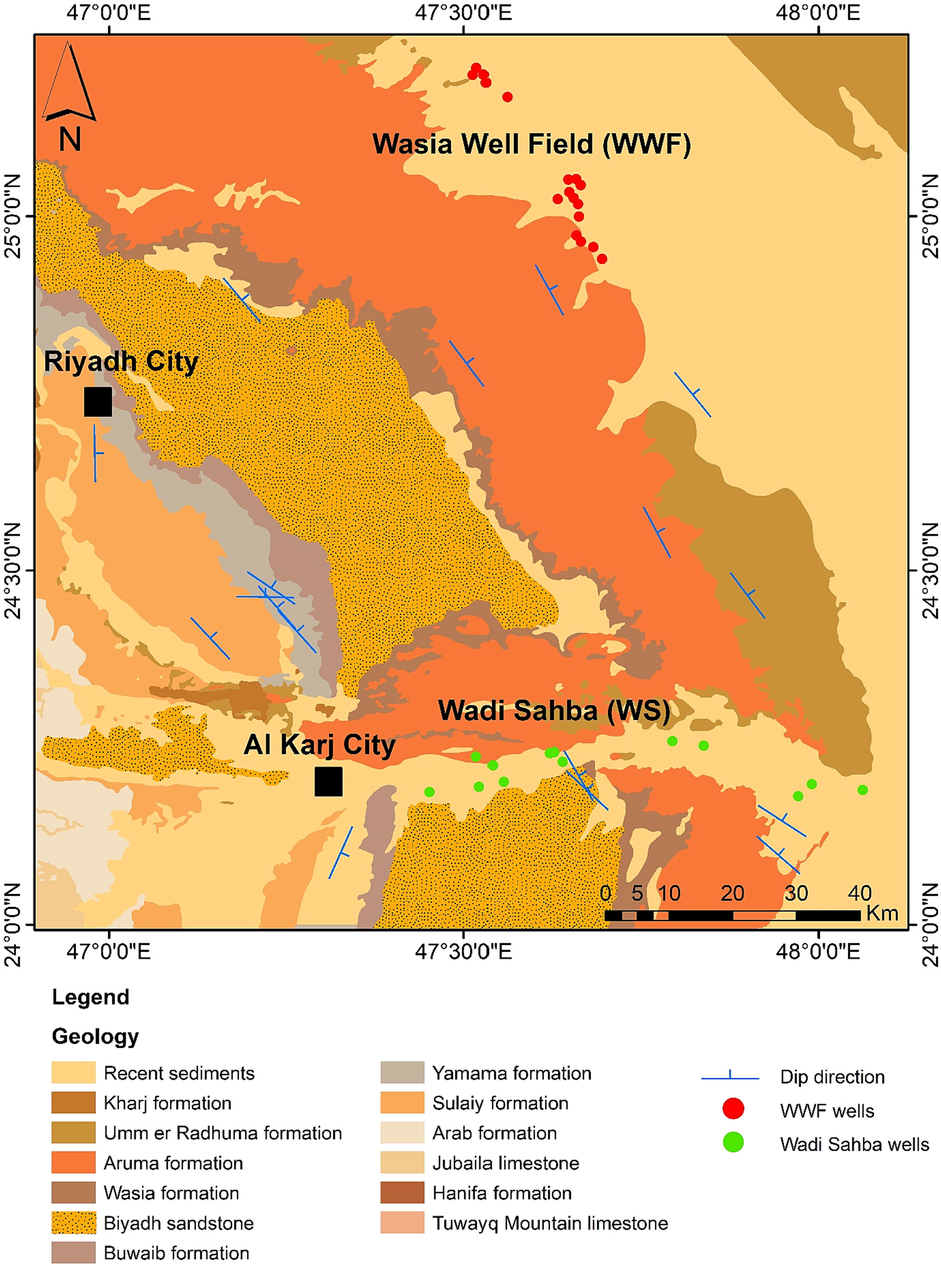
Geological map of the Biyadh formation and the main formation in the study area.
2.2 Hydrogeology and climate
The Biyadh aquifer is recharged by rainfall from the outcrop area and adjoining valleys in the area (Fig. 1a). As a result that the Biyadh is in an arid region, a low amount of rainfall is received yearly. Researches revealed that the yearly average rainfall in Saudi Arabia is 59 mm/y, and about 1.8 mm is recharged to the aquifers (Uitto & Schneider, 1997; Alsharhan et al., 2001).
The groundwater level of the Biyadh Aquifer in WS ranges from 325 to 275 m AMSL, with groundwater flowing from the west to east (Fig. 1c). In the WWF, the Biyadh Aquifer water level is below 285 m AMSL (Fig. 1b). From the WS to WWF, the water level is decreasing and follows with the regional topography. The Biyadh groundwater depth below ground level varies in WS from 92 to 130 m and 270 to 285 m in WWF.
The study area has a high seasonal record range. In the winter season, from December to March, the temperature in day and night times varies between 21 and 28 °C and 6–12 °C, respectively. This season, the humidity has high records reach 54%, but the evaporation records in its lowest levels, reaching 3 mm. From May to August, the temperature and evaporation records are very high, 41 °C and 12 mm, respectively, and the humidity has a minimum record rate of 27% because there is little to no rain during the summer (Alharbi & Zaidi, 2018).
3 Data sources and methods
The hydrochemical and hydrological data used in this study were collected from two sources; the first was obtained from geological field trips to WS in the Al Kharj area. In these trips, thirteen groundwater samples were collected, and hydrogeological records were measurements for this study. The Ministry of Environment, Water, and Agriculture provided the second data source. These data include hydrological and hydrochemical data for seventeen groundwater wells in WWF. These wells are mainly pumped from the Biyadh aquifer. The two sources provide 30 groundwater samples that were studied in this research.
Using portable meters, TDS, EC, and pH were measured on field trips. Besides, groundwater samples were collected in polyethylene bottles from the wells after they had been pumped for 10 min to prevent contamination. Chemical tests were done on the groundwater samples in the Central Lab Facility in the College of Science at King Saud University. These tests were done in line with APHA (2005) standards. The ionic balance equation is used to confirm the chemical analysis's correctness and remove all groundwater samples with errors exceeding ±5%. After this process, all the 30 groundwater samples in this study were approved (Supplementary table).
Several software programs were used to analyze the groundwater chemical analysis data in order to identify the groundwater facies, compute the minerals' saturation indices, and suggest their suitability for different purposes. They were also employed in the statistical analysis to show the correlations between the chemical ions and determine the key components in groundwater chemistry. The water quality was calculated and statistically analyzed using IBM SPSS 23, a software package that enables advanced statistical analysis, and Microsoft Excel, which provides spreadsheets to create formulas for data calculations. Geochemical modeling was done with the help of PHREEQC, a computer program that simulates chemical reactions in water, and Aquachem, a program that analyzes data about water quality. The digitizing, creating, and displaying maps were done with ArcGis 10.7.
4 Results and discussion
4.1 Hydrochemical characteristics
The physical and chemical hydrochemical parameters determined at WWF and WS sites are summarized in Table 1. The total dissolved solids mean in WWF is 2370 mg/l and 1729 mg/l in WS. Calcium, with a mean content of 340 mg/l in WWF, is the most abundant cation at both locations, followed by sodium, with a mean concentration of 203 mg/l, and magnesium, with a mean concentration of 117 mg/l. Sulfate is the most abundant anion in the WWF and WS, with mean values of 340 and 771 mg/l, respectively. Sulfate has a wide range in WS, where the minimum value is 888 mg/l, and the maximum is 4752 mg/L. After sulfate, chloride had a mean concentration of 501 mg/l in WWF and 825 mg/l in WS. The bicarbonate ion follows up chloride ion with mean concentrations value 179 mg/l in WWF and 231 mg/l in WS. Nitrate varies from minor amounts 4 to 17 mg/l in WWF to higher values reach 46 mg/L in WS, which exceeds the prescribed limits by the Saudi Standards, Metrology and Quality Organization (SASO 2000) and WHO (2011).
Site
Statistic
TDS
EC
Ca
Mg
Na
Cl
HCO3
SO4
NO3
WWF
Mean
2370
3121
340
117
203
501
179
883
7
Median
2493
3278
344
107
224
520
179
900
6
Standard Deviation
364
459
44
37
66
76
17
129
3
Range
1207
1558
192
136
228
252
81
475
11
Minimum
1520
2006
240
53
70
338
149
625
4
Maximum
2727
3564
432
190
298
590
229
1100
15
Count
17
17
17
17
17
17
17
17
17
WS
Mean
1729
3527
771
65
422
825
231
1807
37
Median
1888
3850
609
54
378
708
224
1430
41
Standard Deviation
520
1060
520
37
325
566
25
1321
14
Range
1571
3204
1524
111
969
1727
83
3864
40
Minimum
875
1786
406
36
156
323
202
888
6
Maximum
2446
4990
1930
147
1125
2050
285
4752
46
Count
13
13
13
13
13
13
13
13
13
4.2 Hydrochemical classification
In this research, the groundwater facies of the Biyadh Aquifer were categorized using a Piper diagram (Fig. 3). The cationic triangle shows that all the samples from WWF and WS fall into the Ca-dominant type and SO4-dominant in the anionic triangle, indicating the dissolution of gypsum, anhydrite, and calcium minerals. Nevertheless, most groundwater facies of the Biyadh aquifer in the WWF site classified into the Ca-Na-SO4-Cl type (15 samples), and only two samples have Ca-Mg-SO4-Cl type. These groundwater facies show the influence of the dissolution of gypsum and anhydrite minerals. In the WS site, the groundwater types shift with the direction of groundwater flow. In well number 18, the water type is Ca-Mg-SO4-Cl and becomes Ca-Mg-Na-SO4-Cl in well number 24 and finally develops Ca-Na-Mg-SO4-Cl in well number 28. This shift suggests that the dissolving rate of halite minerals in WS rises with the direction of groundwater flow.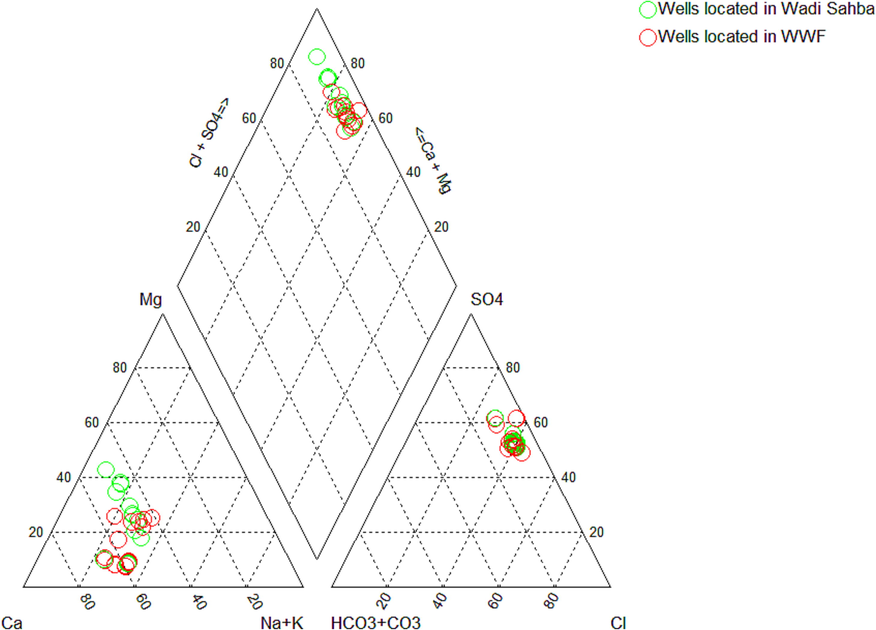
Piper’s Trilinear Diagram for wells located in Wadi Sahba and Wasia Well Field.
4.3 Correlation matrix
The Correlation coefficients among ions could help identify the processes contributing to groundwater salinization (Helsel & Hirsch,1992). Table 2 presents the results of the analyses. The WS groundwater exhibit a typical positive relationship between EC-TDS and a strong positive relationship between Ca-Cl, Ca-SO4, Mg-Cl, Mg-SO4, Cl-SO4, and HCO3-NO3, which demonstrates that the mineralization has a major impact on groundwater. The strong relationship between Ca and Cl may occur because of limestone rocks' reaction with hydrochloric acid to increase Ca and Cl ions in the groundwater. Calcium and sulfate have strong positive relationships, which could mean that Ca and SO4 ions come from the dissolution of anhydrite and gypsum.
Site
Statistic
EC
TDS
Ca
Mg
Na
Cl
HCO3
SO4
NO3
WS
EC
1.00
TDS
1.00
1.00
Ca
0.20
0.22
1.00
Mg
0.68
0.70
0.58
1.00
Na
0.01
0.03
0.38
−0.05
1.00
Cl
0.52
0.54
0.87
0.71
0.55
1.00
HCO3
−0.27
−0.25
0.54
0.30
0.56
0.51
1.00
SO4
0.38
0.41
0.87
0.71
0.58
0.93
0.65
1.00
NO3
−0.25
−0.23
0.51
0.12
0.41
0.39
0.71
0.47
1.00
WWF
EC
1.00
TDS
0.73
1.00
Ca
0.67
0.28
1.00
Mg
0.38
0.76
0.35
1.00
Na
0.73
0.35
0.98
0.31
1.00
Cl
0.77
0.44
0.98
0.45
0.98
1.00
HCO3
0.61
0.01
0.89
−0.07
0.87
0.84
1.00
SO4
0.68
0.32
1.00
0.40
0.98
0.99
0.85
1.00
NO3
0.17
−0.37
0.33
−0.38
0.40
0.25
0.45
0.33
1.00
Moreover, the strong relationship between Mg with Cl and SO4 may imply that fertilizers are a dominant contributor of these ions. However, there is no strong negative relationship found between all ions. HCO3 and NO3 have a strong relationship. The possible interpretation of this relation is the agriculture activities in WS. When mixed with fertilizers in agricultural areas, irrigation water infiltrates through the rock layers and may reach the groundwater, which increases its concentration of NO3. The presence of organic matter increases carbon dioxide and is then mixed with groundwater to produce carbonic acid and bicarbonate.
The results of Pearson's correlation matrix for WWF wells are shown in Table 2. It demonstrates a significant positive correlation between Ca-Na, Ca-Cl, Ca-HCO3, Na-Cl, Na-HCO3, Na-SO4, Cl-HCO3, Cl-SO4, HCO3-SO4; and a typical strong relationship between Ca-SO4. These relationships revealed that groundwater mineralization is affected by these ions. The strong relationship between Ca and Cl may occur because of limestone rocks' reaction with hydrochloric acid to increase Ca and Cl ions in the groundwater. The Ca against SO4 shows typical strong positive relationships, indicating that anhydrite and gypsum's dissolutions are the Ca and SO4 ions' natural sources.
Furthermore, Na and Cl display a strong correlation, indicating that the dissolution of the halite mineral is the source of the two ions. In the WWF, the relationship between HCO3 and NO3 was different from the WS site. It is characterized as medium to week relationship. Since the WWF samples were taken from a greater depth than the WS samples, the shallow aquifer's groundwater had no effect on the NO3 concentration.
4.4 Multivariate statistical methods
Multivariate statistical analyses consist of several methods applied to several practical investigations, including the classification of hydrochemical facies (Belkhiri & Narany, 2015). These methods were proposed to be used for the classification of hydrochemical facies. This analysis involves Cluster Analysis (CA) and Factor Analysis (FA) (Pathak, 2012). These two techniques better understand the groundwater systems and the hydrochemical processes that govern them through data reduction and classification (Kolsi et al., 2013; Yidana et al., 2010). The analysis in these methods involves concentrations of chemical species (cations: calcium (Ca), magnesium (Mg), sodium (Na); and anions: bicarbonate (HCO3), chloride (Cl), sulfate (SO4), and Nitrate (NO3).
Cluster analysis attempts to find the group of variables based on attribute information about the variables and display them in groups on a tree diagram known as a dendrogram, which showing the grouping according to the order in which they were joined during clustering (Aggarwal & Reddy, 2013). Groundwater samples from Biyadh aquifer in WWF and WS sites were clustered using the SPSS software package. Fig. 4 revealed the resulting dendrogram for the variables. It was interpreted to have classified the major ions in 30 groundwater samples into four groups using seven variables. The first group shows a similarity between Mg, NO3, and HCO3, which probably represents the effects of agriculture fertilizers on groundwater in WS. The second group is represented by Na, which derive from the dissolution of halite mineral in the WWF and Sahba groundwater. The third group includes Ca, Cl, which probably means the effects of limestone rocks' reaction with hydrochloric acid. Finally, the fourth group is represented by SO4, which could correspond to the dissolution of anhydrite and gypsum.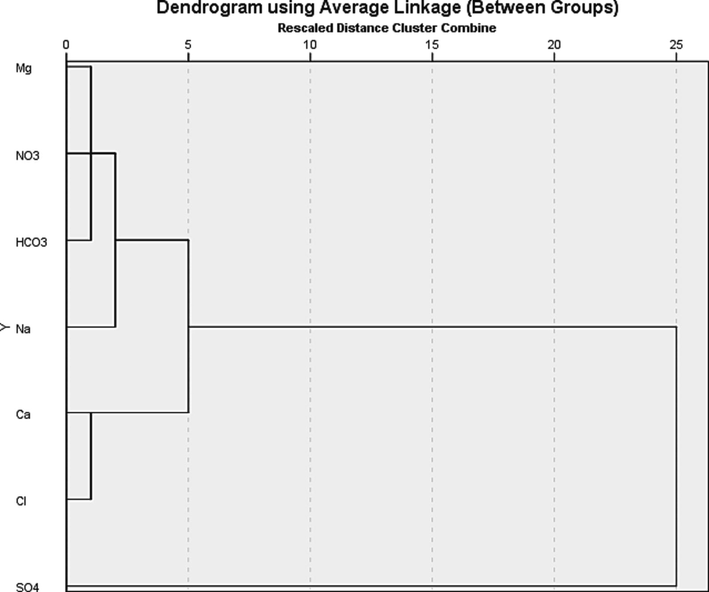
A Dendrogram showing the clustering of elements linked by their geochemical similarity within the samples.
Factor analysis was used to find out what ions have in common and group them into small components (Kim et al., 2005). The most used approach to factor analysis is Principal Component Analysis (PCA). It works to find a linear set of variables. Then the maximum variance is removed from the variables and seeks a second linear combination that explains the maximum proportion of the remaining variance (Senapathi et al., 2019). The analysis yields two factors that are responsible for about 93% of the variation in groundwater chemistry. Factor 1 controlled 71% of the groundwater chemistry and has high loadings on Ca, Na, Cl, HCO3, SO4 (Fig. 5). This component indicates the effect of these ions on the overall mineralization of groundwater and the dissolution of calcite and gypsum minerals. Factor 2 has high positive loading on Mg that anhydrite can explain its significant effect on 22% of groundwater chemistry variation.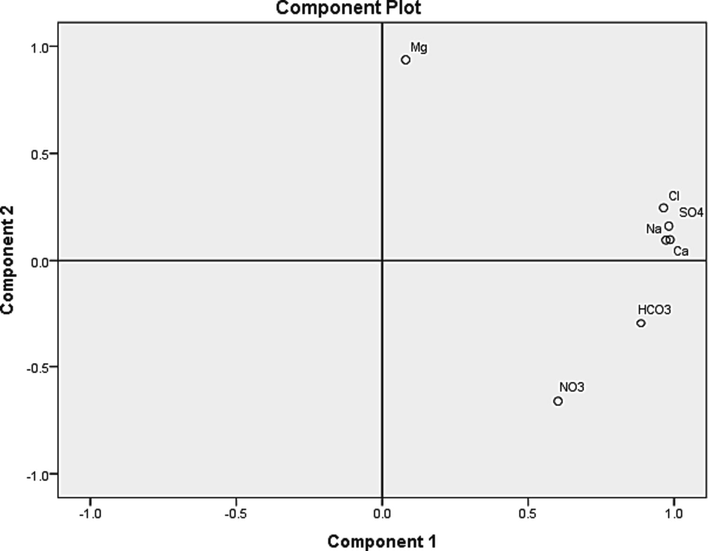
Principal component analysis (PCA) plot showing the similarities and dissimilarities among the elements.
4.5 Hydrochemical modelling
PHREEQC is a Hydrochemical model extensively used to understand and calculate the saturation indices of groundwater with respect to mineral phases (Parkhurst & Appelo, 1999). Through thermodynamic calculations of ionic activities, it could indicate the equilibrium state between groundwater and aquifer materials. The United States Geological Survey created this program for the aqueous elements’ dissolution and precipitation to solid phases.
4.6 Saturation indices
The saturation index (SI) can measure the equilibrium state between minerals and groundwater. When the SI of a mineral is zero, it means that the aquifer's groundwater is in an equilibrium state concerning that mineral. If it is less than zero, groundwater is undersaturated and can dissolve the mineral. However, if SI is more than zero, this means the water is oversaturated for that mineral and can precipitate it (Saleh et al., 1999).
The following equation calculates the saturation index:
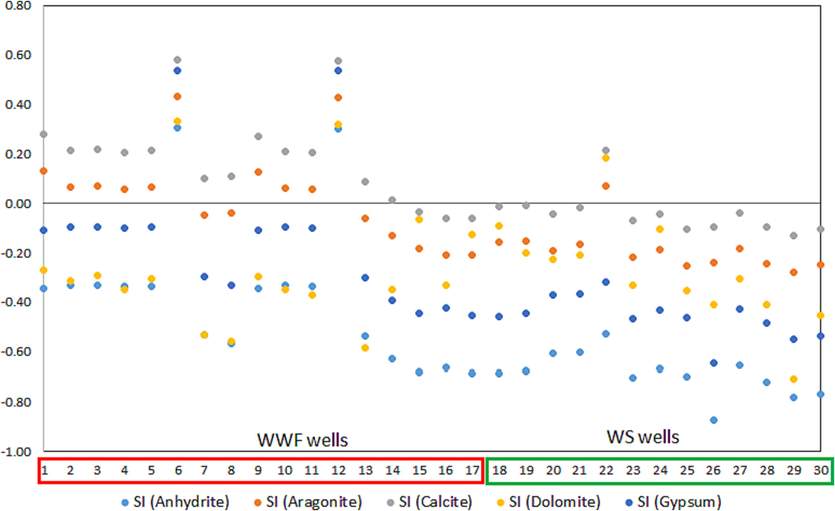
X-Y plot showing the saturation state for anhydrite, aragonite, calcite, gypsum, and anhydrite minerals in WWF and WS sites.
4.7 Groundwater quality for Drinking, Irrigation, and industrial purposes
4.7.1 Groundwater quality for drinking purpose
At WWF and WS sites, the study evaluated Biyadh groundwater for drinking, irrigation, and industry usage (Bhunia et al., 2018). The Water Quality Index (WQI) is widely used to define and rank the suitability of groundwater to drink (Abbasnia et al., 2018; Gabr et al., 2021). This equation required calculation in several steps and evaluated based on Saudi Standards, Metrology, and Quality Organization (Table 3) (SASO 2000; Bhunia et al., 2018; Lateef, 2011).
Physicochemical parameter
SASO (2000)
Weight (wi)
Relative weight (Wi)
pH
6.5–8.5
4
0.12
TDS
1,000
5
0.15
Ca2
200
3
0.09
Mg2
150
3
0.09
Na
200
4
0.12
Cl
250
5
0.15
SO4
250
5
0.15
NO3
50
5
0.15
The parameters used for the calculations involve pH, TDS, Ca, Mg, Na, K, Cl, SO4, and NO3 (Annapoorna & Janardhana, 2015). These parameters are assigned weights depending on their importance on the water quality for drinking and health effects (Ugochukwu et al., 2019). The parameters have the highest rank of five, including TDS, Cl, SO4, and NO3, since they have a significant role in assessing water quality for drinking (Lateef, 2011); Na and pH are given weight four and three for Ca and Mg (Table 3). TDS, Cl, SO4, and NO3, are the primary parameters in determining the quality of drinking water (Gabr et al., 2021; Abbasnia et al., 2018). SASO 2000 defined that concentrations that exceed the maximum permissible level of these ions in water are not toxic to drinking but may affect people's health (Shil et al., 2019). After weighting the concentrations, the Wi values calculated using the following equation:
The equation computes the relative weight of each variable, wi is the variable weight, Wi is the relative weight, and n is the number of variables in the equation.
The quality rating scale (qi) for the variables is calculated next by dividing the water sample concentration level by the SASO 2000 standard and multiplying by 100, as indicated in the following equation:
In the equation, qi indicates the quality rating, Si is the SASO 2000 standard for drinking water parameters in mg/l, and Ci is the parameter concentration in mg/l (Lateef, 2011). SIi computes the chemical parameter based on the two flowing equations, and SI is then used to calculate WQI.
SIi represents the parameter's subindex, qi represents the quality rating, and WQI is the water quality type (Mahmud et al., 2020). Based on the Water Quality Index, the groundwater categorize as excellent, good, poor, very poor, and unsuitable when its value range <50, 50–100, 100–200, 200–300, and >300, respectively. The result of the WQI calculations presents in Table 4. It shows WQI values range from 120 to 184 on the WWF site, and all its samples are classified as poor drinking water. In contrast, the WQI for WS ranges from 134 to 618 and has 38% of the samples classified as poor water, 46% as very poor water, and 15% water unsuitable for drinking. Generally, The WWF shows poor water in its groundwater related to the strong water–rock interaction in the Biyadh Aquifer. WS site has poor drinking water quality compared to the WWF because of the groundwater's overexploitation and agricultural activities.
No.
Aquifer
WQI
Type of water
SAR
SAR Classif.
Na%
Na% Classif.
MH
MH Classif.
PI
PI Classif.
TH
TH Classif.
1
WWF
120
Poor
2.79
Very good
32
Good
32
Suitable
35
Suitable
53
Soft
2
WWF
173
Poor
1.51
Very good
16
Excellent
45
Suitable
18
Unsuitable
103
Moderately hard
3
WWF
120
Poor
2.11
Very good
26
Good
23
Suitable
29
Suitable
54
Soft
4
WWF
169
Poor
3.52
Very good
34
Good
38
Suitable
36
Suitable
76
Moderately hard
5
WWF
130
Poor
1.67
Very good
20
Excellent
32
Suitable
23
Suitable
68
Soft water
6
WWF
155
Poor
2.90
Very good
30
Good
34
Suitable
32
Suitable
72
Soft water
7
WWF
168
Poor
2.64
Very good
26
Good
35
Suitable
29
Suitable
83
Moderately hard
8
WWF
168
Poor
2.91
Very good
29
Good
34
Suitable
31
Suitable
78
Moderately hard
9
WWF
158
Poor
1.45
Very good
16
Excellent
41
Suitable
18
Unsuitable
92
Moderately hard
10
WWF
169
Poor
3.53
Very good
33
Good
26
Suitable
36
Suitable
72
Soft
11
WWF
165
Poor
1.52
Very good
16
Excellent
45
Suitable
19
Unsuitable
98
Moderately hard
12
WWF
166
Poor
3.15
Very good
31
Good
35
Suitable
33
Suitable
76
Moderately hard
13
WWF
165
Poor
0.74
Very good
8
Excellent
46
Suitable
11
Unsuitable
109
Moderately hard
14
WWF
171
Poor
2.73
Very good
27
Good
32
Suitable
29
Suitable
82
Moderately hard
15
WWF
184
Poor
2.41
Very good
23
Good
38
Suitable
25
Suitable
97
Moderately hard
16
WWF
183
Poor
2.68
Very good
26
Good
36
Suitable
28
Suitable
92
Moderately hard
17
WWF
178
Poor
3.32
Very good
30
Good
29
Suitable
32
Suitable
90
Moderately hard
18
WS
228
Very poor
3.93
Very good
32
Good
12
Suitable
34
Suitable
93
Moderately hard
19
WS
614
Unsuitable
6.64
Very good
31
Good
11
Suitable
32
Suitable
290
Hard
20
WS
230
Very poor
3.94
Very good
32
Good
13
Suitable
34
Suitable
94
Moderately hard
21
WS
199
Poor
2.50
Very good
23
Good
11
Suitable
25
Suitable
96
Moderately hard
22
WS
201
Poor
2.51
Very good
23
Good
11
Suitable
25
Suitable
97
Moderately hard
23
WS
140
Poor
1.98
Very good
22
Good
13
Suitable
25
Suitable
65
Soft water
24
WS
134
Poor
1.99
Very good
23
Good
13
Suitable
26
Suitable
63
Soft water
25
WS
142
Poor
1.99
Very good
22
Good
14
Suitable
25
Suitable
66
Soft water
26
WS
231
Very poor
3.94
Very good
32
Good
14
Suitable
34
Suitable
96
Moderately hard
27
WS
232
Very poor
3.94
Very good
32
Good
14
Suitable
34
Suitable
97
Moderately hard
28
WS
618
Unsuitable
6.64
Very good
31
Good
11
Suitable
32
Suitable
291
Hard
29
WS
228
Very poor
3.97
Very good
32
Good
13
Suitable
34
Suitable
94
Moderately hard
30
WS
231
Very poor
3.94
Very good
32
Good
14
Suitable
34
Suitable
96
Moderately hard
4.7.2 Groundwater quality for irrigation purpose
The sodium concentration of groundwater is the primary factor determining its appropriateness for irrigation. Irrigating farms with a high concentration of Na water will negatively affect soil permeability and crop productivity. Several equations have been recommended to scale the sodium content in water for irrigation purposes (Singh, 2019). These equations compare the Na concentration to total cations within the water, and all expressed in meq/l. The current study examines and categorizes the appropriateness of Biyadh groundwater for irrigation using the Sodium Adsorption Ratio (SAR), Sodium Percentage (Na%), Permeability Index (PI), and Magnesium Ratio (MR). Classifying the Biyadh groundwater can be identified based on the SAR equation:
Based on the equation, any SAR values below ten are classified as very good water, the values between 10 and 18 are good water, the SAR values from 18 to 26 are classified as poor water, and anything above 26 means the groundwater is very poor for irrigation (Glover, 1996). The calculations presented in Table 4 shows SAR values in the WWF range from 0.75 to 3.5 and in the WS from 3 to 4. Consequently, the results indicate that all the Biyadh Aquifer groundwater in WWF and WS sites are suitable for irrigation purposes.
Another critical evaluator in determining water suitability for irrigation is the Sodium Percentage (Na %). The percentage of sodium in groundwater is vital in defining irrigation quality since sodium results in soil hardness, thus reducing soil permeability (Singh, 2020). The calculation of Na % can be done using the below equation:
Table 4 shows the classification of groundwater samples based on Na% findings. The WWF calculations vary from 8 to 33 and in the WS from 22 to 32. The majority of the samples in both locations are rated as excellent to good for irrigation use.
The permeability index (PI) is also applied to determine the suitability of groundwater for irrigation, and it is calculated as follows:
The classification of PI includes three classes based on permeability levels. Class I values above 75 %, Class II between 25% and 75 %, and class III involve values below 25 % (Singh, 2020). Since Class II and Class I show at least 25% permeability, there are suitable for irrigation. On the other hand, Class III waters are not ideal for irrigation since the maximum permeability level is below 25%. The results show that all PI in WS classified in Class II. Consequently, the equation revealed 13 samples of WWF have fallen in Class II and four samples classified as class III (Table 4).
The magnesium ratio (MR) has also been proposed as a metric for determining groundwater suitability for irrigation (Rawat et al., 2018). A high Mg level harms the soil when groundwater has increased salinity levels and results in more alkalinity levels in soil, influencing agriculture production (Abbasnia et al., 2018). The MR equation is represented as the ratio of Mg ion concentration to the concentration of Mg and Ca ions combined (Bhunia et al., 2018). The result is then multiplied by 100, as shown in the equation.
If the equation's outcome is more than 50, the groundwater is considered unsuitable for irrigation since it would cause adverse effects on agriculture production (Rawat et al., 2018). All Biyadh groundwater samples are categorized as suitable for irrigation (Table 4).
4.7.3 Groundwater quality for industrial purpose
Various formulae help determine the acceptability of water for industrial use; in this study, the total hardness (TH) was employed to determine the industrial suitability of the Biyadh groundwater.
Due to the presence of Ca and Mg, total hardness is produced. Hard water will be coating in the pipes with deposits such as CaCO3, CaSO4, and Mg(OH)2. Water hardness is categorized into four classes, over 300 as very hard water, from 150 to 300 as hard water, 75 to 150 as moderately hard water, and below 75 soft water (Todd & Mays, 2018). Using the following formula, the TH can be determined:
The calculations classify 23% of the WS groundwater as soft water, 62% as moderately hard water, and 15% as hard water. Therefore, 30% of WWF samples are classified as soft water, and 70% as moderately hard water (Table 4).
5 Conclusions
Thirty groundwater samples from the Biyadh aquifer in Wasia Well Field and Wadi Sahba were analyzed to assess the evolution of groundwater quality, hydrochemical processes, and its consumption for drinking, agriculture, and industry. The groundwater TDS values increase from the outcrop toward the WWF, and the water type changes from Ca-Mg-SO4-Cl to Ca-Na-SO4-Cl in WWF groundwater. The correlation matrix calculations of Pearson indicate that ions have a considerable effect on groundwater mineralization. Cluster and factor studies suggest that agricultural fertilizers and the dissolution of halite, anhydrite, and gypsum minerals may affect the groundwater in Wadi Sahba. The geochemical modeling reveals that the direction of groundwater flow increases the dissolution processes involving anhydrite, aragonite, calcite, dolomite, and gypsum minerals. According to the WWF, Biyadh's drinking water quality is poor. In addition, 38% of water samples in WS are of poor quality, 46% are of very poor quality, and 15% are unsuitable for consumption. The aquifer is classified as appropriate for irrigation and industrial reasons.
The importance of this research lies in providing sufficient information for decision-makers in the city of Riyadh to determine the appropriate groundwater sites for residential, agricultural, and industrial projects. For future work, the study recommends investigating the amount of rainfall recharge to the Biyadh aquifer and comparing the outcome with the volume of groundwater withdrawn.
Acknowledgement
The authors extend their appreciation to Researchers Supporting Project number (RSPD2023R791), King Saud University, Riyadh, Saudi Arabia. Moreover, the authors thank the anonymous reviewers for their valuable suggestions and constructive comments.
Declaration of Competing Interest
The authors declare that they have no known competing financial interests or personal relationships that could have appeared to influence the work reported in this paper.
References
- Evaluation of groundwater quality using water quality index and its suitability for assessing water for drinking and irrigation purposes: case study of Sistan and Baluchistan province (Iran) Hum. Ecol. Risk Assessment: An Int. J.. 2018;25(4):988-1005.
- [CrossRef] [Google Scholar]
- Data Clustering: Algorithms and Applications (first ed.). Chapman and Hall/CRC; 2013.
- Groundwater management scenarios for the Biyadh-Wasia aquifer systems in the eastern part of Riyadh region, Saudi Arabia. J. Geol. Soc. India. 2017;89:669-674.
- [Google Scholar]
- Al-Harbi, T.G., Hussein, M.T., 2009. Statistical Evaluation of Groundwater Quality in Wasia Well Field, Saudi Arabia. J. King Saud Univ., vol. 21, Science, pp. 125-135.
- Hydrochemical classification and multivariate statistical analysis of groundwater from Wadi Sahba area in central Saudi Arabia. Arab. J. Geosci.. 2018;11(20)
- [CrossRef] [Google Scholar]
- Transit-oriented development in Saudi Arabia: Riyadh as a case study. Sustainability. 2022;14(23):16129.
- [CrossRef] [Google Scholar]
- Hydrochemical characterization of groundwater under agricultural land in arid environment: a case study of Al-Kharj. Saudi Arabia. Arabian J. Geosci.. 2015;9(1)
- [Google Scholar]
- Hydrogeology of an arid region: the Arabian Gulf and adjoining areas. Amsterdam: Elsevier; 2001.
- Use of geoelectrical resistivity method for detecting near-surface groundwater potential zones at Riyadh city, Saudi Arabia. J. King Saud Univ.-Sci.. 2022;34(7):102253
- [Google Scholar]
- Assessment of groundwater quality for drinking purpose in rural areas surrounding a defunct copper mine. Aquat. Procedia. 2015;4:685-692.
- [CrossRef] [Google Scholar]
- APHA, 2005. Standard Methods for the Examination of Water and Wastewater, twentyfirst Edition, American Public Health Association/American Water Works Association/Water Environment Federation, Washington DC.
- Using multivariate statistical analysis, geostatistical techniques and structural equation modeling to identify spatial variability of groundwater quality. Water Resour. Manage.. 2015;29(6):2073-2089.
- [Google Scholar]
- Evaluation of groundwater quality and its suitability for drinking and irrigation using GIS and geostatistics techniques in semiarid region of Neyshabur, Iran. Appl. Water Sci.. 2018;8:168.
- [CrossRef] [Google Scholar]
- BRGM, 1976. Hydrogeological Investigations of the Al Wasia Aquifer in the Eastern Province of Saudi Arabia; Ministry of Agriculture and Water, Water Resources Development Department: Riyadh, Saudi Arabia, p. 109.
- Climate change and water scarcity: the case of Saudi Arabia. Ann. Glob. Health 2015
- [CrossRef] [Google Scholar]
- Groundwater quality patterns and spatiotemporal change in depletion in the regions of the Arabian shield and Arabian Shelf. Arab. J. Sci. Eng.. 2020;45:341-350.
- [CrossRef] [Google Scholar]
- Groundwater quality evaluation for drinking and irrigation uses in Dayrout city Upper Egypt. Ain Shams Eng. J.. 2021;12(1):327-340.
- [CrossRef] [Google Scholar]
- Glover, C., 1996. Irrigation water classification systems. Cooperative Extension Service. College of Agriculture and Home Economics, New Mexico State University.
- Optimal aquifers and reservoirs for CCS and EOR in the Kingdom of Saudi Arabia: an overview. Arab. J. Geosci.. 2016;9(12)
- [CrossRef] [Google Scholar]
- Keller, M., Bohnsack, D., Koch, R., Hinderer, M., Hornung, J., Al Ajmi, H., Amarah, B.A, 2019. Outcrop Analog Studies of the Wasia-Biyadh and Aruma Aquifers in the Kingdom of Saudi Arabia. In: AlAnzi, H.R., Rahmani, R.A., Steel, R.J., Soliman, O.M. (Eds.) Siliciclastic reservoirs of the Arabian plate: AAPG Memoir 116, pp. 317–382.
- Khogali, A., Birkle, P., Al-Shaibani, A., Keller, M., Tawabini, B., Makkawi, M., 2020. Geochemical Assessment of Potential Sources for Nitrate in the Wasia Aquifer, Al Kharj Area, Central Saudi Arabia. Water, 12(5), 1479. MDPI AG. Retrieved from https://doi.org/10.3390/w12051479.
- Multivariate statistical analysis to identify the major factors governing groundwater quality in the coastal area of Kimje, South Korea. Hydrol Process.. 2005;19(6):1261-1276.
- [Google Scholar]
- Implementation and evaluation of multivariate analysis for groundwater hydrochemistry assessment in arid environments: a case study of Hajeb ElyounJelma, Central Tunisia. Environ. Earth Sci.. 2013;70:2215-2224.
- [Google Scholar]
- Evaluation of groundwater quality for drinking purpose for tikrit and samarra cities using water quality index. Eur. J. Sci. Res.. 2011;58:472-481.
- [Google Scholar]
- Assessment of groundwater quality in Khulna city of Bangladesh in terms of water quality index for drinking purpose. Appl. Water Sci.. 2020;10(11)
- [CrossRef] [Google Scholar]
- User's guide to PHREEQC version 3 - a computer program for speciation, batch reaction, one-dimensional transport, and inverse geochemical calculations. USGS. 1999
- [Google Scholar]
- Multivariate statistics: An approach for Water quality assessment. LAP LAMBERT Academic Publishing; 2012.
- Assessment of groundwater quality for irrigation use: a peninsular case studyApplied Water. Science. 2018;8(8)
- [CrossRef] [Google Scholar]
- Quantifying renewable groundwater stress with GRACE. Water Resour. Res.. 2015;51
- [CrossRef] [Google Scholar]
- Hydrogeochemical processes operating within the main aquifers of Kuwait. J. Arid Environ.. 1999;42:195-209.
- [Google Scholar]
- SASO, 2000. Saudi standards, metrology and quality, unbottled drinking water 701, p. 9.
- GIS and geostatistical techniques for groundwater science. Elsevier; 2019.
- Water quality assessment of a tropical river using water quality index (WQI), multivariate statistical techniques and GIS. Appl. Water Sci.. 2019;9(7)
- [Google Scholar]
- Prediction of the sodium absorption ratio using data-driven models: a case study in Iran. Geol. Ecol. Landscapes. 2019;4(1):1-10.
- [CrossRef] [Google Scholar]
- Evaluation of groundwater quality for suitability of irrigation purposes: a case study in the Udham Singh Nagar. Uttarakhand. J. Chem.. 2020;2020:15. (Article ID 6924026)
- [CrossRef] [Google Scholar]
- Groundwater Hydrology. Wiley India Pvt Ltd; 2018.
- Water quality evaluation of Ekulu river using Water Quality Index (WQI) J. Environ. Stud.. 2019;5(1):1-4.
- [Google Scholar]
- Uitto, J.I., Schneider, J., 1997. Freshwater resources in arid lands. In: UNU global environmental forum V, United Nation University Headquarters, Tokyo, 13 June 1996.
- WHO, 2011. Guidelines for drinking-water quality, fourth edn. WHO, Geneva.
- Analysis of groundwater quality using multivariate and spatial analyses in the Keta Basin, Ghana. J. Afr. Earth Sci.. 2010;58(2):220-234.
- [Google Scholar]
- Evaluation of groundwater chemistry and its impact on drinking and irrigation water quality in the eastern part of the Central Arabian graben and trough system, Saudi Arabia. J. Afr. Earth Sc.. 2016;120:208-219.
- [CrossRef] [Google Scholar]
Appendix A
Supplementary material
Supplementary data to this article can be found online at https://doi.org/10.1016/j.jksus.2023.102847.
Appendix A
Supplementary material
The following are the Supplementary data to this article:Supplementary data 1
Supplementary data 1
Showing the hydrochemical data for the 30 groundwater samples in the study area with the ionic balance errors.


