

Translate this page into:
Assessment of supplied water quality during mass gatherings in arid environments
⁎Corresponding author at: Department of Environmental Engineering, Umm Al-Qura University, Makkah 21955, Saudi Arabia. agothman@uqu.edu.sa (Abdullah Othman)
-
Received: ,
Accepted: ,
This article was originally published by Elsevier and was migrated to Scientific Scholar after the change of Publisher.
Peer review under responsibility of King Saud University.
Abstract
Mass gathering events commonly encounter environmental challenges that necessitate assurance of water quality and food security. The current outbreak of the coronavirus disease 2019 (COVID-19) call for maintaining safe drinking water supply and providing assessment tools of drinking water quality to avoid contamination in water sources or distribution networks. Arid environmental conditions also add more stress on supplied water to mass gathering events. Herein, we assess the quality of the water supply (desalinated 95% and groundwater 5%) in Makkah city, Saudi Arabia during a mass gathering event in 2019 (9.6 million people) for religious purposes. Fifty five samples were randomly collected from nine different districts of Makkah city, analyzed for TDS, turbidity, pH, EC, free Cl2, Al, Cd, Pb, Cr, F, major ions, coliform and E.coli bacteria and were finally used to estimate the water quality index (WQI). Major ions, trace elements and heavy metals analyses show values below permissible limits in most of the samples, while a few samples show slightly higher values. No bacterial count found in any sample. WQI values of all fifty-five samples were below 50 and were identified as “excellent water”. The WQI variations could be attributed to the distribution network conditions rather than a direct impact of adding groundwater with uncontrolled chemical composition. The use of WQI to report the quality of water during mass gathering events to governmental authorities has been proved to be beneficial and should be applied for further mass gathering events worldwide.
Keywords
Water quality index
Mass gathering
Physico-chemical
Fecal coliform
Arid conditions

1 Introduction
Mass gathering is defined as the gathering of a large group of people at a specific location for a specific purpose over a defined period regardless of the gathering size and the number of people (World Health Organization (WHO), 2017). Managing mass gathering events is a complex process that requires advanced risk assessment to predict and mitigate potential natural and man-induced risks (Memish et al., 2019). Assurance of the quality of supplied water is crucial for public health during mass gathering events (Nalatambi, 2009). During these events, there should be adequate water supply to meet the demands of high-water usage. Yet, drinking water supply problems have been reported from numerous mass gathering events either because of the profit mentality of the organizers (Milsten et al., 2002), which limits the quantity of supplied water or due to water contamination issues, which degrade the supplied water quality (Hoang and Gautret, 2018). Contamination of drinking water could occur in the water sources (e.g. desalination plants, treatment stations or aquifers) or within the distribution networks (e.g. pipes, valves, pumps, storage tanks and reservoirs) (Liu et al., 2017). Currently, the assurance of clean water supply for drinking and sanitation became more necessary than ever for protecting human health during infectious disease outbreaks, particularly coronavirus disease 2019 (COVID-19).
In arid and hyper-arid areas, the efforts to assess the quality and the quantity of water resources have been considered a priority to secure the water supply (Abdelmohsen et al., 2019; Abdelmohsen et al., 2020; Abdelmalik and Abdelmohsen, 2019; El-Saadawy et al., 2020; Abotalib et al., 2021). In the Kingdome of Saudi Arabia (KSA), particularly in Makkah city, numerous religious mass gathering events occur yearly including the Hajj and Umrah events, especially Umrah events during Ramadan month, the ninth month in the Hijri calendar. Under the current arid conditions, which prevail the Arabian Peninsula (Othman and Abotalib, 2019; Abotalib et al., 2019), the average demand for drinking water in mass gathering events in KSA is expected to be higher than that in temperate areas. Additionally, many of the pilgrim’s buildings (e.g. hotels and residential premises) may have independent water supplies. Therefore, it is necessary to examine the water quality during mass gathering events on frequent systematic and random bases to assure safe water supply using widely accepted standard characteristics. Water quality control procedures include physiochemical and biological aspects and are used to define whether the supplied water meet specific standards (Elkadiri et al., 2016; Attwa et al., 2021; Khalil et al., 2021). The occurrence of chemical and biological contaminants in the water above the permissible limit may cause adverse effects on the human health (World Health Organization (WHO), 2017). The total coliform bacteria analysis is the most basic test to examine bacterial contamination of drinking water. Ideally, drinking water should be clean with regard to fecal bacteria and with zero concentration of any pathogenic microorganisms (World Health Organization (WHO), 2017). Therefore, the total coliform counts can give a direct indication on the contamination of water supply from septic tanks, where Escherichia coli (E. coli) bacteria is the species of coliform bacteria that indicate fecal pollution (World Health Organization (WHO), 2017). The physiochemical quality of water such as turbidity, color, taste, and odor also affect its acceptability to consumers (Zacheus and Martikainen, 1997). Moreover, the concentration of heavy metals (e.g. arsenic [As], boron [B], cadmium [Cd] and lead [Pb]) in drinking water affects its quality and acceptability for use and hence accurate estimates of their concentration in drinking water should be monitored (Jia et al., 2010; Mora et al., 2017). The water quality index (WQI) is an effective tool, which provides a performance measurement that enable the interpretation of water quality in a simple format (Horton, 1965). Different methods of estimating WQI are widely used to assess the suitability of surface and groundwater for different purposes (e.g. drinking, irrigation and industrial activities), including either conceptual quality units (Liou et al., 2004) or arithmetical methods. The later include, for example, weighted averaging methods, weighted geometric means and minimum operator’s method (Smith, 1990; Pesce and Wunderlin, 2000).
Even though WQI methods are commonly utilized to interpret water quality in different settings, there is little information about water quality during mass gathering events under arid conditions. To address this deficiency, the study aims to systematically assess the supplied water quality in residential premises during a mass gathering event in Makkah city during Ramadan month, the ninth month in the Hijri calendar (i.e. May 5th to June 3rd, 2019) using physiochemical and bacteriological characteristics of collected water samples and estimated WQI. The intention is to provide a random assessment of the quality of supplied water for pilgrims that benefits the concerned authorities regarding water management policies during mass gathering events in KSA and during similar events worldwide.
2 Physical setting and mass gathering events in Makkah
Similar to any other arid region, KSA also faces water scarcity with limited renewable water supplies. The spatiotemporal variability in precipitation over KSA between 1978 and 2009 indicated two rainfall trends during the investigated period: (1) moderate increase in rainfall with 13.9 mm per decade during the period between 1978 and 1995 and (2) major decrease in rainfall of 47.8 mm per decade from 1996 to 2009 (Almazroui et al., 2012). Conversely, the average air temperature showed a consistent increasing trend for the similar period of 0.6 °C per decade (Almazroui et al., 2012). Makkah city (Fig. 1) is the secrete city for approximately two billion Muslims around the world (Hodges, 2018) and it hosts millions of visitors throughout the year, suffers from shortage of natural water resources and only 3 to 5 % of the supplied water are groundwater compared to 95 to 97 % of desalinized water (Al-Omran et al., 2015). With the limited water resources and constantly increasing temperature (Almazroui et al., 2012), the water consumption demand for water in Makkah significantly increased from 600 × 106 m3 to 840 × 106 m3 between 2011 and 2019, respectively (MOWE, 2015; MEWA, 2019). Similarly, the groundwater input to the domestic water supply system in Makkah region increased from 7 × 10⁶ m3 in 2016 to 29 × 106 m3 in 2019, respectively (MOWE, 2015; MEWA, 2019) (Fig. 2). Therefore, the amount of uncontrolled addition of minerals and elements to the domestic water supply system would increase with increasing the share of the groundwater component to the system. Groundwater extraction is mainly from alluvium aquifers within the valleys such as Wadi Rahjan, Wadi Al-Qushashiyah, Wadi Noman valley and Wadi Bany Omair (Ghulman et al., 2008), which drain the crystalline basement rocks surrounding Makkah city. Under such arid conditions and scarcity of water resources, supplied water to mass gathering events should be examined for quality control.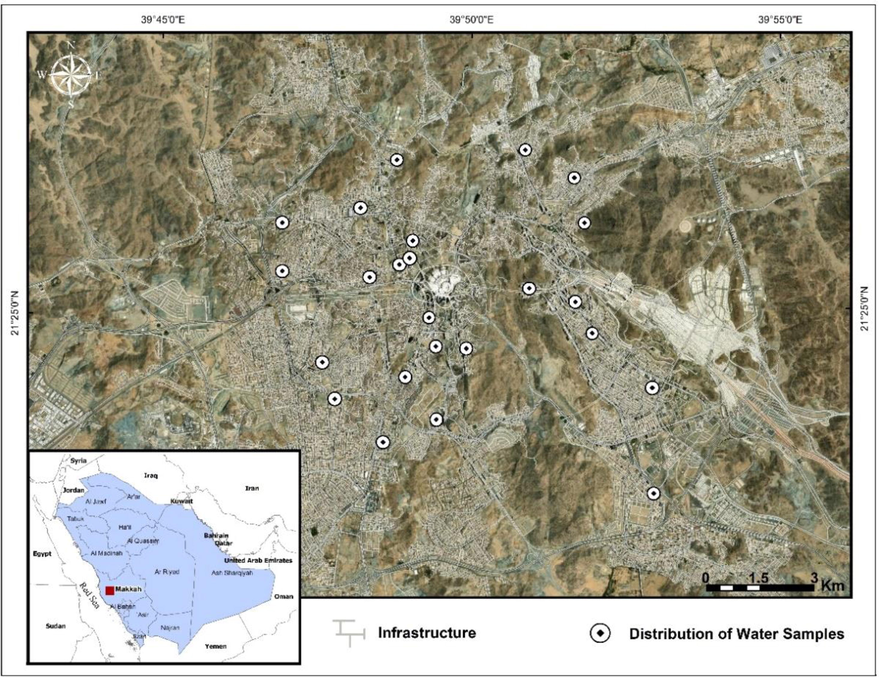
Location map showing the geospatial location of Makkah city and the distribution of randomly collected water samples.
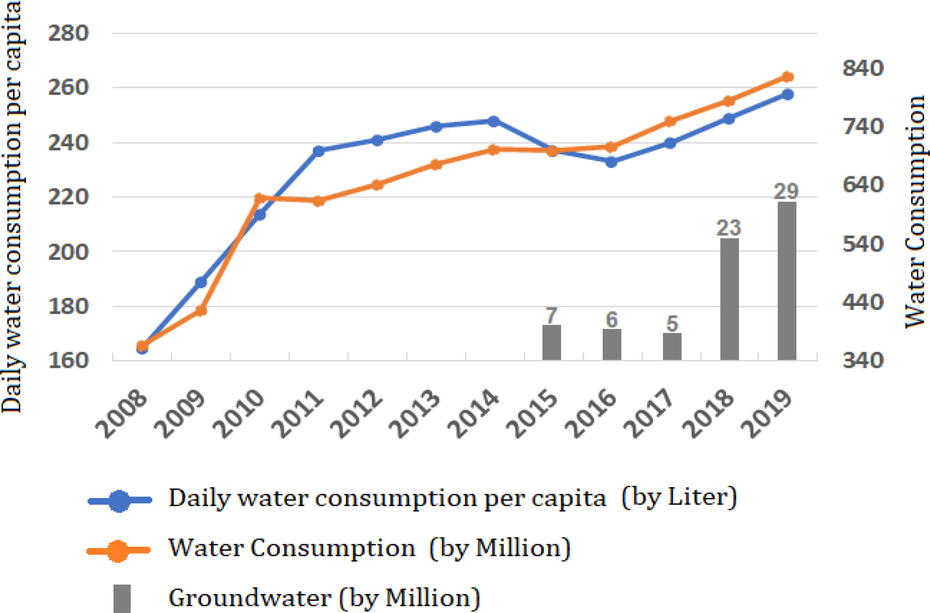
Time series of the water consumption in Makkah region showing the significant increase of water consumption and groundwater input to the domestic water supply system between 2008 and 2019 (data).
Source: MOWE, 2015; MEWA, 2019
Inspection of the monthly numbers of pilgrims and populations (provided by the Custodian of the Two Holy Mosques Institute for Hajj and Umrah Research) together with the monthly average air temperature from 10 meteorological stations (provided by the Climate and Meteorology Research Unit, Department of Environmental and Health Research, Umm Al-Qura University) in Makkah city during the Hijri year 1440 (i.e. September 2018 to August 2019) (Fig. 3) indicates that the monthly pilgrims and population number ranged between 2. 08 million during the month of Dhul Qi'dah, the eleventh month of the Hijri Calendar, to 9.6 million during the month of Ramadan. Moreover, the annual air temperature ranged from 24.9 °C during the month of Jumada Al-Akhirah, the fourth month of the Hijri Calendar, to 37.3 °C during the month of Shawwal, the tenth month of the Hijri Calendar. It is also shown that the month of Ramadan 2019 witnessed the largest crowed under relatively high temperature ∼ 34.1. One would expect that the highest stress on water resources would be during this month, which would consequently endanger the quality of drinking water supply to the pilgrims. For this reason, we collected water samples from individual residential premises in areas that accommodate most of the visitors in Makkah city during Ramadan 2019 to assess the quality of water supply to pilgrims.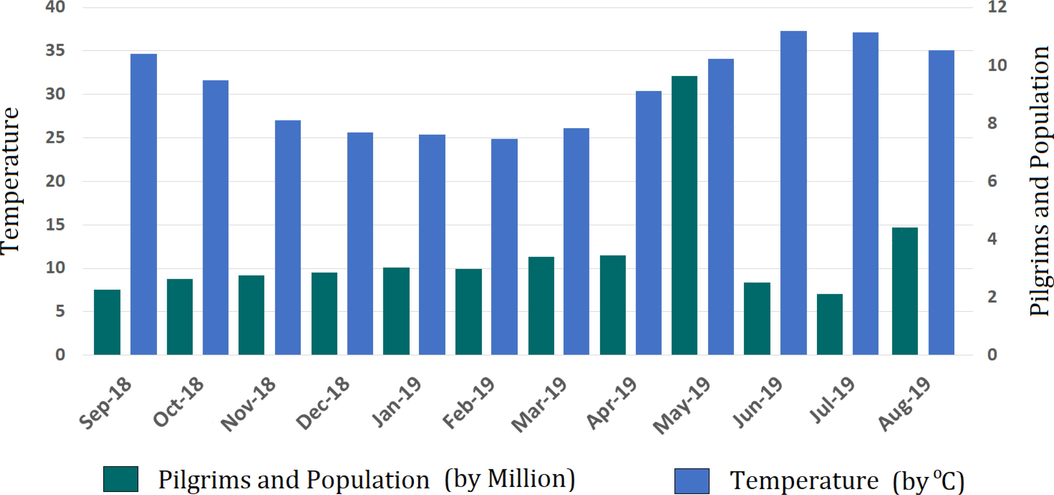
The correlation between monthly numbers of pilgrims and population and average monthly temperature in Makkah city during the month of Ramadan 1440.
3 Materials and methods
3.1 Water sampling procedures and chemical and bacteriological analyses
Fifty-five samples (representing 55 residential premises) were randomly collected from Makkah city, which represent the ninth residential districts in the city (Fig. 1), during Ramadan, 1440 Hijri calendar (May to June 2019). The benchmarks of the sample locations were created on the basis of pilgrims availability in the buildings, districts, and distance for center of the city. Municipality supplied water to Makkah city is desalinated water mixed with groundwater. Every sampled residential premise has private underground and overhead water storage units. Sample collection form was used to get onsite information about samples and sampling locations. The samples were collected in 500 ml sterile polypropylene bottles directly from the source. In each sample location two sampling bottles were collected for both chemical and bacteriological analyses. Polypropylene bottles were washed by deionized distilled water and then sterilized using autoclave. Before collection, every sample bottle was twice rinsed by the sample water. Collected samples were transferred in an icebox to the Microbiology Laboratory in the Department of Environmental and Health Research, Umm Al Qura University, where the analyses took place. For chemical analysis, pH and electrical conductivity were measured by electrochemical bench meter (model: Thermo Scientific- Orion Star). The samples were acid digested (APHA, 1998) and micro-filtered for heavy metals and ionic analysis, respectively (AL-Omran et.al. 2015). Heavy metals such as Pb, Cd, Cr, and Al and ions such as F-, Cl-, NO3–, SO4-2, Na+, K+, Mg+2, Ca+2 were conducted using Thermo Scientific iCE 3000 atomic absorption spectrometer (AAS) and 850 professional IC-type ion chromatograph produced by Metrohm, respectively. E. coli and Coliform bacteria count were determined in the samples using probable number method (MPN) of coliform bacteria. The number of total coliforms and E. coli per 100 ml is mainly based on the number of positive samples counted and it was determined by using the Colilert test (IDEXX, United States) according to manufacturer instructions.
3.2 Quality control (QC) and quality assurance (QA).
All glassware was washed with detergents, then rinsed with 10% Nitric acid and in last three time rinsed with deionized distilled water. Analytical grade chemicals were used throughout the digestion and analysis. Calibration standards were made by the dilution of Certified Reference Solution (1000 ppm and 100 ppm) from Merck. Deionized distilled water (resistivity of 18.2 Ω) was used for dilution and solution preparations. After every 10th sample, working standard were analyzed (Khanoranga and Khalid. 2019).
3.3 Water quality index (WQI)
The collective influence of various water quality parameters in drinking water is known as the WQI (Sahu and Sikdar, 2008). The calculation of WQI involves five steps as follows: (1) assigning weight (wi), (2) relative weight (Wi), (3) quality rating (qi), (4) sub-index (SI) and (5) summation of sub-index (WQI) (Anwar et al., 2015; Ewaid and Ali, 2017). To calculate the WQI of drinking water, each parameter (ion or atom) was allocated by a certain numeric value, i.e. assigning weights (wi), in a range of 1 (least) to 5 (highest). The ranking is based on the parameter significance to the water quality, where the maximum weight of “5″ was designated to the most significant parameters (Table 1) (Yidana and Yidana, 2010; Varol and Davraz, 2015). Second, the relative weight (Wi) of the chemical parameter was computed by using equation (1):
Parameter
Weights (wi)
Relative weight (Wi)
pH
3
0.045
TDS
4
0.061
Turbidity
3
0.045
Free Cl
4
0.061
Na+
3
0.045
Ca+
2
0.030
Mg2+
2
0.030
K+
2
0.030
Cl-
4
0.061
SO4-2
5
0.076
NO3–
5
0.076
F-
5
0.076
Cd
5
0.076
Cr
5
0.076
Pb
5
0.076
Al
4
0.061
where, Wi = relative weight, wi = weight of parameter, n = number of parameters. Third, the quality rating (qi) of each parameter was estimated using equation (2):
where, qi = quality rating, Ci = concentration (mg/L) of respective parameter in each water sample, Si = drinking water standard (mg/L), as per international guidelines (World Health Organization (WHO), 2017). Fourth, sub index of the ith parameter (SIi) was calculated for each parameter using equation (3):
Where, SIi = sub-index of ith parameter. Finally, sum of the sub-index of all analyzed parameters was estimated using equation (4):
WQI estimation in the present study was based on 16 different parameters, which are displayed in Table 1 together with their assigned and relative weights. Table 2 represents the water quality classification based on WQI values (Anwar et al., 2015; Şener et al., 2017).
WQI Range
Class
Type of water
<50
I
Excellent water
50.1–100
II
Good water
100.1–200
III
Poor Water
200.1–300
IV
Very poor water
>300
V
Water unsuitable for drinking
4 Results and discussion
4.1 Chemical and bacteriological analyses
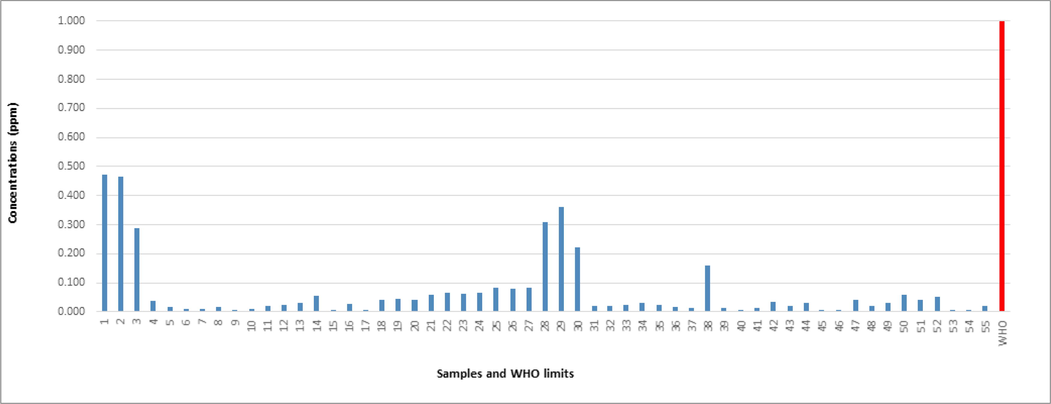
Inspection of the physiochemical and bacteriological properties of the analyzed samples (Suppl.Table. 1) shows that the pH values of the samples are within the range 4.99 to 8.34, where all samples fall within the recommended range for drinking water (EPA, 2018). Similarly, the turbidity, free Cl and total dissolved solids (TDS) concentrations are in the permissible levels for drinking waters (World Health Organization (WHO), 2017; EPA, 2018). Average values of all ions (Li+, Na+, K+, Mg2+, Ca2+, F-, Cl-, Br– SO4-, NO3−) and metals (AL, Cd, Pb, Cr) show acceptable ranges according to the WHO standards for drinking water (Suppl.Table. 2). Figs. 4-7 represent the concentration of analyzed heavy metals and ions. However, samples that are collected from tanks where desalinated waters are mixed with groundwater (e.g. 1, 2, 10, 14 and 22) show relatively higher concentrations compared to those collected from solely desalinated water sources. Moreover, trace elements such as Li, Br and F show acceptable ranges below the recommended standards (i.e. 0.7 mg/l, 0.5 mg/l and 1.5 mg/l for Li, Br and F, respectively (World Health Organization (WHO), 2017; EPA, 2018). Although, the desalinated portion of supplied water (i.e. ∼ 95 %) has controlled mineral composition, yet, the groundwater portion of the supplied water (i.e. usually 5%, which increases during mass gathering events) has uncontrolled natural minerals. Therefore, groundwater input could affect the concentration of major ions and trace elements (e.g. Fluoride (AlMulla et al., 2016), where minerals like fluorite, apatite, mica, amphiboles, and villiamite in the crystalline rocks may affect the fluoride concentration in groundwater (Raju and Ram, 2009). This was not the case in the analyzed samples, where all major ions and trace elements fall below the permissible level for drinking water.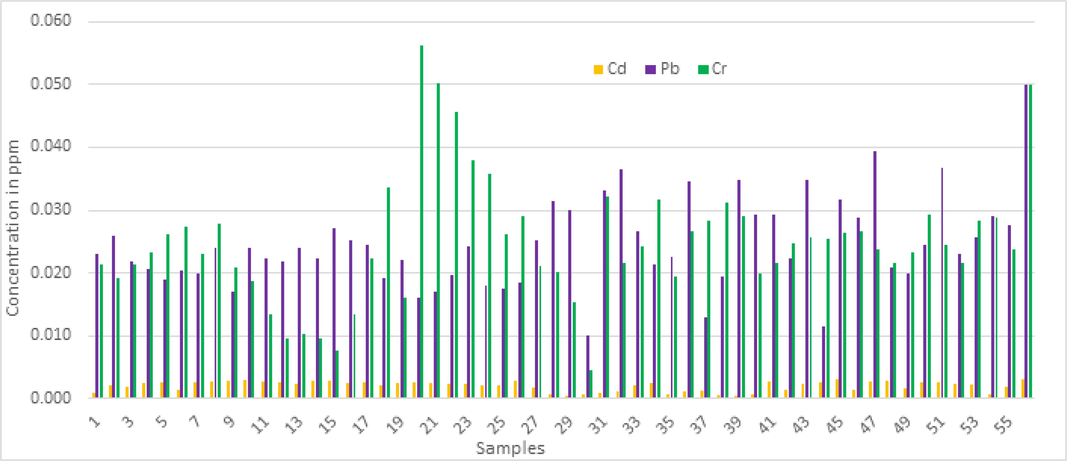
Concentration (ppm) of analyzed heavy metals (Cd, Cr, Pb).
Concentration (ppm) of analyzed heavy metal (Al).
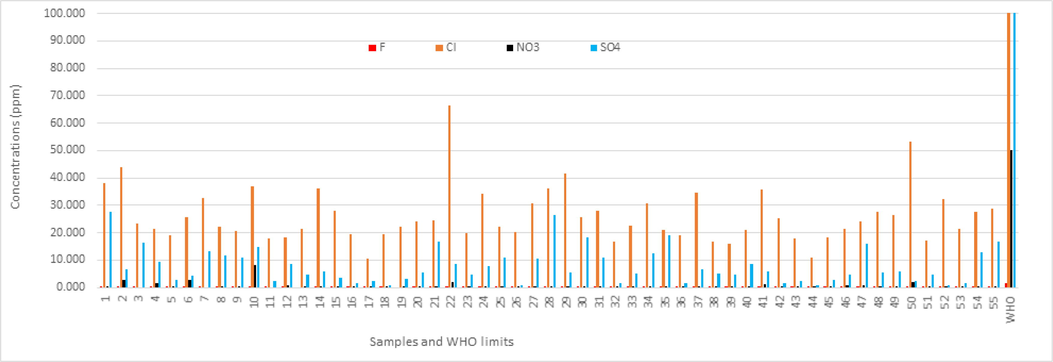
Concentration (ppm) of analyzed anions.
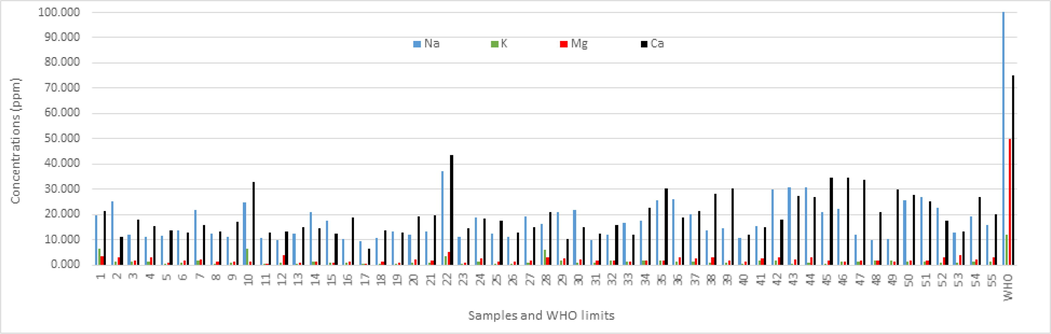
Concentration (ppm) of analyzed cations.
The concentrations of heavy metals (Fig. 4) show that Pb and Cd concentrations are below the permissible levels defined by WHO (2017) and EPA (2018) for drinking water quality criteria (i.e. 0.05 and 0.03 mg/l, respectively) in all samples. Al (Fig. 5) and Cr (Fig. 4) concentrations are also below the permissible levels defined by WHO (2017) and EPA (2018) for drinking water quality criteria (i.e. 0.2 and 0.05 mg/l, respectively) for the majority of the samples (i.e. 24 samples for Al and 26 samples for Cr), while a few samples (i.e. three samples for Al and one sample for Cr) show slightly higher concentrations.
All sample show zero count of E. coli and fecal coliform.
4.2 Correlation of water quality parameters
Linear relationship between the parameters of water quality has been estimated using the correlation coefficient (r), which defines the connection between all these variables. Coefficient values close to + 1 or −1 show the perfect linear correlation within the variables (Al-Omran et al., 2015). The correlation coefficient between all variables (Suppl.Table. 3) indicates that the TDS values show positive correlation with Cl-, SO4-2, Na+, K+, Mg+2, and Ca+2. Al shows positive correlation with SO4-2, K+ and Mg+2. Cl- shows positive correlation with Na+, K+ and Mg+2. SO4-2 shows positive correlation with K+, Mg+2 and Ca+2 and Mg+2 shows correlation with Ca+2. Given the controlled portions of salts and minerals that usually being added during the desalination process, correlation between these variables is highly expected. This high correlation suggests that adding groundwater sources does not alter the overall composition of the supplied water.
4.3 Water quality index (WQI)
The WQI calculation (Fig. 8) is based on 16 different parameters in the 55 samples (pH, TDS, Free Cl2, turbidity, F-, Cl-, NO3−, SO4-2, Na+, K+, Mg+2, Ca+2, Al, Cd, Cr and Pb). WQI in all analyzed samples attain WQI < 50 and are located in Class I category with excellent quality. Variation in WQI values between 15.158 and 49.472 (28.186 mean) can be attributed to water storage and piping conditions rather than due to addition of groundwater. Samples with significant groundwater addition do not show significantly higher WQI compare to other samples where the water is totally supplied from desalination plants.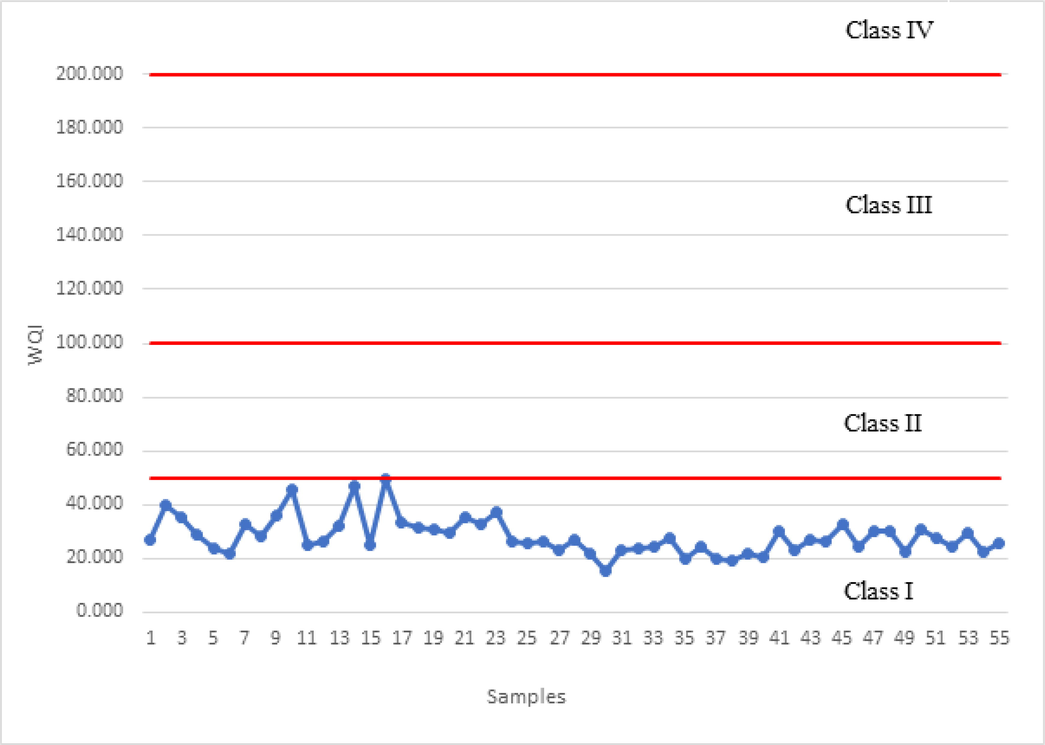
Water quality index (WQI) values of water samples.
The study has demonstrated that there is an accepted quality of water supply at the examined localities during the Umrah event of 2019. (Apparently, the quality of the supplied water to the mass gathering has not been affected by the strength or the duration of the event and satisfied the drinking water standards.
5 Conclusion
Assessment of the WQI during a mass gathering event and sever climatic aridity in Makkah city during the summer of 2019 indicates that the supplied water for domestic purposes is in a good quality. The majority of the analyzed samples show values below permissible limits for drinking water quality, while a few samples showed slightly higher values that do not affect the overall quality of the samples. All Fifty-five samples show excellent WQI values. Slight variations in the WQI values are likely related to water storage and pipeline conditions rather than an impact of adding groundwater with uncontrolled mineral content to the system. Our study recommends that regular cleaning of water storage tanks and taps and periodical inspection of water quality is sufficient to maintain the high quality of available water supply for the residents of Makkah city or during mass gathering events.
Acknowledgements
The authors would like to thank the Umm Al-Qura University for facilitation and their logistical and field support. The authors are grateful for the constructive comments by the reviewers, which greatly improved the overall quality of the paper.
Disclosure of Funding
This research did not receive any specific grant from funding agencies in the public, commercial, or not-for-profit sectors.
Declaration of Competing Interest
The authors declare that they have no known competing financial interests or personal relationships that could have appeared to influence the work reported in this paper.
References
- GRACE and TRMM mission: the role of remote sensing techniques for monitoring spatio-temporal change in total water mass, Nile basin. Journal of African Earth Sciences. 2019;160:103596.
- [CrossRef] [Google Scholar]
- What can the GRACE seasonal cycle tell us about lake-aquifer interactions? Earth-Science Reviews. 2020;211:103392.
- [CrossRef] [Google Scholar]
- Response of deep aquifers to climate variability. Science of the Total Environment. 2019;677:530-544.
- [Google Scholar]
- Groundwater mounding: A diagnostic feature for mapping aquifer connectivity in hyper-arid deserts. Science of The Total Environment. 2021;801:149760.
- [CrossRef] [Google Scholar]
- Groundwater dynamics in fossil fractured carbonate aquifers in Eastern Arabian Peninsula: A preliminary investigation. Journal of Hydrology.. 2019;571:460-470.
- [Google Scholar]
- A. Al-Omran F. Al-Barakah A. Altuquq A. Aly Drinking water quality assessment and 2015 water quality index of Riyadh, Saudi Arabia. Water Quality Research Journal of Canada. 50, 287-296.
- Recent climate change in the Arabian Peninsula: seasonal rainfall and temperature climatology of Saudi Arabia for 1979–2009. Atmospheric Research. 2012;111:29-45.
- [Google Scholar]
- Fluoride content of bottled drinking waters in Qatar. Biological trace element research. 2016;174(2):471-476.
- [Google Scholar]
- American Public Health Association (APHA). 1998. Standard Methods for the Examination of Water and Wastewater. Washington DC. USA.
- The water quality index and hydrochemical characterization of groundwater resources in Hafar ALbatin. Saudi Arabia. Arabian Journal of Geosciences.. 2015;8:4177-4190.
- [Google Scholar]
- Toward an integrated and sustainable water resources management in structurally-controlled watersheds in desert environments using geophysical and remote sensing methods. Sustainability. 2021;13(7):4004.
- [Google Scholar]
- Development of a coupled spatiotemporal algal bloom model for coastal areas: A remote sensing and data mining-based approach. IEEE Journal of Selected Topics in Applied Earth Observations and Remote Sensing. 2016;9(11):5159-5171.
- [Google Scholar]
- Modeling flash floods and induced recharge into alluvial aquifers using multi-temporal remote sensing and electrical resistivity imaging. Sustainability. 2020;12(23):10204.
- [Google Scholar]
- Water quality index for Al-Gharraf River, sourthen Iraq. The Egyptian Journal of Aquatic Research.. 2017;43:117-122.
- [Google Scholar]
- EPA (Environmental Protection Agency), 2018. Storage and retrieval and water quality exchange (US EPA) Available at https://www.epa.gov/ waterdata/storage-and-retrieval-and-water-quality-exchange .
- Ghulman, B.A., EL-Bisy, M.S. and Ali, H., 2008. GROUNDWATER ASSESSMENT OF MAKKAH AL-MOKARAMA. In Twelfth International Water Technology Conference, IWTC12.
- Infectious diseases and mass gatherings. Current infectious disease reports. 2018;20(11):44.
- [Google Scholar]
- Reclaiming “Allahu Akbar” from Semantic Pejoration. Anthropology News. 2018;59(4):e267-e272.
- [Google Scholar]
- An index number system for rating water quality. Journal of Water Pollution Control Federation. 1965;37(3):300-306.
- [Google Scholar]
- Testing and analysis of drinking water quality in the rural area of High-tech District in Tai'an City. Journal of Agricultural Science. 2010;2(3):155-157.
- [Google Scholar]
- Groundwater Mixing in Shallow Aquifers Stressed by Land Cover/Land Use Changes Under Hyper-arid conditions. Journal of Hydrology. 2021;598:126245.
- [CrossRef] [Google Scholar]
- An assessment of groundwater quality for irrigation and drinking purposes around brick kilns in three districts of Balochistan province, Pakistan, through water quality index and multivariate statistical approaches. Journal of Geochemical Exploration. 2019;197:14-26.
- [Google Scholar]
- A generalized water quality index for Taiwan. Environmental Monitoring and Assessment. 2004;96(1-3):35-52.
- [Google Scholar]
- Potential impacts of changing supply-water quality on drinking water distribution: A review. Water research. 2017;116:135-148.
- [Google Scholar]
- Mass gatherings medicine: public health issues arising from mass gathering religious and sporting events. The Lancet. 2019;393(10185):2073-2084.
- [Google Scholar]
- MEWA., 2019. Annual report and statistics of the Ministry of Environment Water and Agriculture. Riyadh, Saudi Arabia.
- MOWE., 2015 The annual report and statistics of the Ministry of Water and Electricity (MOWE). Riyadh, Saudi Arabia.
- Mass-gathering medical care: a review of the literature. Prehospital and disaster medicine. 2002;17(3):151-162.
- [Google Scholar]
- Assessment of major ions and trace elements in groundwater supplied to the Monterrey metropolitan area, Nuevo León. Mexico. Environ Monit Assess.. 2017;189:394.
- [Google Scholar]
- Determination of metals in tap water using atomic absorption spectrometry: a case study in Bandar Sunway residential area. Sunway academic journal. 2009;6:33-46.
- [Google Scholar]
- Land subsidence triggered by groundwater withdrawal under hyper-arid conditions: case study from Central Saudi Arabia. Environmental Earth Sciences. 2019;78(7):243.
- [Google Scholar]
- Use of water quality indices to verify the impact of Córdoba City (Argentina) on Suquı́a River. Water research. 2000;34(11):2915-2926.
- [Google Scholar]
- Raju N J, Ram P, dey S. 2009. Groundwater Quality in the Lower Varuna River Basin, Varanasi District, Uttar Pradesh. Journal of the Geological Society of India. 73 (2)178-192.
- Hydrochemical framework of the aquifer in and around East Kolkata Wetlands, West Bengal. India. Environmental Geology.. 2008;55:823-835.
- [Google Scholar]
- Evaluation of water quality usingwater quality index (WQI) method and GIS in Aksu River (SW-Turkey) Science of the Total Environment.. 2017;584–585:131-144.
- [Google Scholar]
- A better water quality indexing system for rivers and streams. Water Research. 1990;24(10):1237-1244.
- [Google Scholar]
- Evaluation of the groundwater quality with WQI (Water Quality Index) and multivariate analysis: a case study of the Tefenni plain (Burdur/Turkey) Environmental Earth Sciences.. 2015;73:1725-1744.
- [Google Scholar]
- Guidelines for drinking-water quality: first addendum to the (fourth edition). Geneva: Switzerland; 2017.
- Assessing water quality using water quality index and multivariate analysis. Environmental Earth Sciences.. 2010;59(7):1461-1473.
- [Google Scholar]
- Physicochemical quality of drinking and hot waters in Finnish buildings originated from groundwater or surface water plants. Science of the total environment. 1997;204(1):1-10.
- [Google Scholar]
Appendix A
Supplementary data
Supplementary data to this article can be found online at https://doi.org/10.1016/j.jksus.2022.101918.
Appendix A
Supplementary data
The following are the Supplementary data to this article:


