

Appraisal of toxic metals in water, bottom sediments and fish of fresh water lake
⁎Corresponding author at: Department of Chemistry, College of Science, King Saud University, P.O. Box 22452, Riyadh 11451, Saudi Arabia. abeeralobaidksu@gmail.com (Abeer AlObaid)
-
Received: ,
Accepted: ,
This article was originally published by Elsevier and was migrated to Scientific Scholar after the change of Publisher.
Peer review under responsibility of King Saud University.
Abstract
Lakes are most diverse and interactive ecosystems in the world. In this study physiochemical parameters were determined of Mangla Dam Lake which is in District Mirpur Azad Jammu and Kashmir (AJK). Concentrations of heavy metals such as Cd, Cr, Cu, Mn, Ni, Pb and Zn were determined in samples of water, sediment, muscle, gills, intestine, liver, and kidneys of fish of the study area. Water samples showed average pH 7.64, Turbidity 2.59 NTU, Conductivity 461 µm/cm, TDS 205 mg/L and Salinity 0.22 mg/L. Low dissolved oxygen of 3.43 mg/L is recorded here. The analyzed data was compared with the international guidelines. In water concentration of Cd > Pb > Zn > Ni > Cr > Mn > Cu. In sediment concentration of Mn > Cr > Zn > Ni > Cu > Cd > Pb. Heavy metal concentrations decreased in muscles as Cr > Zn > Pb > Cd > Mn > Cu > Ni. In gills Zn > Cr > Pb > Mn > Cd > Cu > Ni. In intestine, Zn > Cr > Cu > Mn > Pb > Cd > Ni. In liver, Zn > Cr > Cu > Pb > Mn > Cd > Ni. In kidneys Zn > Cr > Cd > Pb > Cu > Mn > Ni.
Keywords
Heavy metals
Water bodies
Fish
Toxicity
Lake ecosystem

1 Introduction
Contamination of aquatic systems by heavy metals has become a global problem in the last decades. Heavy metals may enter aquatic systems due to different natural and anthropogenic (human activities) sources. These activities include industrial or domestic wastewater, application of pesticides and inorganic fertilizers, leaching from landfills, storm runoff, shipping and harbor activities, atmospheric deposition, and geological weathering of earth crust (Yilmaz, 2009) (Figs. 1–3).
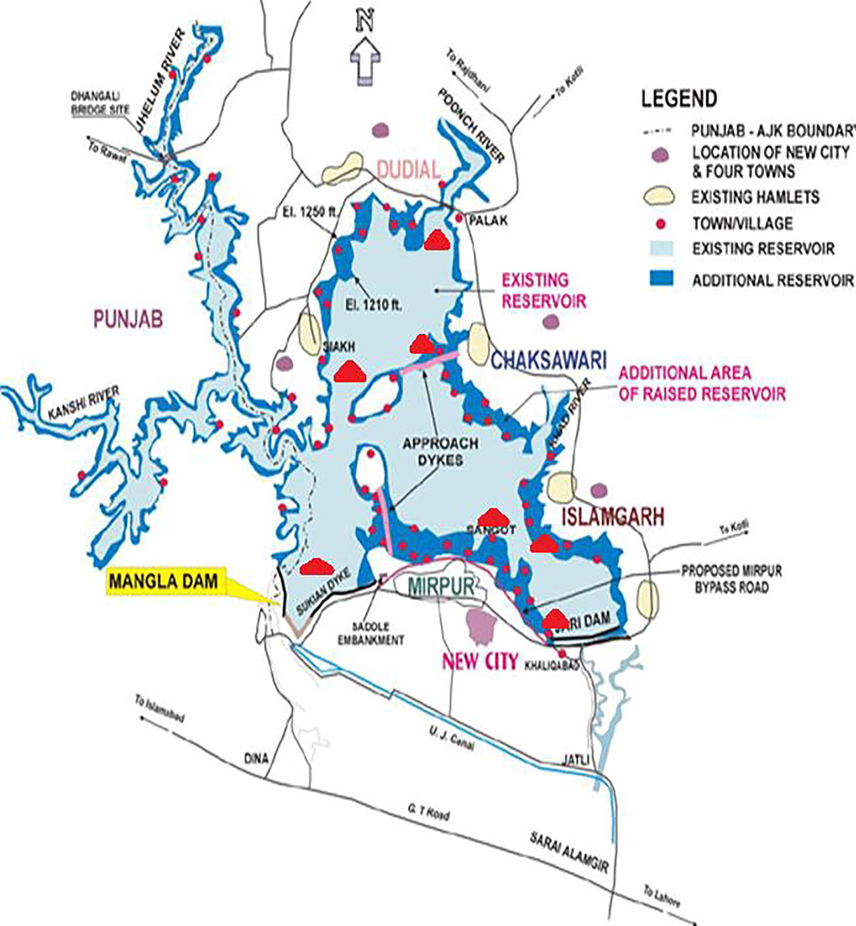
- Map of study area in District Mirpur AJK.
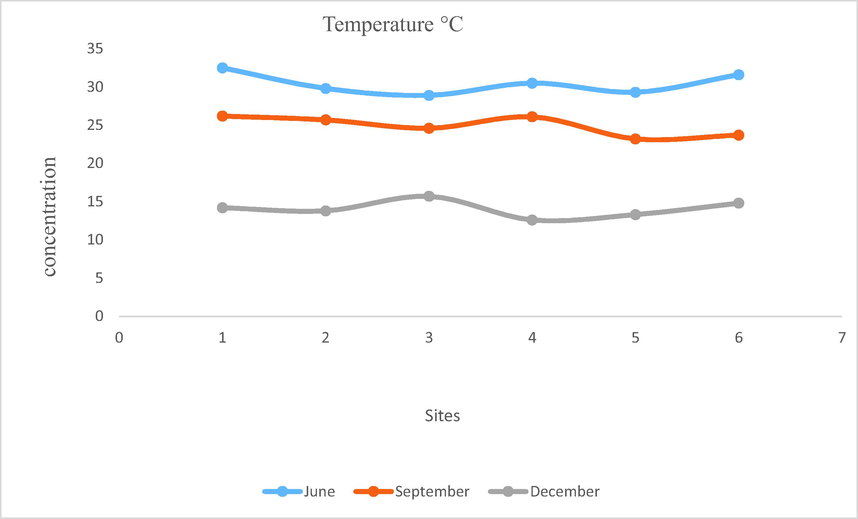
- Showing temperature of water of Mangla Dam Lake.
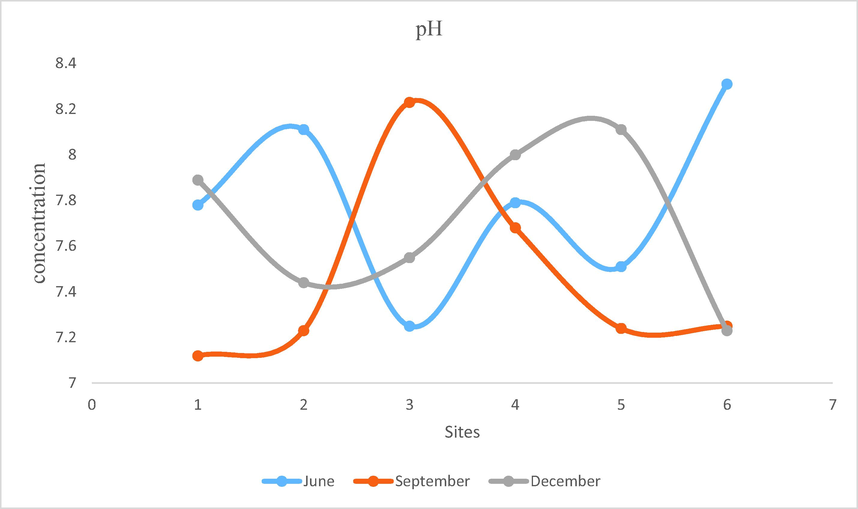
- Showing pH of water of Mangla Dam Lake.
Metals occur in low concentrations, in natural aquatic ecosystems. These metals cannot be degraded, thereby deposited, assimilated or incorporated in water, sediments and aquatic animals thus causing heavy metals pollution in water bodies (Abdel-Baki et al., 2011; Mahmood et al., 2012). The heavy metal pollution is often most obvious in sediments, macrophytes and aquatic animals than in elevated concentrations in water (Linnik and Zubenko, 2000). Metals are accumulated in the sediments due to discharge from leaded gasoline, chemical manufacturing industries, transportation vehicles, corrosion of underground pipes, coal based thermal power plants and municipal wastes. After entering in aquatic ecosystem metals can be deposited in aquatic organisms by bio concentration and bioaccumulation via food chain. When accumulation reaches a substantially high level, they become toxic (Huang, 2003; Mahmood et al., 2020a).
Fish which is often at higher level of aquatic food chain, may have heavy metal accumulation in their soft and hard tissues (Mansour and Sidky, 2002). Through a number of routes pollutants enter fish via skin, gills, food and non-food particles and oral consumption of water. After absorption pollutants are transported in blood streams to storage point (bone) or to the liver for transformation (Obasohan, 2008; Mahmood et al., 2020b). Some fishes show higher concentration of metals in gills as taking up metals from the water and others show higher concentration of metals in the gut as compared to other organs as taking up metals from the sediments(Yang et al., 2007; Jones et al, 2013; Mahmood and Malik, 2014; Mahmood et al., 2015). Physiochemical properties of water and ecological factors affect the metal accumulation in fish (Figs. 4 and 5).
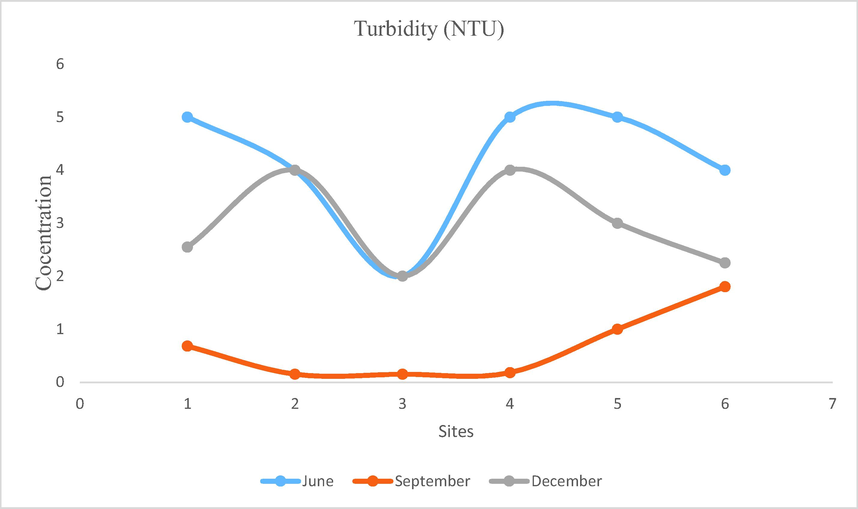
- Showing concentration of Turbidity in Mangla Dam Lake.
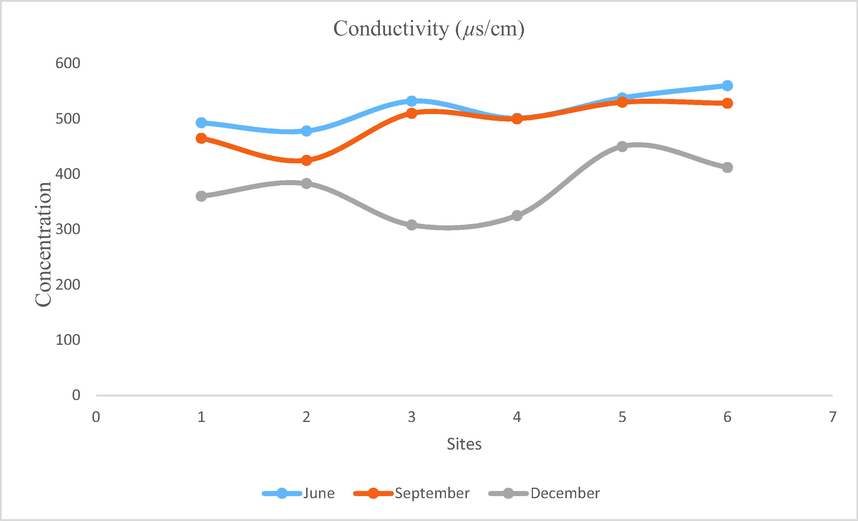
- Showing concentration of conductivity in Mangla Dam Lake.
Heavy metals accumulate in the body and can get stored in soft and hard tissues such as muscles, liver and bone. They cause serious threat to human health. This is the reason heavy metals are among most of pollutants, which are considered very dangerous and received attention in various countries (Hassaan et al., 2007).
An early example of heavy metal toxicity which caused an environmental problem occurred in 1952, in the vicinity of Japanese fishing harbor of Minimata. This Minimata disease occurred due to consumption of fish and shrimps which were contaminated by methyl mercury and non-organic mercury from wastewater discharged by chlor-alkali factories. Another disease known as Ita-Ita occurred in Fugawa, Japane in 1955. It was the result of consumption of rice, fish and bivalves which were contaminated with cadmium from wastewater discharged by nearby mining (Dural et al., 2007) (Fig. 6).
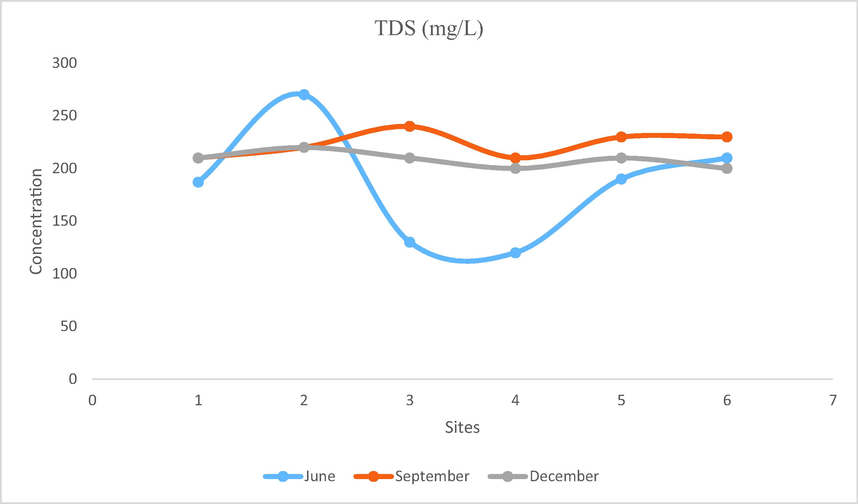
- Showing concentration of TDS in Mangla Dam Lake.
The growing human population has increased the need for food supply. The demand for fish and shellfish products has increased, as they are good sources of protein. People obtain about 25% of their animal protein from fish and shellfish (Bahnasawy et al., 2009). In 2004, about 75% (105.6 million tons) of world fish production was used for direct human consumption. It has been predicted that in developing countries fish consumption will increase by 57% from 62.7 million tons in 1997 to 98.6 million tons in 2020 (Retnam and Zakaria, 2010).
Kashmir is positioned among South Asian countries. It is divided into two parts, Azad Jammu and Kashmir and Indian Occupied Kashmir. In AJ&K water is getting polluted by trace elements and other pollutants due to industrial and municipal wastes (Figs. 7 and 8).
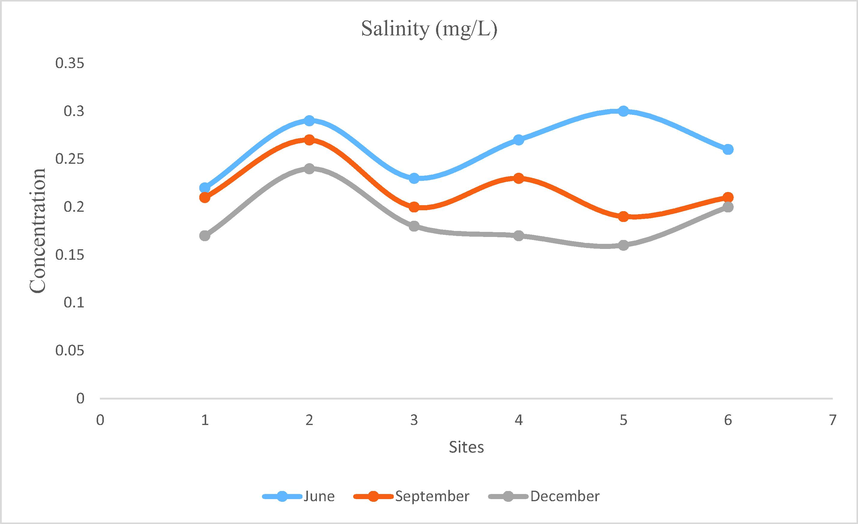
- Showing concentration of Salinity of Mangla Dam Lake.
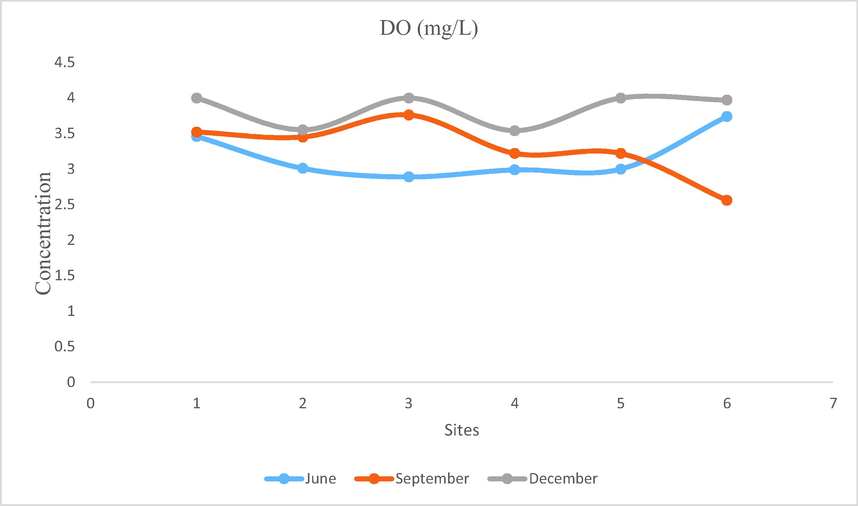
- Showing concentration of DO in Mangla Dam Lake.
Mangla Dam Lake is selected for present study. It is constructed on River Jehlum. Mangla dam construction started on 8 May 1962 and was finally inaugurated on 23 November 1967. The project was designed primarily to increase the amount of water that could be used for irrigation from the flow of Jhelum and its tributaries. Its secondary function was to generate electrical power. The main structures of dam include 4 embankment dams, 2 spillways, 5 power-cum-irrigation tunnels and a power station. The main dam is 3353 m long and 116-meter high above the river bed. Its lake is spread over 100 km. The main dam is supported by two auxiliary dams, the Jari and Sukhian dams. It is designed to store 5.88MAF water. Mangla had an initial storage capacity of 5.88MAF in 1967, which has now been reduced to 1.97MAF (34% of the initial. The fishing rights contracts in Mangla dam was auctioned for Rs 161.2 million (Fig. 9).
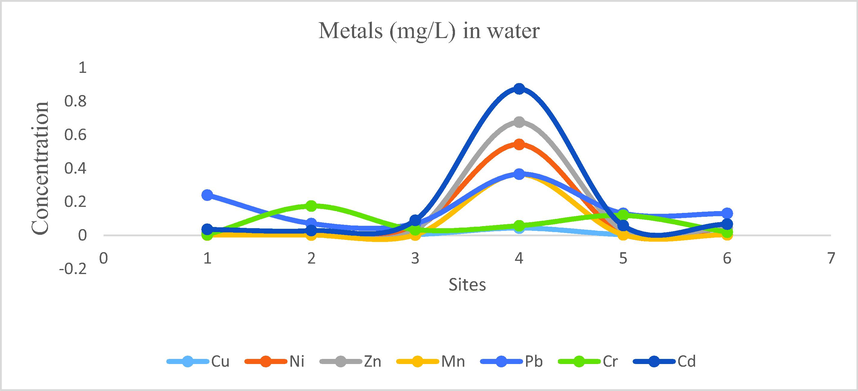
- Concentration of metals in water of Mangla Dam Lake.
The present study is designed to monitor the water quality and analysis of heavy metals in Mangla Dam Lake. Because lake is getting polluted due to anthropogenic activities. In lake kids take bath, women wash clothes and animals fetch their thirst. Open drainage system, domestic waste and agricultural runoff are main cause of pollution in lake.
2 Materials and methods
2.1 Study area
AJ&K covers an area of 13,997 km2. It is situated in Northeast of Pakistan at the latitude 33 to 36. Its elevations ranging from 360 m in North and 6325 m in south. Mirpur district is located at the Southwest of Kashmir region. It covers an area of 1010 km2, and it is 459 m above the sea level. Its coordinates are 33.15 N and 73.73E. It is mountainous area with the patches of some plains. Its climate is dry and hot. Mangla Dam is selected for the present study. It is located at 33.14 N and 73.64E. Its length is 3140 m and height is 147 m. Surface area covered by it is 97square miles (251 km2).
2.2 Sampling
Water, sediment, and fish samples were collected from six sites of Mangla dam. For this purpose, sampling was carried out from June 2015 to December 2015. GPS was used to find out the location of sampling sites (SI Table 1).
2.3 Water
Surface water samples were collected from each site. For this purpose, polyethylene bottles were used which were cleaned by keeping them in 1% nitric acid. Samples were filled in such a way that no bubbles were left in the bottles. Then those sampling bottles were transported to laboratory by placing them in ice box (Fig. 10).
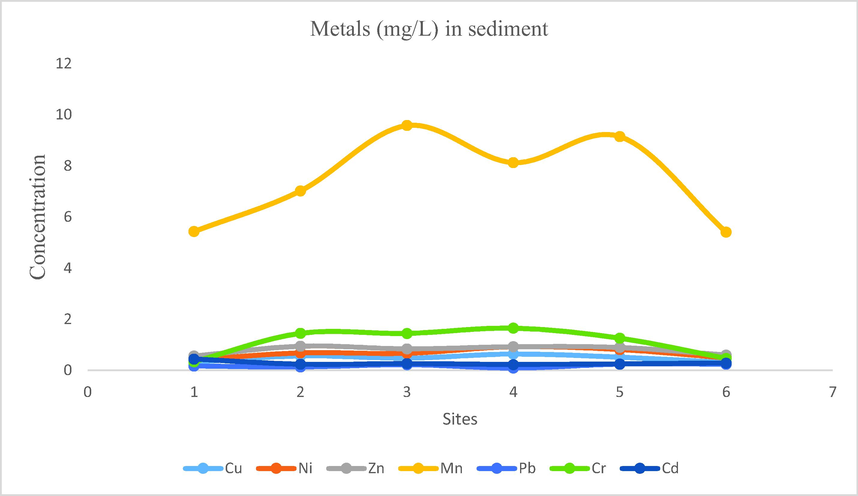
- Showing concentration of metals in sediments of Mangla Dam Lake.
2.4 Sediments
Sampling tubes were used to collect sediment samples from six sampling sites. These sampling tubes along with the samples were transported to laboratory in cooler ice box for further analysis. In the laboratory sediments were freeze-dried for 24 h. Then the samples were dried at room temperature by placing them on filter disc between the sheets of filter paper.
2.5 Fish
Fish samples were collected from Mangla Dam Lake. Dissection was made and different organs were obtained. Organs like gills, liver, intestine, and muscle were collected and brought to laboratory for further analysis by keeping these samples in cooler ice box.
2.6 Physicochemical analysis
Physiochemical parameters like temperature, pH, turbidity, electrical conductivity, salinity, total dissolved solids, dissolved oxygen, biological oxygen demand and chemical oxygen demand were determined (Fig. 11).
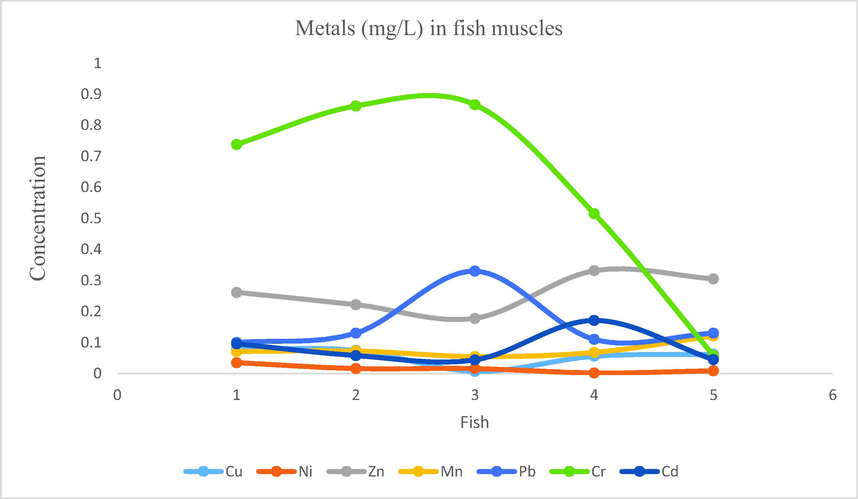
- Showing concentration of metals in fish muscles of Mangla Lake.
2.7 Spot analysis
Following parameters were recorded on spot; Color, Temperature and pH.
2.8 Laboratory analysis
Dissolved oxygen was determined by using oxymeter. Conductivity meter was used in order to find out the electrical conductivity of sample water. Salinity and total dissolved solids were also determined by conductivity meter
2.9 Heavy metals
2.9.1 Digestion of samples
1 g of powdered soil sample was digested in 15 ml of aqua regia in 3;1 (HCl, HNO3) and left overnight. Next day it is digested on the hotplate near about 150 °C until brown fumes turn off. Wet tissues consisted of liver, gills, kidneys, and muscles of fish. 1 g of wet from each stock tissue was taken and it is digested by adding 5 ml of HNO3 and 1 ml of HCLO4 in flask. Digestion was carried out on hotplate which was adjusted at 200 °C to 250 °C till the digest is converted into colorless liquid.
2.9.2 Procedure
Fast Sequential Atomic Absorption Spectrophotometer (FS-AAS) was used to determine the heavy metal content in the samples (Fig. 12).
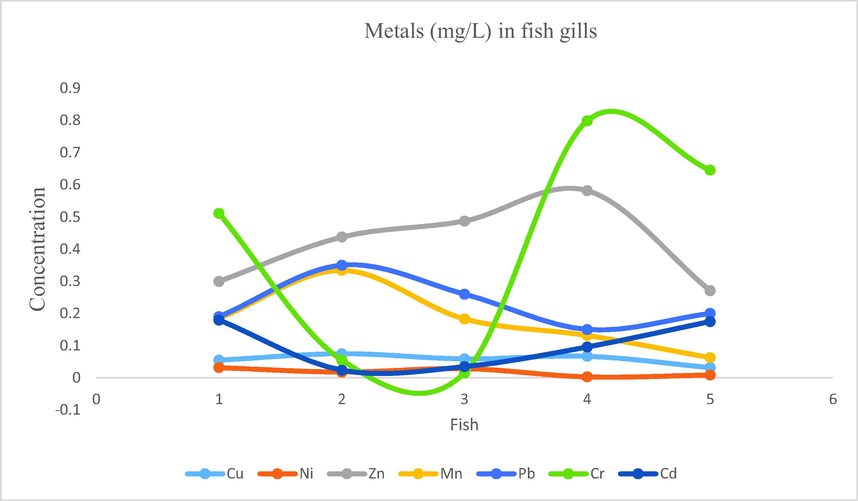
- Showing concentration of metals in fish gills of Mangla Dam Lake.
3 Results and discussion
3.1 Temperature
Physical, chemical, and biological properties of water can change with the change in temperature. Temperature is the most important parameter as it can affect the health of aquatic system. Temperature of the Mangla dam lake showed distinct fluctuations. It was high as (32.5 °C) in summer season and low as (12.6 °C) in winter season. Maximum temperature was recorded at WS1 during June and minimum at WS4 during December. It is observed that temperature is increased during summer and decreased during winter. Temperature of Mangla Dam Lake is recorded to be within permissible limits given by WHO (Fig. 13).
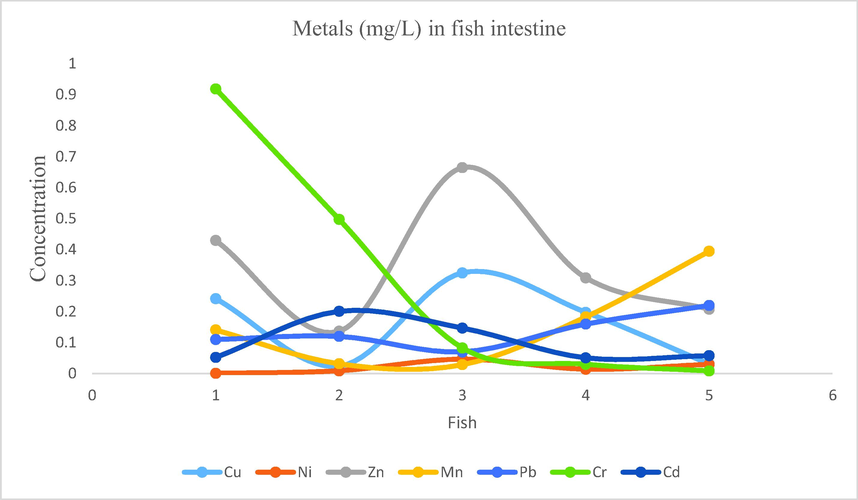
- Showing concentration of metals in fish intestine of Mangla Dam Lake.
3.2 pH
pH is the parameter which is important to determine as it is used to find out the acidity and alkalinity of the medium. The biological approachability and solubility of chemical substances depend upon the pH of the medium. These chemical substances include heavy metals, nutrients, nitrogen, carbon, phosphorous etc. Metals are more soluble at low pH of the medium and hence become extremely noxious. Water becomes unsuitable for utilization by living organisms when it contains high concentration of heavy metals due to low pH values. It was noticed that throughout the year, pH value of the lake water showed no significant variation. It remained alkaline during the analysis in different months of the year. Maximum PH was recorded at WS6 which was 8.3 and minimum pH was recorded as 7.1 at WS1. These values were within permissible values as given by WHO (6.5–8.5).
3.3 Turbidity
Turbidity is defined as suspended particles which hinder the passage of light in water. Water with low turbidity values is considered beneficial for aquatic life because fish gills and photosynthetic activity is affected by high turbidity. Water seems to be cloudy if it contains higher amount of total suspended solids. Turbidity is mostly caused by phytoplankton. It is also caused by mud and silt. Particulates like mud and silt come from shoreline disintegration, organic detritus and waste water parole Heavy metals like lead, cadmium, mercury and some other organic adulterants such as PAHs, PCBs and pesticides get accumulated in these particulates. The opacity of water increases due to bottom feeding fish, floods and dig up operations. Turbidity of Mangla Dam Lake is recorded between 1 and 6 NTU which is within permissible limits suggested by WHO (10 NTU) (Fig. 14).
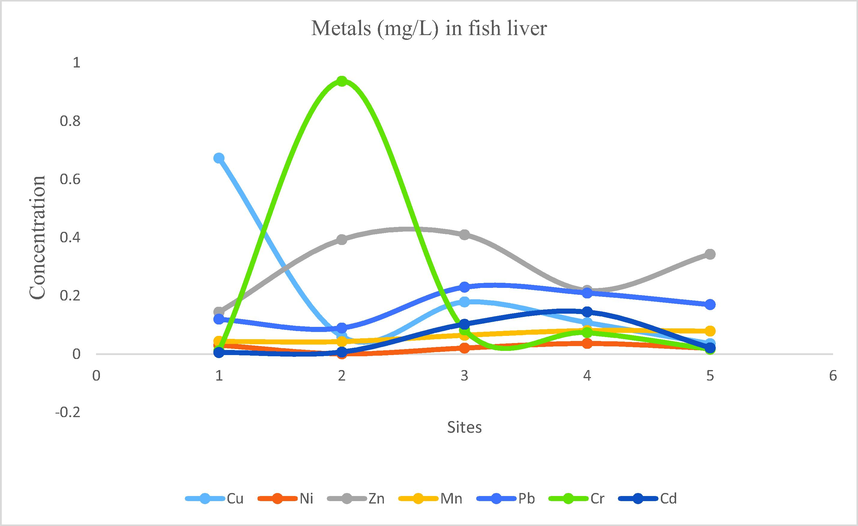
- Showing concentration of metals in fish liver of Mangla Dam Lake.
3.4 Electrical conductivity
Electrical conductivity is defined as the ability of an aqueous medium to conduct electric current. Ions have varied extend to transmit electric current. If the amount of ions increases in water then its ability to conduct current also increases. Temperature also effects conductivity if temperature of the aqueous medium is increased then its tendency to conduct electric current also increases. That’s why conductivity at 25°C is reported as conductivity. Organic compounds when present in water do not conduct electric current. Maximum electric conductivity (560 µs/cm) is recorded on WS6 in the month of June while minimum electric conductivity (308 µs/cm) is recorded on WS3 in the month of December. EC of Mangla Dam Lake changes from 303 to 560 µs/cm which is under permissible values given by WHO (800 µs/cm).
3.5 Total dissolved solid (TDS)
Organic and inorganic substances are generally present in natural water. Some substances are present in suspended form hence known as total suspended solids while some other solids are present in dissolved form hence termed as total dissolved solids. Water with more than 500 mg/L of TDS value is considered unsuitable for consumption. Total dissolved solids of Mangla Dam Lake ranged from 120 to 270 mg/L. Maximum TDS value was observed on WS2 that is 270 mg/L while minimum TDS value is observed on WS4 that is 120 mg/L. TDS values of Mangla Dam Lake were lower as compared to the values (210–350 mg/L) of Keenjhar Lake reported by Koari et al.
3.6 Salinity
Quantity of dissolved salts in water is known as salinity. Maximum salinity value of Mangla Dam Lake was recorded as 0.3 mg/L WS5 during June. Minimum salinity value was recorded as 0.16 at WS5 during December. In June maximum salinity was recorded at different sites as compared to other months this might be due to the fact that anthropogenic activities increased during this month. Women wash cloth and kids take bath at the site situated near human colony (Fig. 15).
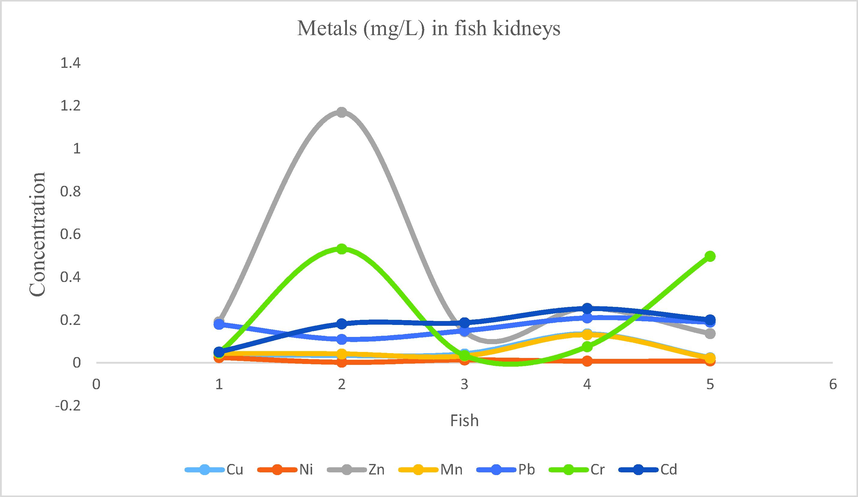
- Showing concentration of metals in fish kidneys of Mangla Dam Lake.
3.7 Dissolved oxygen (DO)
Amount of free oxygen present in water is called DO. Amount of dissolved oxygen changes daily and on seasonal patterns. When temperature increases there occurs decrease in dissolved oxygen. DO also decreases with salinity and elevation. The main source of DO is atmosphere and photosynthetic plants. It is depleted through the respiration, chemical oxidation and by decomposition of organic material and plant biomass. Surface water near water atmosphere interface is generally saturated or supersaturated with oxygen. This is because there is sufficient light for photosynthesis. Deeper water receives oxygen by wind currents and inflows. For healthy aquatic ecosystem dissolved oxygen is necessary. Oxygen requirement depends on species and their life stages. For survival 5 mg/L of dissolved oxygen is the limit below this level biological life is severely affected and concentration below 2 mg/L may cause death of aquatic organisms (Forstner and Wittman, 1981). Dissolved oxygen in Mangla Dam Lake ranged from 2.5 to 4 mg/L which shows insufficient oxygen level that might be due to high rate of decomposition of organic matter.
3.8 Metal cations in water
Concentration of heavy metals like Na, Cu, Ni, Zn, Fe, Mn, Pb, Cr and Cd were determined. According to the analysis results, following findings were obtained for the concentration ranges of the metals: Na: 4.933–10.702, Cu: 0.002–0.043, Ni: 0.008–0.543, Zn: 0.016–0.675, Fe: 0.03–0.565, Mn: 0.001–0.365, Pb: 0.07–0.365, Cr: 0.003–0.175, Cd: 0.028–0.875.
Mean concentration of sodium was 7.164, followed by iron its mean concentration recorded as 0.197 then cadmium, lead, zinc, nickle, chromium, manganese and copper with their mean concentration 0.192, 0.167, 0.135, 0.111, 0.067, 0.062 and 0.011 respectively. The order of mean metal concentrations in water samples was Na > Fe > Cd > Pb > Zn > Ni > Cr > Mn > Cu.
3.9 Metal cations in sediments
In sediment samples, according to analysis results, the following findings were obtained for concentration ranges of metals: Na: 5.6931–17.108, Cu: 0.299–0.636, Ni: 0.407–0.926, Zn: 0.5557–0.9468, Fe: 56.31–89.16, Mn: 5.403–9.581, Pb: 0.09–0.24, Cr: 0.334–1.652, Cd: 0.224–0.438.
Mean concentration of iron was 72.706, followed by sodium, manganese, chromium, zinc, nickle, copper, cadmium and lead with their mean concentrations recorded as 11.748, 7.451, 1.099, 0.793, 0.663, 0.467, 0.281, 0.181 respectively. The order of mean concentration in sediment samples were Fe > Na > Mn > Cr > Zn > Ni > Cu > Cd > Pb.
3.10 Metal cations in fish muscle
According to the analysis results of fish muscle samples, following findings were obtained for the concentration ranges of metals: Na: 19.4115–42.1709, Cu: 0.007–0.079, Ni: 0.002–0.035, Zn: 0.1778–0.3312, Fe: 2.1–3.16, Mn: 0.055–0.121, Pb: 0.1–0.33, Cr: 0.058–0.866, Cd: 0.044–0.171. Mean concentrations of sodium, iron, chromium, zinc, lead, cadmium, manganese, copper and nickel were 29.31, 2.55, 0.60, 0.25, 0.16, 0.08, 0.07, 0.05 and 0.01 respectively. The order for mean concentrations of metals were Na > Fe > Cr > Zn > Pb > Cd > Mn > Cu > Ni.
3.11 Metal cations in fish gills
According to the analysis results the concentration ranges of the metals were as follow: Na: 14.73–44.73, Cu: 0.032–0.075, Ni: 0.003–0.032, Zn: 0.271–0.58, Fe: 2.88–22.8, Mn: 0.063–0.33, Pb: 0.15–0.35, Cr: 0.015–0.79, Cd: 0.024–0.18. From the samples of fish gills following findings were obtained for the mean concentration of the metals: Na: 28.292, Fe: 7.998, Zn: 0.415, Cr: 0.405, Pb: 0.23, Mn: 0.179, Cd: 0.102, Cu: 0.057, Ni: 0.018. The order for mean concentrations of metals were Na > Fe > Zn > Cr > Pb > Mn > Cd > Cu > Ni.
3.12 Metal cations in fish intestine
Concentration ranges of metals were recorded as follow: Na: 6.46–27.62, Cu: 0.031–0.325, Ni: 0.001–0.047, Zn: 0.136–0.665, Fe: 1.29–19.72, Mn: 0.029–0.395, Pb: 0.07–0.22, Cr: 0.009–0.919, Cd: 0.051–0.201.From the samples of fish intestine following findings were obtained for the mean concentration of metals Na: 16.352, Fe: 7.82, Zn: 0.349, Cr: 0.307, Cu: 0.164, Mn: 0.156, Pb: 0.136, Cd: 0.101, Ni: 0.020. The order for mean concentrations of metals in fish intestine samples was Na > Fe
3.13 Metal cations in fish liver
From the analysis results following values were obtained for the concentration ranges of metals: Na: 10.88–22.16, Cu: 0.036–0.673, Ni: 0.001–0.037, Zn: 0.144–0.409, Fe: 2.32–6.81, Mn: 0.04–0.081, Pb: 0.09–0.23, Cr: 0.012–0.937, Cd: 0.006–0.145. Following findings were obtained for the mean concentration of metals from the fish liver samples. Na: 17.281, Fe: 3.962, Zn: 0.301, Cr: 0.224, Cu: 0.211, Pb: 0.164, Mn: 0.062, Cd: 0.056, Ni: 0.022. The order of mean concentrations of the samples were as follow, Na > Fe > Zn > Cr > Cu > Pb > Mn > Cd > Ni.
3.14 Metal cations in fish kidneys
Concentration ranges of metals were as follow: Na: 9.13–12.35, Cu: 0.024–0.136, Ni: 0.003–0.025, Zn: 0.136–1.169, Fe: 1.29–2.78, Mn: 0.022–0.132, Pb: 0.11–0.21, Cr: 0.034–0.532, Cd: 0.051–0.254.
From the samples of fish kidneys following findings were obtained for the mean concentration of metals. Na: 11.023, Fe: 2.178, Zn: 0.379, Cr: 0.237, Cd: 0.175, Pb: 0.168, Cu: 0.055, Mn: 0.054, Ni: 0.011. The order for mean concentrations of metals was Na > Fe > Zn > Cr > Cd > Pb > Cu > Mn > Ni.
4 Discussion of heavy metals
The concentrations of cadmium, chromium, copper, manganese, lead and nickel, (Cd, Cr, Cu, Mn, Pb, and Ni) were compared with international standards.
4.1 Cadmium
Cadmium is a non-essential metal belongs to group II B. It has an atomic weight of 112.41. The specific gravity of cadmium is 8.65. (Cd2+) is the ionic form of cadmium. Cadmium is a natural element in the earth’s crust. It is usually found as a mineral with other elements. Coal and mineral fertilizer contain cadmium. Mining, burning of coal and household wastes cadmium enters air.
According to WHO/FAO maximum tolerable amount of cadmium which can be taken weekly is 7 g/kg of body weight. According to EU, for cadmium maximum residue limit (MRL) permitted in fish is 0–10.3 g/g (Herreros et al., 2008). Cadmium exposure may cause gastrointestinal disorders, kidney failure and hypertension. Toxicity induced by Cd may decrease pregnancy length, newborn weight and endocrine and immune system disorders in children (Schoeters et al., 2006). The mean concentration of cadmium in water samples according to the analysis results was 0.19. According to EPA, 2002 the permissible value of cadmium is 0.01. The cadmium level of water in Mangla Dam Lake was higher compared to cadmium level of Avsar Dam Lake (Ozturk et al., 2009), Demirkopru Dam Lake (Ozturk et al., 2008) and Lapland Lakes (Mannio et al., 1995). The concentration of cadmium which is obtained from the sediment samples was 0.281. When this value is compared with sediment quality guidelines it appears to be within range as LEL (Lowest Element Level) for cadmium is 0.60, TEL (Threshold Element Level) is 0.99, PEC (Probable Effect Concentration) is 4.90 and SEC (Severe Effect Level) for cadmium is 10.00. The value of cadmium in sediments of Mangla Dam Lake did not exceed the values of Lake Victoria (Kishe and Machiwa, 2003) and Lake Geneva (Pote et al., 2008).
4.2 Chromium
Naturally chromium exists in soil due to weathering of chromium containing parent material. The anthropogenic sources of Cr in the environment is the use of Cr in the metallurgy, refractory and chemical industries. The mean concentration of chromium in water samples was obtained as 0.06. According to WHO, 2003 the permissible value of chromium is 0.05. The result shows that chromium is above the permissible limit in water. The concentration of chromium in sediment samples was recorded as 1.09. When this value is compared with sediment quality guidelines it appears to be within range. LEL for chromium is 26.00, TEL is 43.40. PEC is 111.00 and SEC is 110.00. The value of chromium in sediment of Mangla lake is less than that of Lake Victoria, Lake Geneva and Lake Texoma (An and Kampbell, 2003).
4.3 Copper
Copper is a heavy metal with atomic number 29 and atomic mass 63.546. It belongs to the group XI of the periodic table. Mining, waste emissions and usage of sewage sludge, fungicides and fertilizers in agriculture sector are the anthropogenic sources of Cu in soil (Flemming and Trevors, 1989).
The concentration of copper in lake water was compared with water quality guidelines. The concentration of copper in Mangla Lake according to analysis results was 0.01. According to its value should be 2.00 and according to EPA 2002 its permissible value is 1.3. The copper level of Mangla Dam was lower compared to Demirkopruu Dam Lake (Ozturk et al., 2008) and higher than Lapland Lakes (Mannio et al., 1995). The results of sediment samples showed that the concentration of copper was 0.4. It is also appeared to be within limits as Lowest Effect Level for copper is 16.0, Threshold Effect concentration for copper is 31.6, Probable Effect Concentration is 149.0 and Severe Effect Concentration is 110.0.
4.4 Manganese
Manganese is a whitish-grey metal, belongs to group VIIA of the periodic table very brittle, and oxidizes superficially in air. It has atomic weight of 54.94 and a specific gravity of 7.2 g cm−3. In natural environment Mn mostly occurs in combined form (Momtaz, 2002). Mn is frequently found in sedimentary, igneous and metamorphic rocks. Manganese is an essential element present in all living organisms. The excess amount of manganese affects central nervous system and causes liver cirrhosis. Parkinson disease may be caused by high amount of it. From the analysis results of water samples the concentration of manganese was obtained as 0.06. This value is compared with the water quality guidelines. The permissible value of manganese given by WHO (2003) is 0.50. It is analyzed that value of manganese is within limit in lake water.
4.5 Nickel
Nickel is an essential element at trace levels (Sivaperumal et al., 2007., Hussain, 1991). It acts as an activator of some enzyme systems. Nickel belongs to (group VIII) of the periodic table, and it is a silvery white, malleable, and hard metal. Its atomic weight is 58.71 and specific gravity of 8.9. This abundant element is present in all soils and emitted from volcanoes. At high levels nickel may cause respiratory disorders and become carcinogenic (Ikema and Egieborb, 2005). Nickel is used as alloy in steel industry, Ni/CD batteries, electroplating, pigments for paints and ceramics, molds for ceramic and glass container, surgical and dental prosthesis and computer components (Bradi, 2005). The analysis results of water samples showed that the concentration of nickel was 0.11. This value is compared with the value given by WHO. The permissible value for nickel is 0.02. It is concluded that the value of nickel is above the given limit. Nickle value of Mangla Dam Lake was higher than the value of nickel in Siberian Pond (Gladyshev et al., 2001). According to sediment quality guidelines. Lowest Element Level for nickle is 16.000, Threshold Element Level is 22.700, Probable Effect Concentration is 48.600 and Severe Effect Level is 75.000. In this study the value of nickel in sediment samples was obtained as 0.66 which is under limit.
4.6 Lead
Lead is a bluish- grey metal belongs to group IVA of the periodic table. Its atomic weight is 207.2, and specific gravity of 11.34. To form lead compounds, it combines with two or more elements. It is found in small amount in earth crust. Most of it came from human activities, like mining, manufacturing and the burning of fossil fuels. Lead can replace calcium in bones, when accumulates in human body. Due to lead exposure, there may occur retardation of neurobehavioral development (Lidsky and Schneider, 2003, Castoldi et al., 2003). According to European Food Safety Authority (EFSA) exposure to Cd and Pb may cause neurotoxicity, nephrotoxicity, carcinogenicity and endocrine and reproductive failures in adults (Herreros et al., 2008). According to WHO (2003) the standard value for lead is 0.05. When this value is compared with the value of the present study it appeared to be high than limit. Results of the lake water showed the value of lead as 0.16. Lead value of water Mangla Dam Lake was lower when compared with Gediz River (Uzunoglu, 1999). The concentration of lead in sediments did not exceed the sediment quality guidelines. Lowest Element Level for lead is 31.00, Threshold Element Level is 35.80, Probable Effect Concentration is 128.00 and Severe Effect Level is 250.00. The value of lead in sediments of Mangla Lake was lower than that of value recorded in Avsar Dam Lake (Ozturk et al., 2009) and Wielkie Lake (Szymanowska et al., 1999).
5 Conclusion
In the water of Mangla Dam there is a low concentration of Dissolved Oxygen (DO) it shows that there is water pollution it may be due the addition of sewage in lake. Lake area is also decreasing due to accumulation of mud in it. Mean concentration of metals in water samples was Cd > Pb > Zn > Ni > Cr > Mn > Cu. Concentration of cadmium, chromium and nickel in water is higher than permissible value. Concentration of copper and manganese are within limit. In sediment samples concentration of metals are recorded as Mn > Cr > Zn > Ni > Cu > Cd > Pb. Concentration of Cadmium, Chromium, Copper, Nickle and Lead are within limits as compared to International standards. The results obtained from fish samples showed that concentration of metals decreased in the order Cr > Zn > Pb > Cd > Mn > Cu > Ni in muscle, Zn > Cr > Pb > Mn > Cd > Cu > Ni in gills, Zn > Cr > Cu > Mn > Pb > Cd > Ni in intestine, Zn > Cr > Cu > Pb > Mn > Cd > Ni in liver, Zn > Cr > Cd > Pb > Cu > Mn > Ni in kidneys.
Acknowledgement
The authors extend their appreciation to the Researchers Supporting Project number (RSP-2021/381), King Saud University, Riyadh, Saudi Arabia.
Declaration of Competing Interest
The authors declare that they have no known competing financial interests or personal relationships that could have appeared to influence the work reported in this paper.
References
- Bioaccumulation of some heavy metals in tilapia fish relevant to their concentration in water and sediment of, Wadi Hanifah, Saudi Arabia. Afr. J. Biotechnol.. 2011;10(13):2541-2547.
- [Google Scholar]
- Total, dissolved, and bioavailable metals at Lake Texoma marinas. Environ. Pollut.. 2003;122(2):253-259.
- [Google Scholar]
- Seasonal Variations of Heavy Metals Concentrations in Mullet, Mugil Cephalus and Liza Ramada (Mugilidae) from Lake Manzala, Egypt. J. Appl. Sci. Res.. 2009;13(2):81-100.
- [Google Scholar]
- Bradi, B.H., 2005. Heavy metals in the environment. Interface Science and Technology, ed. Hubbard, A., Vol. 6. 2005, Elsevier Academic Press: Neubrucke.
- Neurotoxic and molecular effects of methylmercury in humans. Rev. Environ. Health. 2003;18(19–32):5-24.
- [Google Scholar]
- Investigation of heavy metal levels in economically important fish species captured from The Tuzla Lagoon. Food Chem.. 2007;102(1):415-421.
- [Google Scholar]
- EPA (Environmental Protection Agency), 2002. Risk assessment: Technical background information. RBG Table. Available from http://www.epa.gov./reg3hwmd/ risk (online update: 23.03.2009).
- Copper toxicity and chemistry in the environment - a review. Water Air Soil Pollut.. 1989;44(1-2):143-158.
- [Google Scholar]
- “Metal pollution in the aquatic environment. Berlin, Heidelberg, Germany: Springer-Verlag. 1981;272:486.
- [Google Scholar]
- Content of metals in compartments of ecosystem of a Siberian pond. Arch. Environ. Contam. Toxicol.. 2001;41:157-162.
- [Google Scholar]
- Hassaan M.H., Al-Kahali, M., Al-Edres, M., 2007. Heavy Metal Contamination in the White Muscles of Some Commercial Fish Species From Al-Hodeidah - Red Sea coast of Yemen.
- Contribution of fish consumption to heavy metals exposure in women of childbearing age from a Mediterranean country (Spain) Food Chem. Toxicol.. 2008;46(5):1591-1595.
- [Google Scholar]
- Heavy metal concentrations in the common benthic fishes caught from the coastal waters of Eastern Taiwan. J. Food Drug Anal.. 2003;11(4):324-330.
- [Google Scholar]
- Study of environmental pollutants in and around the city of Lahoore, in chemistry. Lahoore: Benjab; 1991.
- Assessment of trace elements in canned fishes (mackerel, tuna, salmon, sardines and herrings) marketed in Georgia and 62 Alabama (United States of America) J. Food Compos. Anal.. 2005;18:771-787.
- [Google Scholar]
- Long term trends of Hg uptake in resident fish from polluted estuary. Mar. Pollut. Bulik. 2013;73:263-272.
- [Google Scholar]
- Distribution on heavy metals in sediments of Mwenza Gulf of Lake Victoria, Tanzania. Environ. Int.. 2003;28:619-625.
- [Google Scholar]
- Lead neurotoxicity in children: basic mechanisms and clinical correlates. Brain. 2003;100:284-293.
- [Google Scholar]
- Role of bottom sediments in the secondary pollution of aquatic environments by heavy metal compounds Lakes and Reservoirs. Res and Man.. 2000;5(1):11-21.
- [Google Scholar]
- Mahmood, A., Eqan, M., Pervez, S., Tabinda, A.B., Yasar, A., Brindhadevi, K., Pugazhendhi, A., 2020a. COVID-19 and frequent use of hand sanitizers; human health and environmental hazards by exposure pathways, Sci. Total Environ. (2020), https://doi.org/10.1016/j.scitotenv.2020.140561. Volume, 742; Paper Number 140561.
- Mahmood A., Syed J.H., Raza W., Tabinda A.B., Mehmood A., Li J., Zhang G., Azam M., 2020b. Human Health Risk Assessment by Dietary Intake and Spatial Distribution Pattern of Polybrominated Diphenyl Ethers and Dechloran Plus from Selected Cities of Pakistan. Int. J. Environ. Res. Public Health 2020, 17, 9543; doi:10.3390/ijerph17249543.
- Human health risk assessment of heavy metals via consumption of contaminated vegetables collected from different irrigation sources in Lahore, Pakistan. Arabian J. Chem.. 2014;7(1):91-99.
- [Google Scholar]
- Antimicrobial Activities of Three Species of Family Mimosaceae, Pakistan. J. Pharm. Sci.. 2012;25(1):203-206.
- [Google Scholar]
- Dietary exposure and screening-level risk assessment of Polybrominated diphenyl ethers (PBDEs) and Dechloran plus (DP) in wheat, rice, soil and air along two tributaries of the River Chenab, Pakistan. Chemosphere. 2015;118:57-64.
- [Google Scholar]
- Survey of trace elemens in lakes waters of Finnish Lapland using the ICP-MS technique. Sci. Tot. Environ.. 1995;160:433-439.
- [Google Scholar]
- Heavy metals contaminating water and fish from Fayoum Governorate, Egypt. Food Chememistry. 2002;78:15-22.
- [Google Scholar]
- Geochemical studies of Heavy Metals in the Seawater along Karachi Makran Coast, in Chemistry. University of Karachi: Karachi.. 2002;414
- [Google Scholar]
- Bioaccumulation of chromium, copper, maganese, nickel and lead in a freshwater cichlid, hemichromis fasciatus from Ogba River in Benin City, Nigeria. Afr. J. Gen. Agric.. 2008;4(3):141-152.
- [Google Scholar]
- Determination of heavy metals in fishes, water and sediment from the Demirkopru Dam Lake(Turkey) J. Appl. Biol. Sci.. 2008;2(3):99-104.
- [Google Scholar]
- Determination of heavy metals in fish, water and sediments of Avsar Dam Lake in Turkey. Iran J. Environ Health Sci Eng.. 2009;6(2):73-80.
- [Google Scholar]
- Effects of a sewage treatment plant outlet pipe extention on the distribution of contaminants in the sediments of the Bay of Vidy, Lake Geneva, Switzerland. Bioresour. Technol.. 2008;99:7122-7131.
- [Google Scholar]
- Retnam, A., Zakaria, M., 2010. Hydrocarbons and heavy metals pollutants in aquaculture. 2010 [cited; Available from: http://psasir.upm.
- Cadmium and children: exposure and health effects. Acta Paediatrica.. 2006;95(453):50-54.
- [Google Scholar]
- Heavy metal concentrations in fish, shellfish and fish product from internal markets of India vis-a-vis international standards. Food Chem.. 2007;2007(102):612-620.
- [Google Scholar]
- Environmental Research, Section B. Heavy Metals in Three Lakes in West Poland. Ecotox. Environ. Safe. 1999;43:21-29.
- [Google Scholar]
- Gediz nehrinden alman su ve sediment orneklerinde bazi agir metal konsantrasyonlarinin belirlenmesi. Yuksek lisans tezi. Celal Bayar Universitesi Fen Bilimleri Enstitusu, Manisa, Turkiye. (In Turkish) 1999
- [Google Scholar]
- WHO, Guideline for drinking water quality. 2nd edition. 1 recommendation. World health organization. Genova, PP: 30-113. Nilosky, G.U., 1963 (2003). The ecology of fishes. Academic press. New York.
- Accumulation features of organochlorine pesticides and heavy metalas in fish from high mountain lakes and Lbasa River in Tibetan plateau. Environ. Int.. 2007;33:151-156.
- [Google Scholar]
- The Comparison of Heavy Metal Concentrations (Cd, Cu, Mn, Pb, and Zn) in Tissues of Three Economically Important Fish (Anguilla anguilla, Mugil cephalus and Oreochromis niloticus) Inhabiting Kycegiz Lake- Mugla (Turkey) Turk. J. Sci. Technol.. 2009;4(1):7-15.
- [Google Scholar]
Appendix A
Supplementary data
Supplementary data to this article can be found online at https://doi.org/10.1016/j.jksus.2021.101685.
Appendix A
Supplementary data
The following are the Supplementary data to this article:


