

Translate this page into:
Application of the new edge filters of aeromagnetic data to detect the subsurface structural elements controlling the mineralization in the Barramiya area, Eastern Desert of Egypt
⁎Corresponding authors. luanpt@hus.edu.vn (Luan Thanh Pham), musab20501@gmail.com (Musaab A.A. Mohammed)
-
Received: ,
Accepted: ,
This article was originally published by Elsevier and was migrated to Scientific Scholar after the change of Publisher.
Abstract
The Barramiya region holds significant importance within the Mubarak-Hamash block because of its substantial gold mining activities. The primary aim of this research is to locate the structural framework of Barramiya, a subject that has not been previously investigated. This will have an impact on the mineralization in the area. To address this issue, we have employed various analytical techniques, namely the theta (TM), tilt angle of the gradient amplitude (TAHG), second normalized gradient amplitude (STDX), gradient amplitude of NTilt (THGNTilt), logistic function of the gradient amplitude (LTHG), and gradient amplitude-based edge detection (THGED). These techniques have been applied to aeromagnetic data with the purpose of delineating the structural features of the studied region. The depth of structures in the area has also been determined through the utilization of the tilt angle-based approach. The majority of magnetic sources in the region exhibit a depth that is less than 500 m. The findings obtained in this study indicate that the edge detection filters utilized in this research can simultaneously detect the boundaries of buried geological bodies with different depths. The findings additionally indicate that the N-S, NE-SW, and NW-SE directions have significant influence and control on mineralization in the Barramiya region.
Keywords
Structural framework
Edge detection
Magnetic data
Barramiya

1 Introduction
The aeromagnetic techniques are crucial for mineral exploration and mapping subsurface structures, geothermal activities, archaeology site studies, and engineering applications (Abdelrahman and Essa, 2005; Essa, 2021, 2022; Essa and Elhussein, 2019; Kuang, 2023; Mohamed et al 2022; Toushmalani, 2024). These approaches rely on the detection of differences in the Earth's magnetic field caused by variances in magnetic susceptibility inside distinct geological formations structures like folds and faults (Kuang et al., 2022; Abdelrady et al., 2023a,b).
Edge determination plays an essential part in the analysis of potential fields, hence facilitating a comprehensive understanding of geological formations. Several filtering techniques have been proposed in the literature to enhance the delineation of geological formations from potential field data (Pham 2024a,b, Mohamed and Pham 2024). These methods primarily rely on the computation of derivatives of the field, as well as their different combinations (Ekinci et al., 2013; Hamimi et al., 2023). The benefits and drawbacks of each edge detection filter vary depending on the parameters of magnetic data. The application of edge detection techniques has been extensively employed in the field of exploration technology for the purpose of identifying and locating mineral resources, energy resources, and regional tectonic features (Eldosouky et al., 2020; Pham et al., 2024). The significance of these methods in geological interpretation lies in their ability to identify underlying geological characteristics like contacts and faults, which are important for accurate geological analysis. Nabighian (1972), Cordell and Grauch (1985), Hsu et al. (1996), and Beiki (2010) have provided demonstrations of the utilization of amplitude-based filters for the purpose of defining the source edges. The utilization of phase-based filters may result in better results in terms of source edge detection across different depths (Pham et al., 2022). Several phase-based filters have been suggested in the literature for simultaneously enhancing the boundaries of large and small anomalies (Miller and Singh, 1994; Wijns et al., 2005; Cooper and Cowan, 2008; Pham, 2023). The theta map (TM) is a widely utilized phase-based methodology that employs the normalized horizontal derivative for edge mapping (Wijns et al., 2005). The concept of the tilt of the horizontal gradient (TAHG) was initially presented by Ferreira et al. (2013). This process is characterized by the generation of peaks along the edges of the source and the equitable combination of signals originating from both deep and shallow bodies. The second normalized gradient amplitude (STDX) is an improved form of the tilt angle (Ma et al., 2016). It uses the second vertical derivative to normalize the gradient amplitude of the vertical derivative. It is possible to get very clear edges with the horizontal derivative of NTilt, which Nasuti and Nasuti (2018) used. The logistic filter of the gradient amplitude (LTHG) was used by Pham et al. (2023) to find the edges. Dan et al. (2022) showed how to map the edges and to reduce false information by using a combination of different curvatures. Recently, Pham et al. (2023) introduced a new technique based on the horizontal gradient (THGED) that balances signals from different sources and gets the highest amplitudes on the edges.
Significant gold deposits can be found in the Barramiya area, which is part of the Mubarak-Hamash block. Figuring out the area's geological structures requires knowing about underground faults, contacts, and other tectonic features from the edges of magnetic bodies. Several geophysical studies have been conducted in the area, such as paleomagnetic studies to find the Curie point depth (CPD) (Abd El Nabi 2012) and aeromagnetic studies to find subsurface geological structures that control mineralization using traditional techniques (Mohamed et al 2022; Saleh, 2018). Gad and Kusky (2006) used automated classification methods and band ratio images (5/3, 5/1, 7/5), and (7/5, 5/4, 3/1) to map the lithology of the serpentinite rocks in this area. Geological studies like petrography, fluid inclusion studies, and geochemical analysis were also used to find out where the ore-forming fluids originated from, the source of gold, and how it was transported (Mahmoud, 2013; Zoheir and Lehmann, 2011; Abdelrady et al 2022). The El-Barramiya gold mine, located in the western Barramiya region, was formerly one of the greatest gold mines in the world. However, production has been halted since 1964. This study will focus on this mine zone, a very potential gold mining location in Egypt. Classical methods for edge detection have been applied and used for this area before and this research is motivated by the need for a better way to detect the boundaries of buried geological bodies with different depths helped in deposition of mineralization.
For the first time, we mapped the area's structure using advanced filters like the theta map (TM), tilt angle of the gradient amplitude (TAHG), second normalized gradient amplitude (STDX), gradient amplitude of NTilt (THGNTilt), logistic function of the gradient amplitude (LTHG), and gradient amplitude-based edge detection (THGED). These filters were applied to an aeromagnetic dataset from the Barramiya area. The effectiveness of these filters is assessed by utilizing synthetic data before applying them to data of the study region.
2 Geology settings
The Egyptian Nubian Shield (ENS) is the northern extension of the East African Orogen, which spans across the Arabian-Nubian Shield. The ENS is thought to have been created by northward-directed escape tectonics. It is unique because it has suture zones, areas of mild accretion, and large strike-slip zones that feel mostly like they are moving in a sinistral direction. Some shear zones have a dextral sense of shear (El-Wahed and Hamimi, 2021). The ENS covers a region of about 100,000 km2, most of which is in southern Sinai, the Eastern Desert, and small parts of the Western Desert (El Gaby et al., 1990; Stern and Ali, 2020). The Arabian-Nubian Shield (ANS) holds significant importance and makes a substantial contribution to gold mining and prospecting activities in Egypt. The Neoproterozoic low-grade volcano-sedimentary nappes of the Central Eastern Desert (CED) in Egypt often surround several high-grade core complexes (Shalaby et al. 2005). The Barramiya region is in Egypt's Central-Eastern Desert (CED). It is between 24° 58′ and 25°00′ N and 33° 39′ and 33° 55′E, on the road between Idfu and Marsa-Alam (Fig. 1). El-Barramiya region in Egypt's Eastern Desert is a suitable area for mineral prospecting, especially gold mining. The geology of the studied region is part of the geology of the Red Sea highlands, which are largely made up of volcanic and basement rocks from the NS. The area is located in the northeast of the Barramiya-Um Salatit ophiolitic belt. It has moderate relief and surface outcrops of Neoproterozoic rock units such as ophiolites, island arc assemblages, metagabbro-diorite complexes, late intrusive granitic rocks, and Cretaceous Nubian sandstones. The area under study is the Mubarak–Barramiya shear belt. The Idfu-Marsa Alam Shear Zone is one of the different parts of the Mubarak-Barramiya Shear belt. The El-Barramiya area is one of the most important zones in the Mubarak-Hamash block where there is a lot of gold mining. According to the Conoco Coral of Egypt 1987, Fig. 1 illustrates the geological composition of the area at a scale of 1:500000. The region encompasses various rock units, ranging from the oldest to the youngest. These units include talc carbonate, ophiolitic serpentinite, and related rocks, metagabbro to metadiorite, ophiolitic basic metavolcanics, metasediments, calc-alkaline rocks, and sediments. The sedimentary rocks consist of the Quseir formation (Campainan age), Taref formation (Turonian age), and Wadi deposits (Quaternary). The ophiolitic mélange consists of many components, namely serpentine, talc-carbonate, and talc graphite. Additionally, carbonatized silicified ferrugenated derivatives that undergone tectonic absorption are also present within this assemblage. The serpentinites found in the Barramiya region are indicative of obducted oceanic slices on island-arc successions. They show the general ENE-WSW brittle-ductile shear zones of the area as long mountain ranges shaped like anticlinal and synclinal sheets (Ali-Bik et al. 2012). Serpentinite is the most common rock type in the ophiolite, and all serpentinite masses contain tectonic contacts and have suffered extensive brecciation and shearing. In the southwest part of the study region, metagabbro to metadiorite rocks intruded into the ophiolitic rocks. In the northern part of the region, another intrusion of calc-alkaline rocks cuts through the ophiolitic serpentinite. Ophiolitic metagabbros can be found dispersed throughout the ophiolitic mélange or as huge masses and hillocks that overlie serpentinite. Listvenite is rare in the study region, appearing as reddish-brown ridges, irregular lenses, and masses along shear zones and fault lines. Its resilience to weathering results in good relief characteristics (Abuamarah et al. 2024). The island-arc assemblages are widespread in the area and contain thrust contacts with ophiolitic rocks, particularly mélange and serpentinite. Rock types include metasediments, metavolcanics, and volcaniclastics. In the western part of the area, the unconformity can be observed by the non-conformity between the sedimentary rocks (Quseir and Taref Formations) and the basement rocks. There are several stages of deformation in the basement rocks of the Barramiya District, which create areas with high strain rates (Salem et al. 2014). These phases are the early phase, the second phase, and the third phase. Each one is shown by a different type of structure in the area. For example, folding (F1) shows the first phase, isoclinal and overturned folds (F2) show the second phase, and Rods, boudinage structure, mineral lineation, crenulations, and kink bands show the third phase (F3). When you put together different structural parts, you can see that the Barramiya area has undergone a complex history of deformation. El-Baramiya's auriferous veins strike in two directions: NE-SW (Saleh et al 2018). Gold,barr, and Chromite mineralizations were discovered in three zones of EL-Baramiya: quartz vein, listvenite alteration, and graphite schist. These zones are tectonized and highly strained, with sulphides, iron oxides (goethite), malachite, chlorite, talc, and calcite minerals (Salem et al 2014, Abdelrady et al., 2023a,b). The Barramiya gold mine, Bir El-Barramiya, and Wadi Beizah are the most important rocks in the suggested region.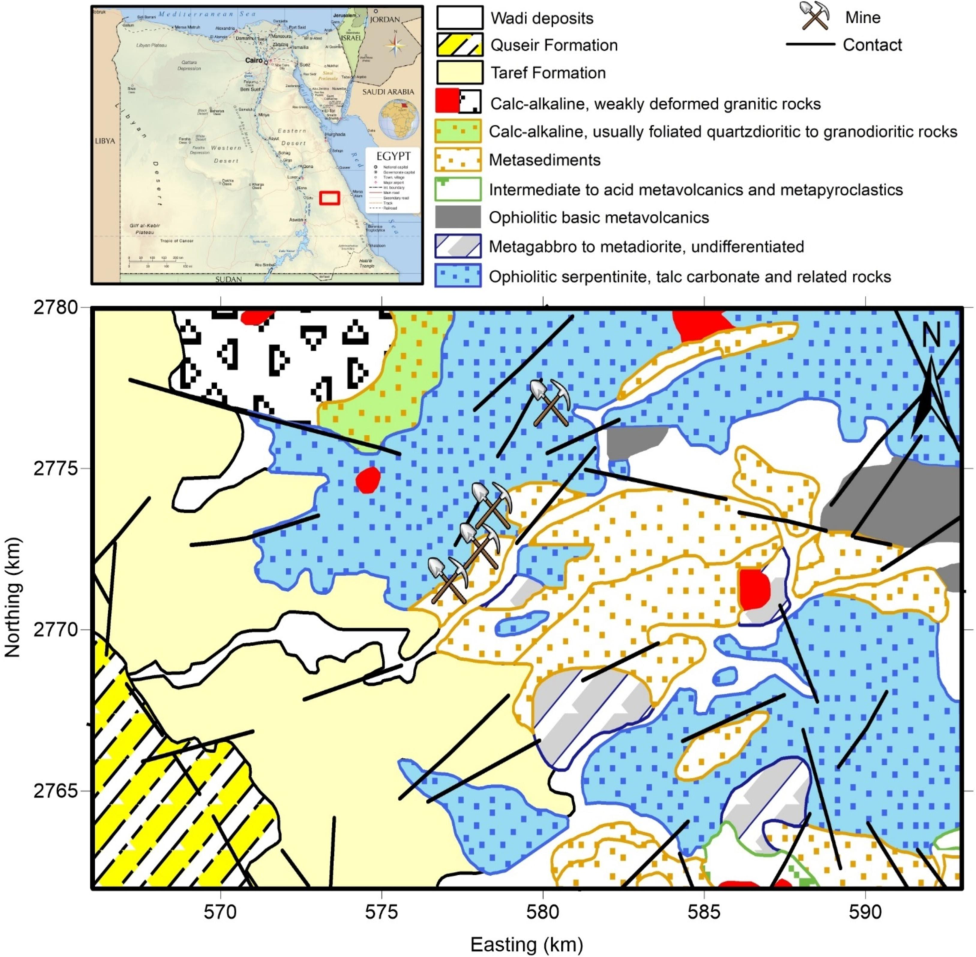
Geology map of the study area.
3 Data and methods
3.1 Data
The aeromagnetic data for the research region was generated through the process of digitization, wherein four sheets at a scale of 1:50,000 were converted into digital format using the Didger program. The mentioned segment of the Eastern Desert Aeromagnetic Survey was compiled and executed by Aero-Service in 1984. The flight lines had an azimuth of 45° and 225°, indicating their alignment in the northeast-southwest direction. The tie lines exhibited azimuths of 135° and 315°, with an approximate spacing of 10 km. The objects were aligned in a northwest to southeast direction. The surveying flights were carried out with an average terrain clearance of 120 m and an average ground speed ranging from 222 to 314 km/hr. The subsequent procedure entailed the process of creating a grid and subsequently exporting it in the (x, y, z) format. Following the digitization of the map using the Didger program, the data underwent preparatory measures for subsequent analysis. Specifically, the data was corrected for International Geomagnetic Reference Field (IGRF) parameters, incorporating an inclination of 32.8° North, a declination of 1.9° East, and a magnetic field strength of 42,425 nT. Finally, the production of the RTP map was completed, followed by the application of various edge detection techniques for processing.
3.2 Methods
3.2.1 Edge detection methods
Wijns et al. (2005) used the TM of the field F to show the edges. It normalizes the gradient amplitude by total gradient, and is defined as follows:
To improve the gradient amplitude in mapping the edges, Ferreira et al. (2013) proposed the TAHG method that is given by:
Ma et al. (2016) presented the STDX method that uses second-order derivatives. The filter is defined as:
To reduce the noise effect,
in Eq. (4) is computed using the Laplace equation:
Nasuti and Nasuti (2018) used the NTilt filter that uses the total gradient of the vertical gradient with different orders in the tilt angle. The filter is defined as:
Pham et al. (2019) used the LTHG method to map the boundaries. It is computed as:
Another detector is proposed by Pham et al. (2023), namely the THG-based edge detection filter (THGED). The method is defined as:
3.2.2 Depth detection method
Salem et al. (2007) presented a technique based on the tilt angle (TA) for computing the depth of contacts. The method is given by:
4 Results and discussion
4.1 Model studies
This section focuses on assessing the efficacy of the methods on a synthetic model that comprises five prisms (Fig. 3a). The parameters of the model are given in Table 1. The theoretical anomaly at the pole is depicted in Fig. 3b. Fig. 3c-3 h display the TM, TAHG, STDX, THGNTilt, LTHG, and THGED maps. The TM does not show the edges of body 1 clearly, and it generates some inaccurate boundaries. It is evident that other methods can determine the boundaries. However, the STDX and THGNTilt generate inaccurate boundary data around or above the given prisms, while the TAHG, LTHG, and THGED methods do not have this issue. In addition, the LTHG and THGED approaches offer high-resolution edges.
Parameters
1
2
3
4
5
Width (km)
6
14
10
10
10
Length (km)
6
14
10
10
10
Top depth (km)
1
2
1
2.5
4
Bottom depth (km)
2
4
3
4.5
6
Declination (rad)
0
0
0
0
0
Inclination (rad)
π/2
π/2
π/2
π/2
π/2
Magnetization (A/m)
0.5
3
1
−1
1
4.2 Interpreting aeromagnetic anomalies of the Barramiya area
A magnetic inclination of 32.8° and a declination of 1.9° were employed to account for the magnetic field during the airborne survey. These values were utilized to perform a reduction to the pole (RTP) on aeromagnetic data. The aeromagnetic map derived from the TMI data, as depicted in Fig. 2b of the RTP, clearly demonstrates the variation in magnetic intensity ranging from 1500 to −1000 nT. The majority of the magnetic anomalies, both positive and negative, exhibit an extension along the NE-SW, NW-SE, and N-S directions. The presence of positive magnetic anomalies within the studied region can be attributed to the higher concentration of Iron minerals found in various rock formations, including ophiolitic serpentinite, ophiolitic basic metavolcanic rocks, and metagabbro to metadiorite rocks. Conversely, the presence of negative magnetic anomalies may consistently be attributed to the low iron mineral concentration seen in various geological formations. These formations include metasediments, calk-alkaline rocks such as granitic rocks, quartzdiorite, and granodiorite rocks, as well as sedimentary rocks exemplified by the Quseir formation and Taref formation.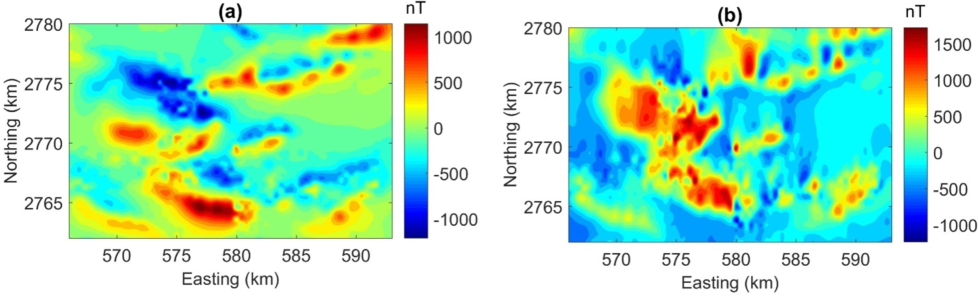
(a) TMI aeromagnetic data, (b) RTP aeromagnetic data.
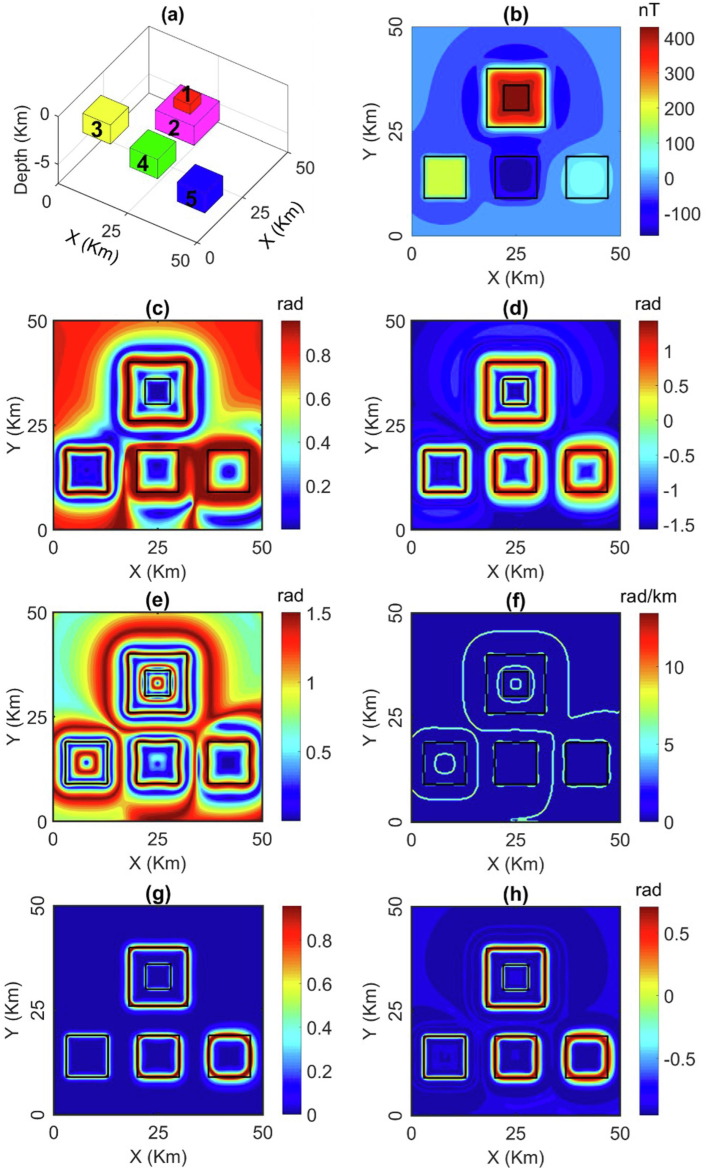
(a) Synthetic model, (b) synthetic magnetic data, (c) TM, (d) TAHG, (e) STDX, (f)THGNTilt, (g) LTHG, (h) THGED.
Previous research has demonstrated the imperative need of reducing the level of noise in the observed field prior to implementing edge enhancement approaches. In this research, we implemented a 100 m upward continuation filter to process the aeromagnetic data acquired over the Barramiya area. Fig. 4a displays the magnetic map that has been upward continued for a distance of 100 m. In order to facilitate the identification of deep sources, the aeromagnetic data of the study region (as shown in Fig. 4b) underwent an upward continuation filter of 500. The process of upward continuation involves the calculation of magnetic data that have been measured at an elevated position relative to the original observation plan during data collecting. The technique of upward continuation offers a reliable method for separating frequencies in magnetic data. This method is locally adaptive and produces a magnetic anomaly map that is more geologically interpretable compared to the use of fixed frequency and band pass filters (Weihermann et al., 2018).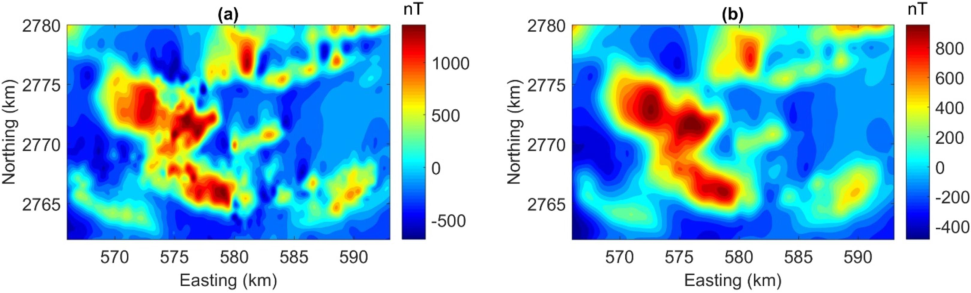
(a) 100 m upward continued RTP data, (b) 500 m upward continued RTP data.
Following the process of upward continuation, we proceeded to employ various analytical techniques, namely the TM, TAHG, STDX, THGNTilt, LTHG, and THGED, on magnetic data that had been upward continued to distances of 100 and 500 m. Fig. 5a-5f, display the outcomes obtained from the application of several methodologies, namely TM, TAHG, STDX, THGNTilt, LTHG, and THGED, on the 100 m upward-continued RTP aeromagnetic data. The employed methodologies exhibit reduced sensitivity towards fluctuations in the depth of magnetic structures, therefore yielding equitable representations of the structures within the designated study region. The maximum signal amplitudes serve as indicators for distinguishing between shallow and deep structures, hence emphasizing their respective borders. While the TM technique proves to be useful in normalizing magnetic data, it is important to note that its outcome exhibits a relatively poor resolution, as depicted in Fig. 5a. Furthermore, the establishment of artificial boundaries between sources is identified as a limitation of this technique, as discussed in the synthetic model. The TAHG exhibits better signal sharpness along the edges compared to the TM. This methodology effectively achieves signal equilibrium by effectively managing both low and high amplitude signals, while simultaneously mitigating the generation of artificial edges. Nevertheless, the resolution of the TAHG edges remains inadequate (Fig. 5b). The STDX and THGNTilt algorithms provide edge maps of excellent resolution, as seen in Fig. 5c and 5d. Nevertheless, as evidenced by the model studies, it has been observed that the STDX and THGNTilt maps may contain certain inaccuracies in terms of their representation of structures. The LTHG and THGED, like the STDX and THGNTilt, have demonstrated efficacy in producing high-resolution edges. Nevertheless, our theoretical investigations have demonstrated that these methodologies do not produce erroneous frameworks. The primary structural patterns observed from the LTHG and THGED datasets are oriented in the N-S, NE-SW and NW-SE directions. Upon doing a comparative analysis of these maps, it may be inferred that the LTHG and THGED methods exhibit potential advantages in identifying the geological structures that influence mineralization in the Barramiya region.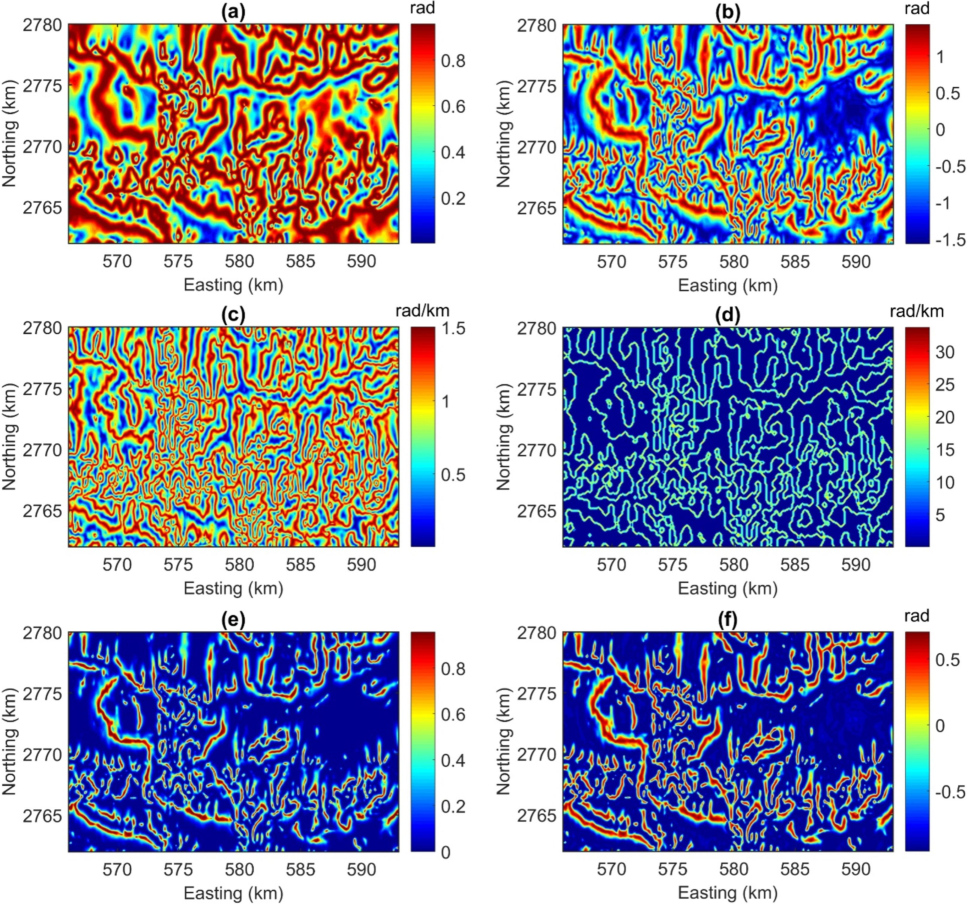
(a) TM, (b) TAHG, (c) STDX, (d)THGNTilt, (e) LTHG, (f) THGED of 100 m upward continued RTP data.
Fig. 6a and 6f show the results obtained from the use of the TM, TAHG, STDX, THGNTilt, LTHG, and THGED techniques to the 500 m-upward-continued RTP aeromagnetic data. Utilizing a higher level of upward continuation serves to successfully reduce the impact of noise and facilitate the accurate identification of deep sources. In this particular case, the TM, TAHG, LTHG, and THGED methodologies yielded more distinct outcomes related to the primary geological formations within the region, as opposed to the 100 m upward-continued RTP aeromagnetic data. The TM visually displays interconnected structures that could potentially be associated with the presence of false data in the edge map (Fig. 6a). Despite the high resolutions of the STDX and THGNTilt results, it is evident that the presence of incorrect information persists in the depicted maps (see Fig. 6c and 6d). The TAHG, LTHG, and THGED provide enhanced clarity in representing the structures compared to alternative methods. In contrast, the LTHG and THGED algorithms exhibited enhanced signal resolution along the borders of the source, as illustrated in Fig. 6b, 6e, and 6f. When doing a comparative analysis of the results derived from the upward continuation of 500 m RTP aeromagnetic data, it becomes evident that the LTHG and THGED maps remain the favored choices for identifying geological formations. The presented maps illustrate the existence of predominant N-S, NE-SW and NW-SE structural trends within the Barramiya region.
(a) TM, (b) TAHG, (c) STDX, (d)THGNTilt, (e) LTHG, (f) THGED of 500 m upward continued RTP data.
We employed the tilt depth to calculate the depth values of the magnetic structures within the designated study region. Fig. 7a and 7b depict the depth solutions and their corresponding histogram, respectively. It is evident that the depth to the magnetic sources ranges from 0 to 800 m with an average of 175 m. The histogram demonstrates that the majority of magnetic sources in the Barramiya region exhibit a depth of less than 500 m. To facilitate a comparative analysis, we juxtaposed the edges derived from the LTHG and the THGED techniques onto the tilt depth map, as depicted in Fig. 8a and 8b, respectively. It is evident that the structures depicted in the LTHG and THGED maps exhibit a reasonable degree of correspondence with the depth solutions derived from the tilt depth approach. It is worth mentioning that the majority of structural boundaries derived from the upward continuation of 500 m RTP aeromagnetic data (as shown in Fig. 8b) are also observed in the structural map acquired from the upward continuation of 100 m RTP data (as presented in Fig. 8a). The reasoning behind this is that the LTHG and THGED possess the capability to accurately represent and analyze various structures situated at varying depths. Many gold occurrences with gold-bearing quartz veins may be found in the El-Baramiya region; the majority of them are found in the El-Baramiya—Umm Salatit belt, which faces northeasterly. The El-Baramiya deposits are part of a vein-type gold arsenic mineralization that is close to chromite, magnesite, and antimony ores. El-Baramiya's auriferous veins strike both ENE-WSW and NE-SW orientations. Three zones within EL-Baramiya were identified as having Au, Cu, and Cr mineralizations: quartz vein, listwanite alteration, and graphite schist. These zones contain portions that are highly strained and tectonized, and are rich in sulphides, iron oxides (goethite), and malachite, as well as minerals such as chlorite, talc, and calcite (propylitic alteration) (Salem et al. 2014). Five significant sets of structural trends affected the research area: ENE-WSW, NE-SW, NW-SE, NNW-SSE, and E-W. These structural lineaments were inferred using geological, ASTER RS, and aircraft magnetic geophysical data. These formations were crucial in the movement of mineral-rich hydrothermal fluids to the surface or near the surface where they precipitated as ores in the El-Bakriya-El-Barramiya (El-Qassas et al. 2023). The structural architecture of the Barramiya was depicted in a comprehensive interpreted structural map (Fig. 9), which was created based on the LTHG and THGED findings. The prevailing structural patterns deduced from the examination of lineament magnetic analysis consist of N-S, NE-SW and NW-SE directions. These structures have had a major impact on the structural framework of the Barramiya area.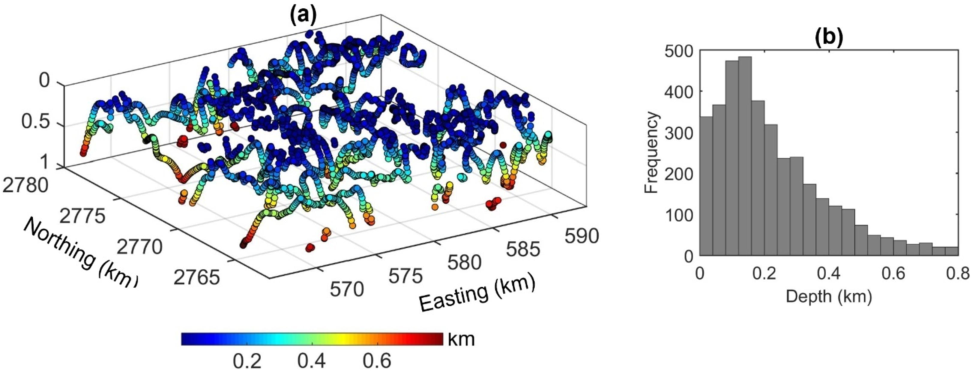
(a) Depth solutions, (b) Histogram of depth solutions.
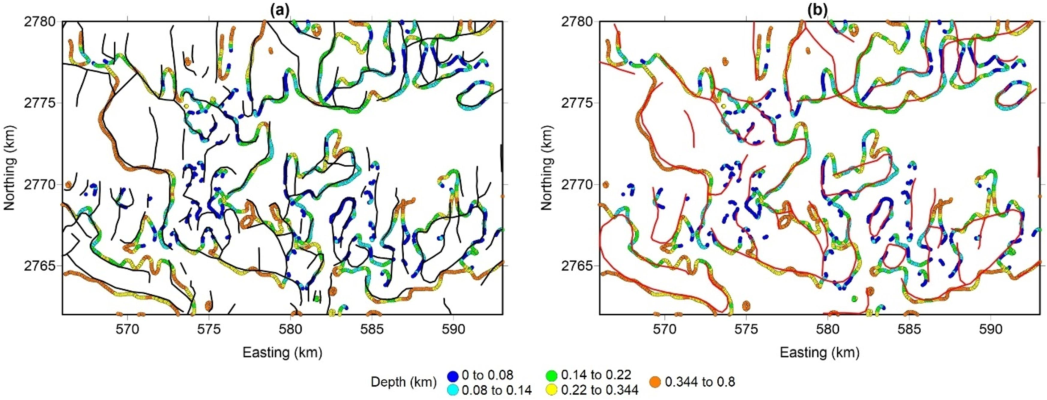
(a) Lineaments interpreted from the LTHG and THGED results of 100 m upward continued RTP data, (b) Lineaments interpreted from the LTHG and THGED results of 500 m upward continued RTP data.
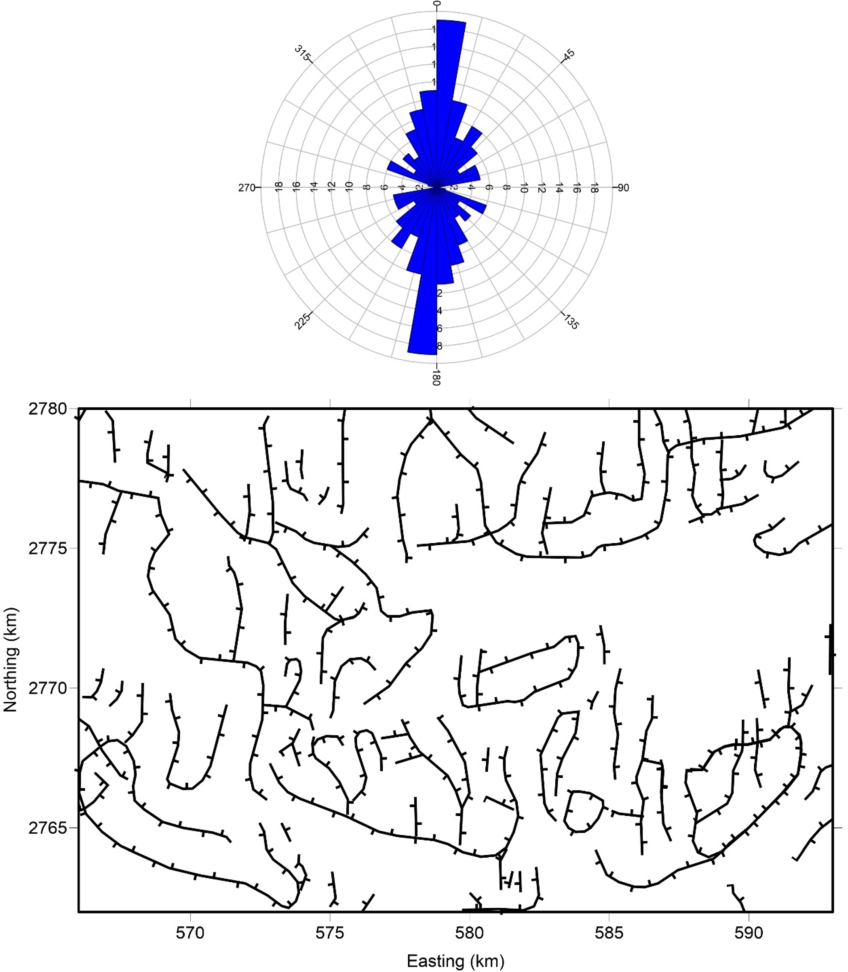
Lineaments interpreted from the results in Fig. 8 and their rose diagram.
5 Conclusion
For the first time, aeromagnetic data from the Barramiya area has been used to make a model of the structural framework that shapes the mineralization in the area. We have used advanced methods like the theta map (TM), tilt angle of the gradient amplitude (TAHG), second normalized gradient amplitude (STDX), gradient amplitude of NTilt (THGNTilt), logistic function of the gradient amplitude (LTHG), and gradient amplitude-based edge detection (THGED) to find the lineaments. The advantages of these methods are that they can enhance both shallow and depth sources, however, the use of the TM and THGNTilt may bring some additional edges. The tilt depth method has been used to figure out the depths of the lineaments. Some important patterns were found in the magnetic interpretations. The lineament trends were mostly in the N-S, NE-SW, and NW-SE directions. Also, we could see that most of the magnetic sources in the Barramiya area are not more than 500 m deep. The predicted depths for shallow and deep structures are consistent with those reported in the published literature. The linear features running north–south, northeast-southwest, and northwest-southeast are associated with African orogeny. The results also showed that the methods used to improve and find the depth of the rocks in this study have made a huge difference in our knowledge of the Barramiya area's structural and geological framework.
CRediT authorship contribution statement
Mohamed Abdelrady: Writing – review & editing, Writing – original draft, Software, Resources, Methodology, Investigation, Formal analysis, Data curation, Conceptualization. Luan Thanh Pham: Writing – review & editing, Writing – original draft, Resources, Methodology, Data curation, Conceptualization. Ahmed Mohamed: Validation, Project administration, Investigation, Formal analysis, Conceptualization. Saad S. Alarifi: Funding acquisition, Formal analysis, Data curation, Conceptualization. Van Hao Duong: Data curation, Conceptualization. Musaab A.A. Mohammed: Formal analysis.
Acknowledgment
This research was supported by Researchers Supporting Project number (RSP2024R496), King Saud University, Riyadh, Saudi Arabia.
Declaration of competing interest
The authors declare that they have no known competing financial interests or personal relationships that could have appeared to influence the work reported in this paper.
References
- Curie point depth beneath the Barramiya–Red Sea coast area estimated from spectral analysis of aeromagnetic data. J. Asian Earth Sci.. 2012;43(1):254-266.
- [Google Scholar]
- Geophysical investigations for the identification of subsurface features influencing mineralization zones. Journal of King Saud University-Science. 2023;102809
- [Google Scholar]
- “Orogenic lode-gold deposits and listvenization processes in the El-Barramiya area, Eastern Desert. Egypt. Environ. Earth Sci.. 2023;82:420.
- [Google Scholar]
- Magnetic interpretation using a least-squares, depth-shape curves method. Geophysics. 2005;70(3):L23-L30.
- [Google Scholar]
- Geochemistry and petrology of metapyroxenite and metagabbro associated with Neoproterozoic serpentinites in the Arabian-Nubian Shield: fragments of a fore-arc ophiolite. Int. J. Earth Sci. 2024:1-20.
- [Google Scholar]
- Serpentinite-hosted talc–magnesite deposits of Wadi Barramiya area, Eastern Desert, Egypt: Characteristics, petrogenesis and evolution. J. Afr. Earth Sc.. 2012;64:77-89.
- [Google Scholar]
- Analytic signals of gravity gradient tensor and their application to estimate source location. Geophysics. 2010;75(6):I59-I74.
- [Google Scholar]
- Edge enhancement of potential-field data using normalized statistics. Geophysics. 2008;73(3):H1-H4.
- [Google Scholar]
- Cordell, L. and V. Grauch (1985). Mapping basement magnetization zones from aeromagnetic data in the San Juan Basin, New Mexico. The utility of regional gravity and magnetic anomaly maps, Society of Exploration Geophysicists: 181-197.
- On the effectiveness of directional derivative based filters on gravity anomalies for source edge approximation: synthetic simulations and a case study from the Aegean graben system (Western Anatolia, Turkey) J Geophys Eng.. 2013;10(3):035005
- [Google Scholar]
- Enhancing linear features in aeromagnetic data using directional horizontal gradient at Wadi Haimur area, South Eastern Desert, Egypt. Carpathian J. Earth Environ. Sci.. 2020;15(2):323-326.
- [Google Scholar]
- The basement complex of the Eastern Desert and Sinai. In: Said R., ed. The Geology of Egypt. Rotterdam: Balkema; 1990. p. :175-184.
- [Google Scholar]
- Delineation of hydrothermal alteration zones associated with mineral deposits, using remote sensing and airborne geophysics data. A case study: El-Bakriya area, Central Eastern Desert, Egypt. Acta Geod. Geophys.. 2023;58(1):71-107.
- [Google Scholar]
- Neoproterozoic tectonic events of Egypt. Acta Geologica Sinica‐english Edition. 2021;95(4):1366-1405.
- [Google Scholar]
- Magnetic data profiles interpretation for mineralized buried structures identification applying the variance analysis method. Pure Appl. Geophys.. 2021;178:973-993.
- [Google Scholar]
- Aeromagnetic and radiometric data interpretation to delineate the structural elements and probable Precambrian mineralization zones: a case study, Egypt. Min. Metall. Explor.. 2022;39(6):2461-2475.
- [Google Scholar]
- Magnetic interpretation utilizing a new inverse algorithm for assessing the parameters of buried inclined dike-like geological structure. Acta Geophys.. 2019;67:533-544.
- [Google Scholar]
- Enhancement of the total horizontal gradient of magnetic anomalies using the tilt angle. Geophysics. 2013;78(3):J33-J41.
- [Google Scholar]
- Lithological mapping in the Eastern Desert of Egypt, the Barramiya area, using Landsat thematic mapper (TM) J. Afr. Earth Sc.. 2006;44(2):196-202.
- [Google Scholar]
- Large-scale geological structures of the Egyptian Nubian Shield. Sci Rep. 2023;13:1923.
- [Google Scholar]
- High-resolution detection of geologic boundaries from potential-field anomalies: An enhanced analytic signal technique. Geophysics. 1996;61(2):373-386.
- [Google Scholar]
- AeromagneticImaged Basement Fault Structure of the Eastern Tarim Basin and Its Tectonic Implication. Front. Earth Sci.. 2022;9:825498
- [Google Scholar]
- Paleo-Asian oceanic crust trapped by irregular continental margin contributes to continental growth: Evidence from airborne gravity and magnetic imaging across the Alxa tectonic belt, Central Asia. Gondw. Res.. 2023;121:147-167.
- [Google Scholar]
- Step-edge detection filters for the interpretation of potential field data. Pure Appl. Geophys.. 2016;173:795-803.
- [Google Scholar]
- Geological And Geophysical Studies Of El-Barramiya Gold Mine Area. Eastern Desert: Egypt, Faculty of Science, Assiut University; 2013.
- Potential field tilt—a new concept for location of potential field sources. J. Appl. Geophys.. 1994;32(2–3):213-217.
- [Google Scholar]
- Detection of Mineralization Zones Using Aeromagnetic Data. Appl. Sci.. 2022;12(18):9078.
- [Google Scholar]
- The analytic signal of two-dimensional magnetic bodies with polygonal cross-section – its properties and use for automated anomaly interpretation. Geophysics. 1972;37(3):507-517.
- [Google Scholar]
- NTilt as an improved enhanced tilt derivative filter for edge detection of potential field anomalies. Geophys. J. Int.. 2018;214(1):36-45.
- [Google Scholar]
- Edge enhancement of potential field data using the logistic function and the total horizontal gradient. Acta Geod. Geophys.. 2019;54:143-155.
- [Google Scholar]
- Determination of subsurface lineaments in the Hoang Sa islands using enhanced methods of gravity total horizontal gradient. Vietnam J. Earth Sci.. 2022;44(3):395-409.
- [Google Scholar]
- A novel approach for enhancing potential fields: application to aeromagnetic data of the Tuangiao. Vietnam. Eur. Phys. J. plus. 2023;138(12):1134.
- [Google Scholar]
- An effective edge detection technique for subsurface structural mapping from potential field data. Acta Geophys. 2023;72:1661-1674.
- [Google Scholar]
- Reliable Euler deconvolution solutions of gravity data throughout the β-VDR and THGED methods: Application to mineral exploration and geological structural mapping. Vietnam J. Earth Sci.. 2024;46(3):432-448.
- [Google Scholar]
- An improved edge detector for interpreting potential field data. Earth Sci. Inform 2024
- [CrossRef] [Google Scholar]
- A stable method for detecting the edges of potential field sources. IEEE Trans. Geosci. Remote Sens.. 2024;62:5912107.
- [Google Scholar]
- Subsurface structural features of the basement complex and mineralization zone investigation in the Barramiya area, Eastern Desert of Egypt, using magnetic and gravity data analysis. Arab. J. Geosci.. 2018;11:1-14.
- [Google Scholar]
- Tilt-depth method: A simple depth estimation method using first-order magnetic derivatives. Lead. Edge. 2007;26(12):1502-1505.
- [Google Scholar]
- Exploration of new gold occurrences in the alteration zones at the Barramiya District, Central Eastern Desert of Egypt using ASTER data and geological studies. Arab. J. Geosci.. 2014;7:1717-1731.
- [Google Scholar]
- The Wadi Mubarak belt, Eastern Desert of Egypt: a Neoproterozoic conjugate shear system in the Arabian–Nubian Shield. Precambr. Res.. 2005;136(1):27-50.
- [Google Scholar]
- Crustal evolution of the Egyptian Precambrian rocks. The Geology of Egypt 2020:131-151.
- [Google Scholar]
- A Well-Structured Metaheuristic Optimization Technique for Magnetic Data Inversion of 2D Dipping Dyke-like Geological Structures Using the Cuckoo Optimization Algorithm. Arab. J. Sci. Eng. 2024:1-10.
- [Google Scholar]
- Magnetic interpretation of the Paranaguá Terrane, southern Brazil by signum transform. J. Appl. Geophys.. 2018;154:116-127.
- [Google Scholar]
- Listvenite–lode association at the Barramiya gold mine, Eastern Desert, Egypt. Ore Geol. Rev.. 2011;39(1–2):101-115.
- [Google Scholar]


