

Translate this page into:
Analysis on piezoelectric energy harvesting small scale device – a review
⁎Corresponding author. sharma786pramod@gmail.com (Pramod Kumar Sharma),
-
Received: ,
Accepted: ,
This article was originally published by Elsevier and was migrated to Scientific Scholar after the change of Publisher.
Peer review under responsibility of King Saud University.
Abstract
Due to advancement of auto regulated powered wireless sensors systems; piezoelectric pulsation energy harvesters (PVEHs) have received a significant attention. Though, a popular of these devices has very low input frequencies. This paper seeks to analyze the current method to harness energy from vibration using piezoelectric setup in the low range of frequency zone and demonstrate an experiment model to validate the results from the setup. Many reviewers have given different modelling approach to optimize the performance parameter such as mass ratio, damping constant, frequency, load resistance, electromechanical coupling constant and capacitance etc. Finally, it has been found from experimentally and simulation that the maximum power harvested from the piezoelectric vibration setup depends upon the maximum deflection of the beam subjected to many dynamic constraint parameters such as inertia of the beam, maximum lift force due to wind, and lift drag characteristics curve etc.
Keywords
Aeroleastic vibration
Reduced velocity
MEMS
IDTE
PZT

1 Introduction
Due to the problem of global warming in the whole world, many researchers had focused their area towards eco friendly energy harvesting technique such as solar, wind, hydra and biomass etc. Now days the principle of energy harvesting from aero elastic vibration had become a key issue to supply power for small scale electronic device in remote sensing area. Many of the researchers have worked on the low power consumption electronic device such as actuator, MEMS (Zhang and Wang, 2016; Muralt, 2000; Zhou et al., 2005), the monitoring devices (Roundy and Wright, 2004; Inman and Grisso, 2006) for health checkup and the high costly battery replacement device (Capel et al., 2003) etc. Zhang and Wang (2016) obtained the maximum power harvested from Piezoelectric device at a reduced velocity U∗ = 5 and Resonating frequency at f = 26.37 Hz, while Bischur and Schwesinger (2013) harvested the maximum power from Piezoelectric device at the thickness t = 0.15 mm and Resonating frequency at f = 2 Hz. Shukla et al. (2010) extended the work in the field of piezoelectric energy harvesting and got the Maximum power harvested from Piezoelectric device at the thickness t = 0.0.005 mm and Resonating frequency at f = 2 Hz. Li et al. (2011) harvested the Maximum power from Piezoelectric device at the thickness t = 0.41 mm and Resonating frequency at f = 3 Hz (Renaud et al., 2009) harvested the Maximum power from Piezoelectric device at the thickness t = 0.8 mm and Resonating frequency at f = 1 Hz (Platt et al., 2005) harvested the Maximum power from Piezoelectric device at the thickness t = 2 cm and Resonating frequency at f = 1 Hz (Yuan et al., 2008) harvested the Maximum power from Piezoelectric device at the thickness t = 0.3 mm and Resonating frequency at f = 20 Hz (Dhakar et al., 2013) harvested the Maximum power from Piezoelectric device at the thickness t = 0.51 mm and Resonating frequency at f = 36 Hz (Sodano et al., 2003) harvested the Maximum power from Piezoelectric device at the thickness t = 0.27 mm and Resonating frequency at f = 50 Hz (Erturk et al., 2008) harvested the Maximum power from Piezoelectric device at the thickness t = 0.5 mm and Resonating frequency at f = 1744 Hz (Xu et al., 2012) harvested the Maximum power from Piezoelectric device at the thickness t = 1 mm and Resonating frequency at f = 102 Hz (Hwang et al., 2014) harvested the Maximum power from Piezoelectric device at the thickness t = 0.00084 mm and Resonating frequency at f = 0.3 Hz. Meninger et al. suggested a technique to harness mechanical vibration into electrical energy and obtained the power density around 3.8 µW/cm3 Roundy et al. constructed a MEMS device to harness electrostatic energy and obtained the power density around 1160 µW/cm3 at 120 Hz. Williams’s et al. fabricated a micro generator with dimension 5 × 5 × 1 mm3 based on the electromagnetic induction principle by assuming of the deflection of the structure is 50 µm.
El-hami et al. constructed an energy harvesting device from vibration and produce the electricity of 4167 µW/cm3 and 320 Hz. Ching et al. modeled a spring based on laser micro machined technique to harness vibrating energy into electrical one and obtained the power output around 830 µW/cm3 and 60–100 frequency at 1 KΩ resistance. Xiaobiao Shan et al. harvested power from MFC (macro fiber composite) at the water velocity of 0.5 m/s Leland and Wright developed a prototype based on simple supported bimorph vibration energy harvesting method and obtained the power output around 300–400 µW at 200–250 Hz.
2 Brief review on piezoelectric energy harvesting set up
As the performance of the figuring has risen progressively, batteries have given a sharp growth over the past period. Priya (2007) and Roundy et al. (2003) had obtained the resulted power density around 15000 µW/cm3 from direct sunlight of solar cells compare to other sources. Roundy et al. (2003) acquired the power density 150 µW/cm3on cloudy days. Thus, the solar cell is impractical to install specifically in the embedded applications due to unavailability of absence of light and obstruction from the particles (Beeby et al., 2006; Venkatasubramanian et al., 2001; Riffat and Ma, 2003) used a thermoelectric generator based on the See beck effect to convert the thermal energy to electrical energy. A thermoelectric device generates a voltage due to temp. Huidong et al. (2014) worked on different piezoelectric configurations with digitized electrodes to optimize power output as shown in Fig. 1. While Kim (2012) extended his work in {3–1} and {3–3} as shown in Figs. 2 and 3 mode of Difference on it and vice versa known as Peltier effect (Ching et al., 2002). A review work was carried out on the power obtained from the human activities such as human blood pressure, motion of the arm, heat of the body and typing (Starner, 1996, 2004). Joseph et al. (2005) suggested that the power of amount 7 W can be harvested from the single foot of human of weight 154 pound. Cook-Chennault et al. (2008), Beeby et al. (2006), Joseph et al. (2005), Kymissis et al. (1998), and Sodano et al. (2004) had used the piezoelectric material beneath a running sneaker’s to harness the energy. Reviews have been done by Cook-Chennault et al. (2008), Beeby et al. (2006) and Sodano et al. (2004) on the issue regarding energy harvesting from piezoelectric form human walking. This concept of energy harvesting has been further extended, planned and applied in the ocean energy from flexible piezoelectric membranes. Sarkar et al. (2014) had worked on extreme wind climate modeling in Indian region while Sarkar et al. (2017) studied different models on Weibull methods in different region in India. Now a day’s Macro (Schmidt, 1992; Myers et al., 2007) and micro wind turbines (Cook-Chennault et al., 2008) are available to harness wind energy. Priya (2007) compared the different sources of power in sensor’s network circuit. The reviews on small scale power supplies for MEMS devices can be extracted in Cook-Chennault et al. (2008). It is the property of piezoelectric material the electric charge or voltage can be produced when the mechanical force is applied on it.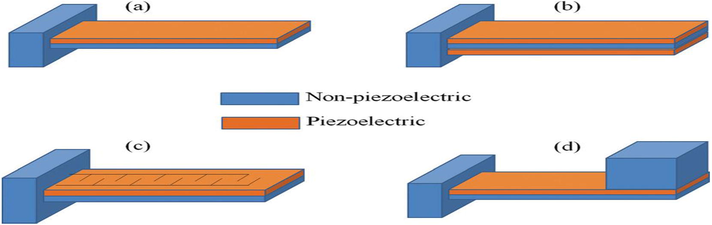
Various arrangements of piezoelectric cantilevers beams: (a) unimorph; (b) bimorph; (c) a piezoelectric cantilever with inter digitised electrodes; (d) a piezoelectric cantilever with proof mass at its free end (Huidong et al., 2014).
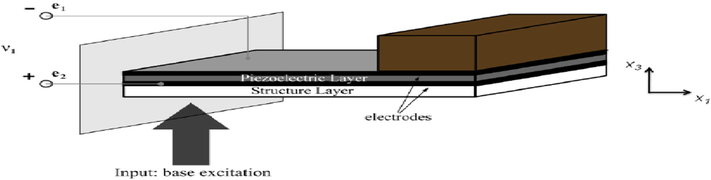
Unimorph cantilevered piezoelectric energy harvester device in {3–1} mode of operation with standard electrode configuration. Note asymmetric layers and the need for a “structural” layer (Kim, 2012).
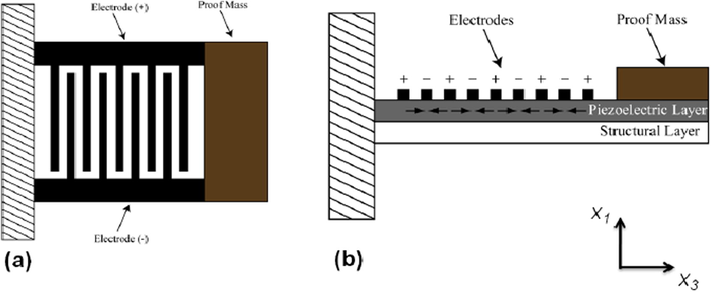
Inter digitized electrode (IDTE) configuration in cantilevered piezoelectric energy harvesting {3–3} mode devices: (a) top-view and (b) side-view (Kim, 2012).
Max. Power obtained from vortex vibration is 40 W/m2 at 10 m/s at an optimum value of and
and the corresponding frequency is 2 Hz Max. Power obtained from vortex vibration is 10 µW, at R = 100 Ω and v = 1.8 to 4.3 m/s at an optimum value of m∗ = 30 and
f = 11 Hz. Max. Power obtained from vortex vibration at 5.20 to 6.67 m/s. The frequency of the vibrating vortex system is found to be 15.70 Hz Marzencki et al. suggested a technique to harness mechanical vibration into electrical energy and obtained the power density around 10 µW/cm3 at 204 Hz. Jeon et al. suggested a technique to harness mechanical vibration into electrical energy and obtained the power density around 37037 µW/cm3 13.9 k Hz. Fang et al. suggested a technique to harness mechanical vibration into electrical energy and obtained the power density around 10846 µW/cm3 608 Hz Marzencki et al. suggested a technique to harness mechanical vibration into electrical energy and obtained the power density around 3560 µW/cm3 1368 Hz Renaud et al. (Fig. 4) Suggested a technique to harness mechanical vibration into electrical energy and obtained the power density around 21680 µW/cm3 1.8 k Hz. Goushcha et al. (2015) conducted an experiment in a Wind Tunnel on the different configurations of the beam with specified piezoelectric material. The output voltage of the beam was measured at different locations from the wall at zero pitch and roll angles. Mannini et al. (2016) had done an experiment to understand the interaction with the two excitation and four regimes of VIV galloping and found the high value of mass damping for decoupling the excitation of vortex induced vibration.
A schematic diagram of single cantilever piezoelectric model.
Amini et al. (2017) prepared a multi load piezo electric beam setup of a rectangular section as shown in Fig. 5 and De Giuseppe et al. (2017) with a proof mass at the end shown in Figs. 6 and 7 respectively. Fig. 8 shows the actual set up of dual coupled cantilever based PVEH system (Shan, 2015) while in Fig. 9 for a single cantilever beam (De Giuseppe et al., 2017).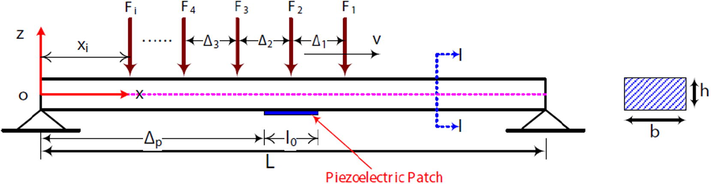
Unimorph piezoelectric model with multi loads (Amini et al., 2017).
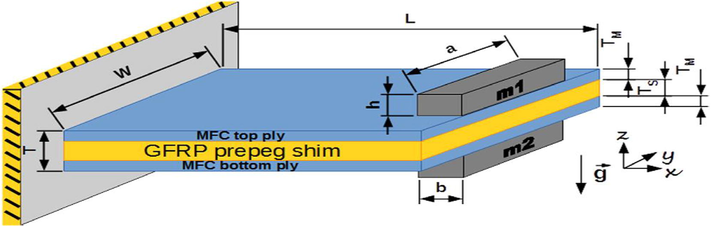
A piezoelectric cantilever model (De Giuseppe et al., 2017).
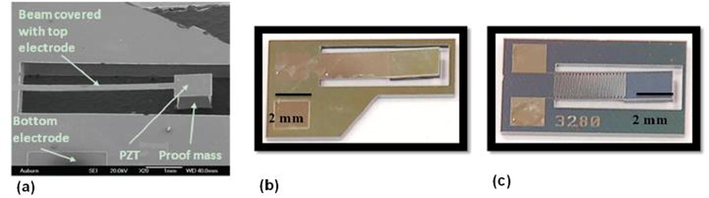
Fabricated, unimorph, MEMS-scale PVEH: (a) SEM image and (b) optical image of a MEMS-scale PZT cantilever in {3–1} mode with a proof mass, (c) optical image of a MEMS-scale PZT cantilever with a proof mass in {3–3} mode with IDTEs (De Giuseppe et al., 2017).
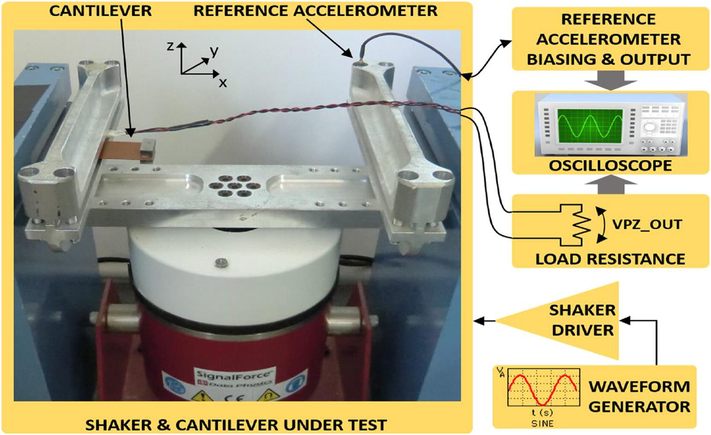
a) Schematic drawing and (b) actual experimental setup of dual coupled cantilever based PVEH system (Shan, 2015).
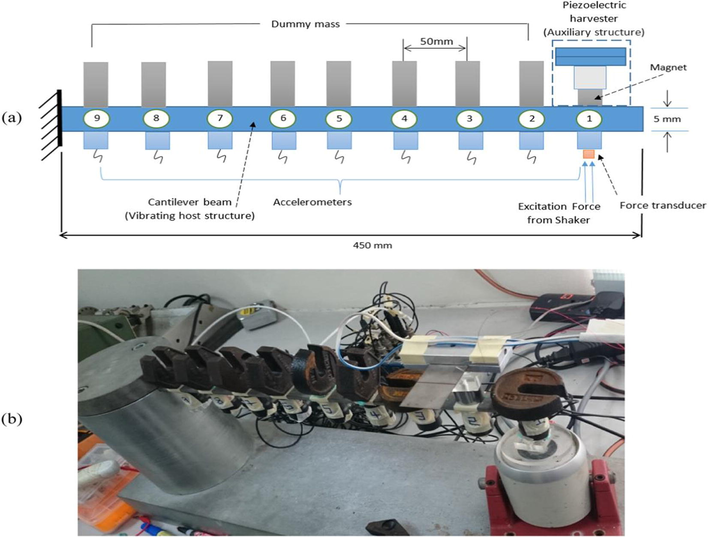
Experimental set up by De Giuseppe et al. (2017) for a cantilever beam.
3 Modeling and experiment of piezoelectric vibrating energy harvesting system with or without proof mass
The lattice structure and phase diagram of Lead Zirconate Titanate has been shown in Figs. 10 and 11. The equations for an unbounded piezoelectric material are Muralt (2000)
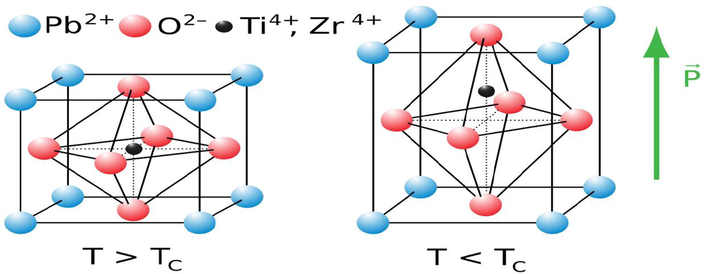
Lead Zirkonate Tiatnate (https://en.wikipedia.org/wiki/Lead_zirconate_titanate#/media/File:Perovskite.svg).
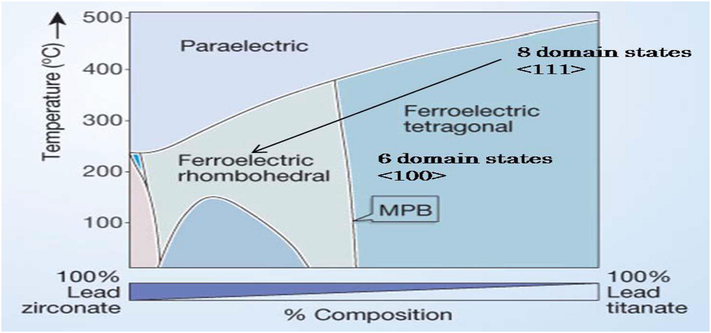
Phase Diagram OF PZT (https://en.wikipedia.org/wiki/Lead_zirconate_titanate#/media/File:Perovskite.svg).
Soderkvist (1991) had used two method of solving the problem of piezoelectric for a cantilever beam one is based on energy and the other is force equilibrium. Hagood et al. (1990) developed a formulation for actuators and duToit and Wardle (2007) for energy. As per the law of conservation of energy if the kinetic energy (Tk), potential energy (U), electrical energy (We) and W is the external work done. Then
All the terms are explained as
where Vp is the volume of piezoelectric material, Vs if for beam, is the of strutural beam, is the density of piezomaterial.
4 Conclusion
In this paper a comprehensive review has been presented on the mechanical energy to electrical energy conversion including theory, different methods of design and application. Several energy harvesting had discussed with the corresponding energy harvesting configurations with different materials and types. The amount of energy harvesting from piezoelectric set up depends upon several extrinsic and intrinsic factor which are tabulated in the above tables (Tables 1–5). *Comments: Table 2 shows the variation of power output with the frequency of the vibrating system. *Comments: shows the variation of the power output with the size of the device, load and flow velocity. *Comments: Comparative analysis of different piezoelectric materials properties.
References
Frequency in Hz
Power output (Max.)
Thickness of the piezoelectric material in mm
Year
Conclusion
Zhang and Wang (2016)
26
0.0007 µW
0.2 mm
2016
Maximum power harvested from Piezoelectric device at a reduced velocity U* = 5 and Resonating frequency at f = 26.37 Hz
Bischur and Schwesinger (2013)
2
2 µW
0.15 cm
2010
Maximum power harvested from Piezoelectric device at the thickness t = 0.15 mm and Resonating frequency at f = 2 Hz
Shukla et al. (2010)
2
0.005 µW
0.0005 mm
2010
Maximum power harvested from Piezoelectric device at the thickness t = 0.0.005 mm and Resonating frequency at f = 2 Hz
Li et al. (2011)
3
610 µW
0.41 mm
2011
Maximum power harvested from Piezoelectric device at the thickness t = 0.41 mm and Resonating frequency at f = 3 Hz
Renaud et al. (2009)
1
47 µW
0.8 mm
2009
Maximum power harvested from Piezoelectric device at the thickness t = 0.8 mm and Resonating frequency at f = 1 Hz
Platt et al. (2005)
1
265 µW
2 cm
2005
Maximum power harvested from Piezoelectric device at the thickness t = 2 cmand Resonating frequency at f = 1 Hz
Yuan et al. (2008)
20
2000 µW
0.3 mm
2008
Maximum power harvested from Piezoelectric device at the thickness t = 0.3 mm and Resonating frequency at f = 20 Hz
Dhakar et al. (2013)
36
10 µW
0.51 mm
2013
Maximum power harvested from Piezoelectric device at the thickness t = 0.51 mm and Resonating frequency at f = 36 Hz
Sodano et al. (2003)
50
30000 µW
0.27 mm
2003
Maximum power harvested from Piezoelectric device at the thickness t = 0.27 mm and Resonating frequency at f = 50 Hz
Erturk et al. (2008)
1744
14.7 µW
0.5 mm
2008
Maximum power harvested from Piezoelectric device at the thickness t = 0.5 mm and Resonating frequency at f = 1744 Hz
Xu et al. (2012)
102
3700 µW
1 mm
2012
Maximum power harvested from Piezoelectric device at the thickness t = 1 mm and Resonating frequency at f = 102 Hz
Hwang et al. (2014)
0.3
6.7 µW
0.00084 mm
2014
Maximum power harvested from Piezoelectric device at the thickness t = 0.00084 mm and Resonating frequency at f = 0.3 Hz
References
Year
Power output
Frequency in Hz
Conclusion remarks
Meninger et al. (2001)
2001
3.8 µW/cm3
–
Meninger et al. suggested a technique to harness mechanical vibration into electrical energy and obtained the power density around 3.8 µW/cm3
Roundy et al. (2002)
2002
1160 µW/cm3
120
Roundy et al. constructed a MEMS device to harness electrostatic energy and obtained the power density around 1160 µW/cm3 at 120 Hz.
Williams and Yates (1995)
1995
40 µW/cm3
4000 µW/cm3
70
330Williams’s et al. fabricated a micro generator with dimension 5 × 5 × 1 mm3 based on the electromagnetic induction principle by assuming of the deflection of the structure is 50 µm.
El-hami et al. (2001)
2001
4167 µW/cm3
320
El-hami et al. constructed an energy harvesting device from vibration and produce the electricity of 4167 µW/cm3 and 320 Hz.
Ching et al. (2002)
2002
830 µW/cm3
60–100
Ching et al. modeled a spring based on laser micro machined technique to harness vibrating energy into electrical one and obtained the power output around 830 µW/cm3 and 60–100 frequency at 1 kilo ohm resistance.
Shan et al. (2015)
2015
1.1 mW/m2
–
Xiaobiao Shan et al. harvested power from MFC (macro fiber composite) at the water velocity of 0.5 m/s
Shen et al. (2009) and Dongna et al. (2008)
2009
416 μW/cm3
183.8
Shen et al. designed a low frequency multilayer PZT energy harvesting model and obtained the power density 416 μW/cm3 at 183.8 resonating frequency.
Eli and Paul (2006)
2006
300–400 µW
200–250
Leland and Wright developed a prototype based on simple supported bimorph vibration energy harv
esting method and obtained the power output 300–400 µW at 200–250 Hz.
Barrero-Gil (2010)
2010
40 w/m2
2
Max. Power obtained from vortex vibration is 40 W/m2 at 10 m/s at an optimum value of and = 0.1 and the corresponding frequency is 2 Hz.
Hobbs and Hu (2012)
2012
10 µW
11
Max. power obtained from vortex vibration is 10 µW, at R = 100 Ω and v = 1.8 to 4.3 m/s at an optimum value of m* = 30 and = 0.072 f = 11 Hz
Zhao et al. (2015)
2015
1.73 mW
15.70
Max. Power obtained from vortex vibration at 5.20 to 6.67 m/s. The frequency of the vibrating vortex system is found to be 15.70 Hz.
Marzencki et al. (2005)
2005
10 µW/cm3
204
Marzencki et al. suggested a technique to harness mechanical vibration into electrical energy and obtained the power density around 10 µW/cm3 at 204 Hz.
Jeon and Sood (2005)
2005
37037 µW/cm3
13.9 k
Jeon et al. suggested a technique to harness mechanical vibration into electrical energy and obtained the power density around 37037 µW/cm3 13.9 kHz.
Fang et al. (2006)
2006
10846 µW/cm3
608
Fang et al. suggested a technique to harness mechanical vibration into electrical energy and obtained the power density around 10846 µW/cm3 608 Hz
Marzencki et al. (2007)
2007
3560 µW/cm3
1368
Marzecki et al. suggested a technique to harness mechanical vibration into electrical energy and obtained the power density around 3560 µW/cm3 1368 Hz
Renaud et al. (2007)
2007
21680 µW/cm3
1.8 k
Renaud et al. suggested a technique to harness mechanical vibration into electrical energy and obtained the power density around 21680 µW/cm3 1.8 kHz
References
Method
Size of the device
Load in Ω
Fluid velocity
Type of fluid
Conclusion
Shan (2015)
Experimental and Numerical
30 mm
0.56 M Ω
0.35 m/s
Water
Max. power obtained from vortex vibration is 0.9 µW at R = 0.56 M Ω
Ding et al. (2016)
Experimental and Numerical
0.0889 m
2.75 to 11.92 m/s
Water
Max. power obtained from vortex vibration is 0 to 22 W at water velocity in the range of 2.75 to 11.92 m/s
Huajie (2015)
Experimental
10 mm
3 K Ω
159 m/s
Air
Max. power obtained from vortex vibration is 85 mW at R = 3K Ω
Zhang (2017)
Experimental and Numerical
32 mm
–
0.1 to 0.43 m/s
Water
Maximum efficiency from the vortex vibration obtained at 0.1 to 0.43 m/s of water
Rujun (2015)
Experimental and Numerical
20 mm
100 to 150 K Ω
2.028m/s
Water
Max. power obtained from vortex vibration is 84.49 µW at R = 100 to 150 K Ω, V = 2.028m/s
Barrero-Gil (2010)
Analytical
0.2 m
–
10 m/s
Air
Max. power obtained from vortex vibration is 40 W/m2 at 10 m/s
Nishi (2014)
Experimental
0.025 m
–
6 m/s
Water
Max. power harnessed from vortex vibration at water velocity at 6 m/s
Tao et al. (2017)
Numerical
7.2 m/s
Air
Max. power obtained from vortex vibration is 150 W at 7.2 m/s
Zhang (2016)
Experimental and Numerical
0.06 m
–
7.88 m/s
Water
Max. power obtained from vortex vibration at 7.88 m/s velocity of water
Narendran (2016)
Experimental
110 mm
20 to 80 Ω
6.80 m/s
Water
Max. power obtained from vortex vibration is 3.2950 Mw/km3 at R = 20 to 80 Ω, V = 6.80 m/s
Chen et al. (2013)
Experimental and Numerical
1.25 cm
100 Ω
1.8 to 4.3 m/s
Air
Max. power obtained from vortex vibration is 10 µW, at R = 100 Ω and v = 1.8 to 4.3 m/s
Vicente-Ludlam (2017)
Experimental
0.2 m
–
5.20 to 6.67 m/s
Air
Max. power obtained from vortex vibration at 5.20 to 6.67 m/s
Soti et al. (2017)
Numerical
40 mm
–
5.8 to 6.8 m/s
Air
Max. power obtained from vortex vibration at 5.8 to 6.8 m/s
Goushcha et al. (2015)
Experimental and Numerical
–
–
5.8 m/s
Air
Max. power obtained from vortex vibration is 0.8 W at 5.8 m/s
Data
PVDF
Lead Titanate
Lead Zirconate Titanate
SP-2
SP-4
SP-8
SP-5A
SP-5J
SP-5H
Piezoelectric Coupling Co-efficient
Kp
K33
–
0.01
0.52
0.01
0.52
0.01
0.52
0.01
0.52
0.01
0.52
0.01
0.52
Piezoelectric charge constant (×10−12
C/N)
d33
d31
30 pC/N
−18 pC/N
68
3
320
−122
215
−97
450
−195
550
−220
650
−3
Piezoelectric volatge constant (×10−3
Vm/N)
g33
g31
340 (mV/N)
39
−1.7
27
−11
24
−11
26
−11
22
−9
20
−9
Relative Dielectric constant,
(low signal, @ 1 kHz
195
1325
1000
1750
2450
3250
Dissipation factor, tan (Low field)
0.05
0.010
0.004
0.004
0.004
0.020
0.020
Density
kg/m3
1800
6900
7600
7600
7700
7500
7500
Frequency Constants (Hz-m)
Np (planer mode disk)
Nt (thickness mode disk)
Nc (circumference mode cylinder)
N31 (length mode cylinder)
Nsp (radial mode sphere)
2200
1905
990
1580
1675
2270
2030
1060
1700
1810
1950
1800
860
1330
1480
2000
1950
870
1295
1430
1950
2000
860
1386
1520
Ageing rate, % change per time decade
Kp
Np
–
−0.3
-
+0.2
−2.5
−1.6
+1.0
−4.6
−2.0
+0.2
−0.8
−0.6
+0.2
−2.0
−1.5
+0.3
−2.2
−0.9
+0.2
Electrical field dependenceMax Positive Field (V/mm)
Max Negative Field
(V/mm)
Max AC fields, ems @ 25 deg C (V/mm)–
–
–
80
700
350
350
800
400
400
600
300
80
450
225
80
400
200
80
Curie Temp, Tc (Deg C)
–
200
325
330
340
260
190
Mechanical Quality Factor Qm
–
2400
150
110
65
150
67
Elements
Wind
Solar
Biomass
Small Scale Energy harvesting device
Power Output
Can be obtained in KW and MW
Compare to less than Wind
Less than Wind and Solar
Very Small power in micro to milli watts.
Application
Electricity can be fetched to grid or high voltage storage
Electricity can be fetched to grid or high voltage storage
Not available commercially but still larger than piezo.
Used for small scale remote sensing places
Sources
Wind
Sun
Availability of constant fuel sources
Mechanical elements problems with wear & tear degraded with time.
Operational duration
Full time
Depending on the sun light
Reliability on biological components
Limited time span
Cost
Very high
Less in compare to wind
Less in compare to wind and solar
Cost increases much more with the size of piezoelectric materials for a higher power output
Dependence of material properties on the power output
Less sensitive to material structural properties
Less sensitive to material structural properties
Less compare to piezo devices
Very much sensitive to structural properties even a small change in crystal can change in power output
For the piezoelectric harvesting device, the main advantages are the ease of application due to its simplified structure. Moreover, these materials are not affected by internal electromagnetic waves. The researchers have explored many piezoelectric materials like Polymer composites, piezoelectric ceramics, polymers etc. in several energy harvesting configurations to adjust the use of this technique in many applications. It has been found both experimentally and analytically that polymer piezo material behaves well of harvesting energy due to its soft nature. Though, the power output from the piezo material is in the range of microwatt and mill watt, yet PZT type of ceramic found to be good in boosting the intrinsic properties of the material. In this review throughout, the researchers have concentrated their attention to develop the electromechanically couple model to verify the performance of piezoelectric material in different configurations.
On the other hand, there are some disadvantage of piezoelectric energy harvesting set up such as depolarization, sudden breaking of piezo layer due to high brittleness and poor coupling coefficient. PVDF material has poor adhesive properties which causes difficulties in device fabrication. In compare to PVDF materials the PZT materials have a lower electromagnetic coupling coefficient due to which they are required strained directly.
As per the result from the different articles suggest that the maximum efficiency can be achieved for an optimum value of the product of mass and damping ratio. The new kind of experimental work had been developed with the help of scotch yoke mechanism to generate power from the rotating blades of the wind turbine. It is found to be the strong dependence with the inlet velocity of the vortex induced vibration device in compare to other energy converting device. Some reviewers had assumed the approximate analytical solutions for the output voltage, pitch angle, plunge deflection and results are compared with the numerical solution of integration equation.
The production of energy harvesting has been optimized and compared by changing the geometry, increasing the no of cylinders, by changing the boundary condition, coupling the cylinder with the wind turbine and by changing the piezoelectric material. Based on the previous history on the VIVACE, a mathematical model has been formulated in order to find out relationship among the experimental parameters and the response of the system. Due to random characteristics of free vibration, new development in design of efficiency of energy harvesting is a great challenge such as creation of new energy harvesting design by innovating design methods and also by exploring non linear benefits. Moreover, portable compact size design with the integrate functions are also hot areas of research in the field.
References
- Amini, Y. et al., 2017. Piezoelectric energy harvesting from vibrations of a beam subjected to multi-moving loads. Appl. Math. Model. 49, 1–16.
- Energy harvesting vibration sources for microsystems applications. Meas. Sci. Technol.. 2006;13:R175-R195.
- [Google Scholar]
- Proc. SPIE. 2013;8868:868804.
- Capel, I.D., Dorrell, H.M., Spencer, E.P., Davis, M.W.L., 2003. The amelioration of the suffering associated with spinal cord injury with sub perceptiontrans cranial electrical stimulation. Spinal Cord 41(2), 109–117.
- Wen-Li Chen et al., 2013. Suppression of vortex-induced vibration of a circular cylinder using suction-based flow control. J. Fluids Struct. 42, 25–39.
- Ching, N.N.H., Li, W.J., Leong, P.H.W., Wen, Z., Wong, H.Y., 2002. A laser micromachined multi-modal resonating power transducer for wireless sensing systems. Munich 685–690.
- Powering MEMS portable devices-a review of non-regenerative and regenerative power supply systems with special emphasis on piezoelectric energy harvesting systems. Smart Mater. Struct.. 2008;17:043001.
- [Google Scholar]
- Gianluigi De Giuseppe et al., 2017. An improved PZT cantilever SPICE model for practical energy harvesting circuits simulations and measurements. Measurement 98, 374–383.
- Sens. Actuators, A. 2013;199:344-352.
- Numerical simulation and experimental validation for energy harvesting of single-cylinder VIVACE converter with passive Turbulence control. Renewable Energy. 2016;85:1246-1259.
- [Google Scholar]
- The design, fabrication and evaluation of a MEMS PZT cantilever with an integrated Si proof mass for vibration energy harvesting. J Micromech. Microeng.. 2008;18(5):055017.
- [Google Scholar]
- duToit, N.E., Wardle, B.L., 2007. Experimental verification of models for microfabricated piezoelectric vibration energy harvesters. AIAA J. 45, 1126–1137.
- Design and fabrication of a new vibration-based electromechanical power generator. Sens. Actuators, A. 2001;92:335-342.
- [Google Scholar]
- Resonance tuning of piezoelectric vibration energy scavenging generators using compressive axial preload. Smart Mater. Struct.. 2006;15(5):1413.
- [Google Scholar]
- Appl. Phys. Lett.. 2008;93(22):224102.
- Fabrication and performance of MEMS-based piezoelectric power generator for vibration energy harvesting. Microelectron. J.. 2006;37:1280-1284.
- [Google Scholar]
- Energy harvesting prospects in turbulent boundary layers by using piezoelectric transduction. J. Fluids Struct.. 2015;54:823-847.
- [Google Scholar]
- Modelling of piezoelectric actuator dynamics for active structural control. J. Intelligent Mater. Syst. Struct.. 1990;1:327-354.
- [Google Scholar]
- Piezoelectric energy harvesting from vibrations induced by jet-resonator system. Mechatronics. 2015;26:29-35.
- [Google Scholar]
- Energy harvesting from low frequency applications using piezoelectric materials. Appl. Phys. Rev.. 2014;1:041301.
- [CrossRef] [Google Scholar]
- Adv. Mater.. 2014;26(28):4880-4887.
- Inman, D.J., Grisso, B.L., 2006. Towards autonomous sensing. In: Proceedings of the Smart Structures and Materials: Sensors and Smart Structures Technologies for Civil, Mechanical, and Aerospace Systems, vol. 6174. San Diego, Calif, USA, February 2006, pp. 61740T-T-7.
- Jeon, Y.B., Sood, R., Jeong, J.H., Kim, S.G., 2005. MEMS power generator with transverse mode thin film PZT. Sens. Actuators, A 122, 16–22.
- Joseph, A., Paradiso, Thad Starner, 2005. Energy scavenging for mobile and wireless electronics. IEEE Pervasive Comput.
- Kim Miso 2012. Materials and device design for MEMS piezoelectric mechanical vibration energy harvesters. (Ph.D. thesis) Massachusetts Institute of Technology, February.
- Kymissis, J., Kendall, C., Paradiso, J., Gershenfeld, N., 1998. Parasitic power harvesting in shoes. In: Proceedings of the 2nd IEEE International Symposium on Wearable Computers October 19–20. Pittsburg, PA, 1998, pp. 132–139.
- J. Appl. Phys.. 2011;109(2):026104.
- Mannini Claudio et al., 2016. Interference of vortex-induced vibration and transverse galloping for a rectangular cylinder. J. Fluids Struct. 66, 403–423.
- Marzencki, M., Charlot, B., Basrour, S., Colin, M., Valbin, L., 2005. Design and fabrication of piezoelectric micro power generators for autonomous microsystems. In: DTIP ’05 – Symposium on Design Testing Integration and Packaging of MEMS/MOEMS Montreux, Switzerland, 2005, pp. 299–302.
- Marzencki, M., Ammar, Y., Basrour, S., 2007. Integrated power harvesting system including a MEMS generator and a power management circuit. In: Solid-State Sensors, Actuators and Microsystems Conference, Transducers International, 2007, pp. 887–890.
- Vibration-to-electric energy conversion. IEEE Trans. Very Large Scale Integr. VLSI Syst.. 2001;9:64-76.
- [Google Scholar]
- Ferroelectric thin films for micro-sensors and actuators: a review. J. Micromech. Microeng.. 2000;10(2):136-146.
- [Google Scholar]
- Narendran, K., 2016. Investigations into efficiency of vortex induced vibration hydrokinetic energy device. Energy 109, 224–235.
- IEEE/ASME Trans. Mechatron.. 2005;10(4):455-461.
- Priya Shashank, 2007. Advances in energy harvesting using low profile piezoelectric transducers. J. Electroceram. 19, 165–182.
- Renaud, M., Sterken, T., Schmitz, A., Fiorini, P.A.F.P., Van Hoof, C.A.V.H.C., Puers, R.A.P.R., 2007. Piezoelectric harvesters and MEMS technology: fabrication, modeling and measurements. In: Solid-State Sensors, Actuators and Microsystems Conference. Transducers International, 2007, pp. 891–894.
- Smart Mater. Struct.. 2009;18(3):035001.
- Riffat, S.B., Xiaoli Ma, 2003. Thermoelectrics: a review of present and potential applications. Appl. Therm. Eng. 23(8).
- Roundy, S., Wright, P.K., Pister, K.S.J., 2002. Micro-electrostatic vibration-to electricity converters. New Orleans, LO, United States, pp. 487–496.
- Roundy Shad, Paul K. Wright, Jan Rabeey, 2003. A study of low level vibrations as a power source for wireless sensor nodes. Comput. Commun. 26, 1131–1144.
- A piezoelectric vibration based generator for wireless electronics. Smart Mater. Struct.. 2004;13(5):1131-1142.
- [Google Scholar]
- A study of vortex-induced energy harvesting from water using PZT piezoelectric cantilever with cylindrical extension. Ceram. Int.. 2015;41:S768-S773.
- [Google Scholar]
- Sarkar, A., Kumar, N., Mitra, 2014. Extreme wind climate modeling of some locations in india for the specification of the design wind speed of structures. KSCE J. Civ. Eng. 18(5), 1496–1504.
- Weibull model for wind speed data analysis of different locations in India. KSCE J. Civ. Eng. 2017
- [CrossRef] [Google Scholar]
- Schmidt, V.H., 1992. Piezoelectric energy conversion in windmills. IEEE Ultrason. Symp. 897–904.
- Novel energy harvesting: a macro fiber composite piezo electric energy harvester in the water vortex. Ceram. Int.. 2015;41:S763-S767.
- [Google Scholar]
- Xiaobio Shan et al., 2015. Novel energy harvesting: a macro fiber composite piezo electric energy harvester in the water vortex. Ceramics Int. 41, 763–767.
- Micromachined PZT cantilever based on SOI structure for low frequency vibration energy harvesting. Sens Actuators A: Phys. 2009;154(1):103-108.
- [Google Scholar]
- IEEE Int. Symp. Appl. Ferroelectr. 2010:1-4.
- A review of power harvesting from vibration using piezoelectric materials. The Shock Vib. Digest. 2004;36(3):197-205.
- [Google Scholar]
- Proc. SPIE. 2003;5050:101-108.
- Soti Atul Kumar et al., 2017. Harnessing electrical power from vortex-induced vibration of a circular cylinder. J. Fluids Struct. 70, 360–373.
- Starner, T., Paradiso, J.A., 2004. Human-generated power for mobile electronics. In: Piguet, C. (Ed.), Low-Power Electronics Design, CRC Press, 2004, pp. 1–35, chapter 45.
- Tao, J.X. et al., 2017. Energy harvesting from wind by a piezoelectric harvester. Eng. Struct. 133, 74–80.
- Venkatasubramanian, R., Siivola, E., Coplitts, T., O”Quinn, B., 2001. Thin-film thermoelectric devices with high room-temperature figures of merit. Nature 413, 597–602.
- Vicente-Ludlam, D., 2017. Flow-induced vibration of a rotating circular cylinder using position and velocity feedback. J. Fluids Struct. 72, 127–151.
- Analysis of a Micro-electric Generator for Microsystems. Sweden: Stockholm; 1995. p. :369-372.
- Appl. Phys. Lett.. 2012;101(3):033502.
- Yoshiki Nishi, 2014. Power extraction using flow-induced vibration of a circular cylinder placed near another fixed cylinder. J. Sound Vib. 333, 2863–2880.
- IEEE Ultrason. Symp.. 2008;1–4:1397-1440.
- Numerical investigation on VIV energy harvesting of bluff bodies with different cross sections in tandem arrangement. Energy. 2017;133:723-736.
- [Google Scholar]
- Zhang Min, Junlei Wang, 2016. Experimental study on piezoelectric energy harvesting from vortex-induced vibrations and wake-induced vibrations. Hindawi Publishing Corporation J. Sensors 7, Article ID 2673292.
- Zhang Jun, 2016. Experimental investigation on the flow induced vibration of an equilateral triangle prism in water. Appl. Ocean Res. 61, 92–100.
- Zhao Jiangxin et al., 2015. An arc-shaped piezoelectric generator for multi-directional wind energy harvesting. Sens. Actuators, A 236, 173–179.
- Zhou, W, Liao, W.H., Li, W.J., 2005. Analysis and design of a self powered piezoelectric microaccelerometer. In: Smart Structures and Materials 2005: Smart Electronics MEMS, BioMEMS, and Nanotechnology, Proceedings of SPIE, May 2005. San Diego Calif, USA, pp. 233–240.


