

Analyses of structural and electrical properties of aluminium doped ZnO-NPs by experimental and mathematical approaches
⁎Corresponding author. tunggi@utu.fi (Tuan Nguyen Gia)
-
Received: ,
Accepted: ,
This article was originally published by Elsevier and was migrated to Scientific Scholar after the change of Publisher.
Peer review under responsibility of King Saud University.
Abstract
Pure and aluminium doped ZnO-NPs were played the central role in every field of life due to extraordinary physical, chemical and electrical properties. The main objective of the present research was used to enhance the electrical conductivity and reduce the electrical resistivity of aluminium doped zinc oxide-NPs. Synthesis of pure and aluminium doped zinc oxide-NPs (Zn1-xAlxO) at x = 0, 2.5, 5, 7.5 and 10 wt% was carried out by co-precipitation method. The XRD results depicted that hexagonal wurtzite crystal structure and crystallite size in the range of 13–25 nm were calculated by using Debye-Scherrer’s equation. Likewise, the non-uniform, irregular and pore like surface morphology of the prepared NPs was evident from SEM micrographs. Various functional groups (CH, CO, OH and ZnO) attached to the surface of aluminium doped zinc oxide-NPs were identified by FTIR analysis. The UV–VIS spectra also depicted a shift towards the blue region of the visible spectrum. In terms of electrical properties with the help of experimental and mathematical analyses of aluminum doped zinc oxide-NPs exhibited higher conductivity (1.34 × 10⁻⁶ to 1.43 × 10⁻³ S/cm) and lower resistivity (5.46 × 10⁵ to 6.99 × 10² Ω-cm). The present results suggest that the aluminum doped zinc oxide-NPs have been improved the structural and electrical properties which make it a good candidate for optoelectronic devices.
Keywords
Co-precipitation
Al-doped ZnO
Hexagonal wurtzite
Conductivity
Resistivity

1 Introduction
Previous studies provided the information about the oxide base nanomaterials are used in textile, electronic, optoelectronic, sensing and biomedical filed due to multiple physical, chemical and biological properties (Munir et al., 2021). Nanoparticles can be manufactured such as natural resources as well as chemically and they are important materials in fuel cells, solar cells, bactericidal agents, batteries, sensors, photocatalytic and self-cleaning coatings (Al-Kahlout, 2012; Munir et al., 2020; Abutalib and Rajeh, 2020; Nosheen et al., 2021; Mazari et al., 2021a; Mazari et al., 2021b). The nanomaterials have been the extensively used multifunctional material owing to their non-toxicity, low cost, wide source, acid-base resistance and high catalytic activity. Moreover, the previous study reported that the three different types of defect such as point, line and surface defect are most common in crystals of oxide nanoparticles. The point defect linked with donor and acceptor defect, which have an effect on the electrical behavior of the nanomaterials (Ischenkoet al., 2005). But ZnO-NPs represents three type donor defects Vo, Zno and Zni, and three type acceptor defects Ozn, Oi and Vzn. Due to large band gap in ZnO-NPs indicate the multiple defects in the crystal. The pure ZnO-NPs show the high resistivity and low conductivity by using the different doping agents to decrease the resistivity and improve the conductivity up to significant values (Shi et al., 2011).
The ZnO semiconductor nanomaterial belongs to group II- IV of the periodic table and high concentration of electrons in ZnO-NPs represents n-type characteristics. It shows that with tunable band gap (∼3.37 eV) and doping with E.N (higher electronegative elements such as Cu, F, Al and Co could be altered electrical behavior (Kang et al., 2019). Its larger band gap energy and maximum excitation binding energy (∼60 meV) make it feasible for higher temperature applications (Vadivel et al., 2014). During this study, ZnO-NPs were synthesized with low-cost material and simple chemical technique and its electrical properties were comparable to ITO materials. The ITO material is highly expensive and it was used on a commercial scale. It is important to mention here that the physical and chemical properties of ZnO-NPs can be modified by using different transition elements like Al, Cu, In, Sn, Ag and Co as doping materials (Shui et al., 2009). Furthermore, the ionic radii of Al (53 pm) are much smaller as compared to Zn (88 pm) which favour its addition as doping without producing stress (Griffen, 1981; Lee and Park, 2003). Here, discuss the synthesis of Al-doped ZnO-NPs was achieved through controlled stoichiometry and homogeneity at the molecular level via the co-precipitation method. The prepared pure and Al-doped ZnO-NPs were characterized by using various characterization techniques such as XRD, SEM, FTIR, UV–VIS and two probe methods. Moreover, these multiple characterization techniques were used to investigate the structural as well as electrical properties. The first time comparison of the experimental and mathematical modelling analysis such as second order polynomial function was applied on data for electrical properties. Finally, experimental and mathematical analysis shows that electrical conductivity increased and electrical resistivity decrease.
2 Experimental details
2.1 Chemicals
The following are the precursor such as Zinc nitrate hexahydrate (reagent grade {RG}, 98%), Aluminum nitrate nonahydrate (RG, 98%) and Sodium Hydroxide (RG ≥ 98%) used to prepare the pure and aluminium doped zinc oxide-NPs.
2.2 Synthesis of pure and Al-doped ZnO-NPs
The 200 mL de-ionized water was used to prepare the solution of zinc nitrate (0.4 M) and the solution was stirred on a magnetic stirrer for 20 min at 70 °C. This followed the addition of NaOH buffer solution to maintain the pH (11–12) of the solution. After that, the white precipitate was obtained by washing with de-ionized water to remove impurities and then oven-dried (100 °C for 24 h) and afterwards, prepared ZnO-NPs powder was annealed at 200 °C for 3 h inside a muffle furnace. Likewise, the prepared Al-doped ZnO-NPs (2.5 %) aluminium nitrate solution was prepared in (0.4 M) zinc nitrate and the solution was stirred for 30 min at 70 °C on stirrer. Finally, the same procedure was repeated three times by various concentrations (5.0, 7.5 and 10 wt%). Fig. 1 represents the graphical expression of pure and aluminium doped zinc oxide-NPs.
- Graphical expression of pure and Al- doped ZnO-NPs.
2.3 Mathematical modeling
In case of mathematical modeling, the second order polynomial function was applied on the data of conductivity to investigate the behavior of conductivity of pure and aluminium doped zinc oxide-NPs.
2.4 Characterization of Al-doped ZnO-NPs
The different characterization techniques were used to investigate the structural and electrical properties of aluminium doped zinc oxide-NPs, which include the XRD model (X’Pert3 MRD) was preferred to identify the structure and Debye-Scherrer’s equation (1) was used to calculate the crystallite size.
To investigate the surface morphology by using SEM model (Emcrafts) micrographs. The multiple functional groups attached on the surface of the spectrum were identified by the FTIR model (FTS-14) and the optical behavior of the aluminium doped zinc oxide-NPs was observed by using UV–VIS model (Perkin Elmer Lambda 2). Finally, the electrical resistivity and electrical conductivity were calculated by using IV two probe methods.
3 Results and discussion
3.1 XRD analysis
The crystalline behavior of the aluminium doped zinc oxide-NPs was investigated by XRD analysis and the hexagonal wurtzite crystal structure was identified from (Fig. 2) by XRD spectrum. The spectrum of pure and aluminium doped zinc oxide-NPs shows no extra peak appeared by increasing the Al-concentration. Because the Al-dopant concentration was affected the intensity level of the different peaks and it was not affected the structure of ZnO-NPs. The conformation about the Al ion was properly substituted into ZnO-NPs because the smaller ionic radii of Al+3(53 pm) as compared to Zn+2(88 pm). The miller indices of different diffracted peaks (1 0 0), (1 0 1), (1 0 2) and (1 1 2) were calculated and it was compared with previous reported JCPDS standard data (Card No. 80-0074) (Gherab et al., 2017; Bhuiyan et al., 2017, Norouzzadeh et al., 2020). Finally, it was expressed that the crystallite size of aluminium doped ZnO-NPs decreased via increasing Al-concentration was expressed in Table 1.
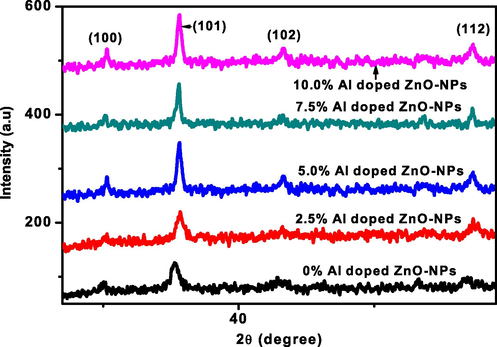
- XRD spectrum of aluminum doped zinc oxide-NPs.
| Al dopant- ZnO NPs with different concentration (wt %) | Peak (101) (nm) | Peak (112) (nm) | Average size (nm) |
|---|---|---|---|
| 0 | 25.31 | 24.6 | 24.9 |
| 2.5 | 21.3 | 20.7 | 21 |
| 5.0 | 19.0 | 18.5 | 18.7 |
| 7.5 | 16.5 | 14.1 | 15.3 |
| 10.0 | 13.7 | 12.3 | 13 |
3.2 FTIR analysis
The FTIR spectrum of Al-doped ZnO-NPs indicated that at higher concentrations of Al atoms spectrum peaks slightly fluctuated and absorption spectrum from wavenumber 400–4000 cm−1 was expressed in (Fig. 3). After that, the several bands below 1000 cm−1 indicated inter-atomic vibration modes and band at 3600 cm−1 represented O–H stretching mode. Furthermore, the mode at 2400 cm−1 represents C–H rotational mode and stretching mode C=O vibration band exists in between 1400 and 1600 cm−1. Finally, the peaks at 470 and 670 cm−1 represent the ZnO stretching mode (Piticescu et al., 2006; Akdağ et al., 2016; Baghdadi et al., 2020).
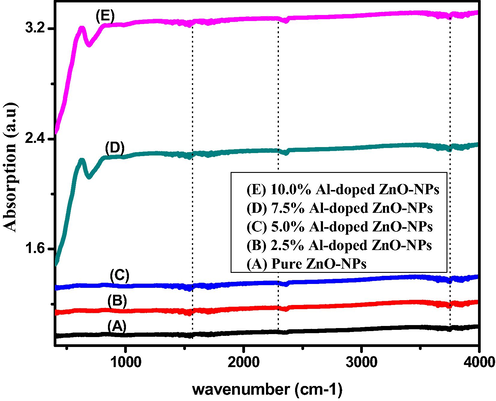
- FTIR spectrum of pure and aluminium doped ZnO-NPs.
3.3 SEM analysis
Pure ZnO-NPs micrograph depicted irregular small and large grain size; while Al-doping agent represents the same pattern but an increase in grain size was evident. The images were collected at the same range 1.0 µm as shown (Fig. 4) also expressed the pore like surface morphology and it was compared with previously published data (Kant et al., 2021).
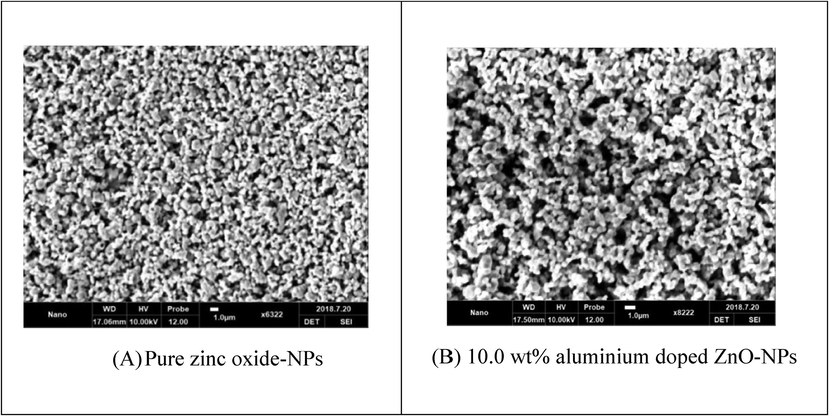
- SEM patterns (A) Pure zinc oxide-NPs (B) aluminium doped ZnO-NPs.
3.4 Electrical analysis
The resistivity and conductivity study explained that an increase in aluminium concentration (x = 0.00, 2.5, 7.5 and 10.00 wt%) in ZnO as dopant material (Fig. 5) improved its conductivity (1.34 × 10⁻⁶ to 1.43 × 10⁻³ S/cm) while decreased resistivity (5.46 × 10⁵ to 6.99 × 10² Ω-cm). The variation in resistivity and conductivity shows that Al substitution of Zn ions improves the electrical properties of aluminium doped ZnO-NPs (Ahmad et al., 2013). Aluminium-doped ZnO-NPs shows high conductivity and low resistivity properties comparable to an expensive material Indium tin oxide (ITO) (Bhugul and Choudhari, 2015), which shows potential applications in electrical and optical devices.
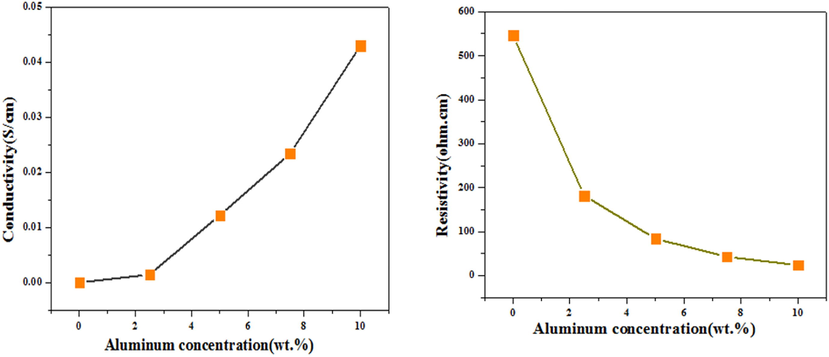
- Resistivity and conductivity of aluminium doped ZnO-NPs.
3.5 UV–VIS analysis
The UV–visible spectra explained the absorbance band of Al-doped ZnO-NPs in (Fig. 6). The spectra at 0, 2.5, 5.0, 7.5 and 10 wt% aluminium concentrations indicated that increased dopant (Al) caused wavelength decrease which caused a spectrum shift towards a shorter wavelength (blue shift). Pure ZnO exhibited absorbance peak at 376 nm, while aluminium doped material peak shift toward short-wavelength less than 376 nm (Sanguanprang et al., 2020; Zhang et al., 2017; Dhamodharan et al., 2017).
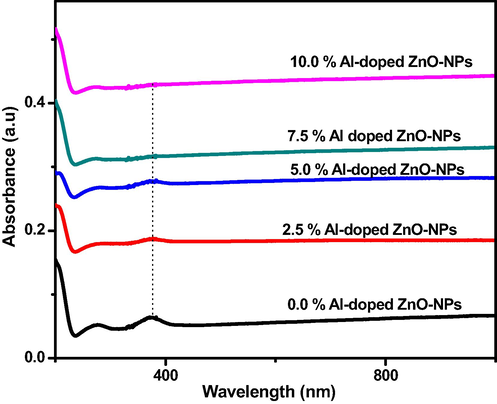
- UV–VIS of aluminium doped ZnO-NPs.
3.6 Mathematical modeling analysis
The data was used to create mathematical modelling of conductivity against the increasing concentration of dopant agent. The behavior of data is exponentially increasing which leads to the proposal of modelling with second order polynomial as shown in equation (2). The method of least square error is used to fit the data and to extract unknown coefficients used in generic second order polynomial. Fig. 7 shows the proposed second order polynomial for the mathematical model of the data of conductivity. The data itself is also shown to evaluate the goodness of fit for the proposed model.
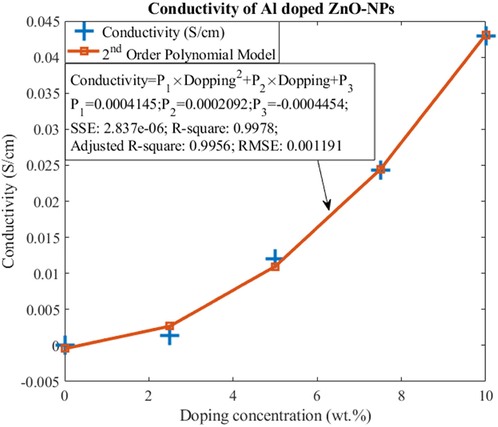
- Data of conductivity (S/cm) as a function of doping concentration (wt.%). The proposed mathematical model of 2nd order polynomial confirms the suitability of the proposed model along with the extracted unknown parameters.
4 Conclusions
The aluminium doped ZnO-NPs were synthesized via the co-precipitation method and hexagonal wurtzite crystal structure and crystallite size decreased by increasing Al concentrations in ZnO-NPs was identified by using XRD analysis. After that, the non-uniform and irregular pore like structure was identified by SEM analysis and FTIR was used to calculate the different rotational and vibrational modes attached on the spectrum of pure and aluminium doped ZnO-NPs. The UV–VIS analysis was used to observe the absorption at 376 nm and wavelength decrease by increasing doping concentration. Above all, the aluminium doped ZnO-NPs had better conductivity with decreased resistivity as compared to ZnO-NPs and the analysis was also investigated by applying mathematical modelling of second order polynomial function. Finally, the prepared nanomaterials (aluminium doped zinc oxide-NPs) were used in optoelectronics applications.
Acknowledgements
Researchers Supporting Project number (RSP-2021/397), King Saud University, Riyadh, Saudi Arabia.
Declaration of Competing Interest
The authors declare that they have no known competing financial interests or personal relationships that could have appeared to influence the work reported in this paper.
References
- Structural, thermal, optical and conductivity studies of Co/ZnO nanoparticles doped CMC polymer for solid state battery applications. Polym. Test.. 2020;91:106803.
- [Google Scholar]
- Preparation of highly efficient Al-doped ZnO photocatalyst by combustion synthesis. Curr. Appl Phys.. 2013;13(4):697-704.
- [Google Scholar]
- Akdağ, A., Budak, H. F., Yılmaz, M., Efe, A., Büyükaydın, M., Can, M., Sönmez, E. (2016, April). Structural and morphological properties of Al doped ZnO nanoparticles. In Journal of Physics: Conference Series (Vol. 707, No. 1, p. 012020). IOP Publishing.
- ZnO nanoparticles and porous coatings for dye-sensitized solar cell application: photoelectrochemical characterization. Thin Solid Films. 2012;520(6):1814-1820.
- [Google Scholar]
- Synthesis and studies on nanocomposites of polypyrrole-Al-doped zinc oxide nanoparticles. Int. J. Sci. Res. Publ.. 2015;5
- [Google Scholar]
- Characterization of Al doped ZnO nanostructures via an electrochemical route. Int. J. Energy Appl. Technol.. 2017;4(1):28-33.
- [Google Scholar]
- Microwave irradiation to produce high performance thermoelectric material based on Al doped ZnO nanostructures. Crystals. 2020;10(7):610.
- [Google Scholar]
- Al-doped ZnO thin films grown onto ITO substrates as photoanode in dye sensitized solar cell. Sol. Energy. 2017;141:127-144.
- [Google Scholar]
- Aluminium nanoparticles size effect on the optical and structural properties of ZnO nanostructures synthesized by spin-coating technique. Results Phys.. 2017;7:1190-1197.
- [Google Scholar]
- Synthetic Fe/Zn staurolites and the ionic radius of IVZn2+. Am. Mineral.. 1981;66(9–10):932-937.
- [Google Scholar]
- The Structural, electrical, and optical properties of ZnO ultra-thin films dependent on film thickness. J. Microelectronics Packaging Soc.. 2019;26(2):15-21.
- [Google Scholar]
- Enhancement in dielectric and optical properties of Al doped ZnO/reduced graphene oxide nanocomposite. Mater. Technol. 2021:1-8.
- [Google Scholar]
- Transparent conducting ZnO: Al, In and Sn thin films deposited by the sol–gel method. Thin Solid Films. 2003;426(1-2):94-99.
- [Google Scholar]
- Influence of IP-injected ZnO-nanoparticles in Catla catla fish: hematological and serological profile. Naunyn-Schmiedeberg's Arch. Pharmacol.. 2020;393(12):2453-2461.
- [Google Scholar]
- Structural, electrical and optical properties of Zn1− xCuxO (x= 0.00–0.09) nanoparticles. J. King Saud Univ.-Sci.. 2021;33(2):101330
- [Google Scholar]
- An overview of catalytic conversion of CO2 into fuels and chemicals using metal organic frameworks. Process Saf. Environ. Prot.. 2021;149:67-92.
- [Google Scholar]
- Nanomaterials: applications, waste-handling, environmental toxicities, and future challenges-A review. J. Environ. Chem. Eng.. 2021;9(2):105028.
- [Google Scholar]
- Investigation of structural, morphological and optical characteristics of Mn substituted Al-doped ZnO NPs: a Urbach energy and Kramers-Kronig study. Optik. 2020;204:164227.
- [Google Scholar]
- Nosheen, S., Iqbal, S. S., Bahadar, A., Hossain, N., Shahzad, T. (2021). Fabrication & characterization of novel conductive nanomaterial, CaxCr0. 5− xMg0. 5Fe2O4. Korean J. Chem. Eng., 1-5.
- Synthesis of Al-doped ZnO nanomaterials with controlled luminescence. J. Eur. Ceram. Soc.. 2006;26(14):2979-2983.
- [Google Scholar]
- Preparation of visible-light-driven Al-doped ZnO nanoparticles used for photodegradation of methylene blue. J. Electron. Mater.. 2020;49(3):1841-1848.
- [Google Scholar]
- Synthesis of zinc oxide nanoparticles with strong, tunable and stable visible light emission by solid-state transformation of Zn (II)–organic coordination polymers. J. Mater. Chem.. 2011;21(33):12309-12315.
- [Google Scholar]
- Preparation and properties for aluminum-doped zinc oxide powders with the coprecipitation method. J. Ceram. Soc. Jpn.. 2009;117(1365):703-705.
- [Google Scholar]
- Studies on the structural, optical and magnetic properties of al doped ZnO nanoparticles. Int. J. Chem. Tech Res.. 2014;7(3):1206-1211.
- [Google Scholar]
- High photocatalytic performance of high concentration Al-doped ZnO nanoparticles. Sep. Purif. Technol.. 2017;172:236-241.
- [Google Scholar]
Appendix A
Supplementary data
Supplementary data to this article can be found online at https://doi.org/10.1016/j.jksus.2021.101796.
Appendix A
Supplementary data
The following are the Supplementary data to this article:


