

Translate this page into:
Ambient noise tomography in the upper crust of North Harrat Rahat, Saudi Arabia
⁎Corresponding author at: Department of Geology & Geophysics, College of Science, King Saud University, P.O. Box 2455, Riyadh 11451, Saudi Arabia. aabdelfattah@KSU.EDU.SA (Ali K. Abdelfattah)
-
Received: ,
Accepted: ,
This article was originally published by Elsevier and was migrated to Scientific Scholar after the change of Publisher.
Peer review under responsibility of King Saud University.
Abstract
Images of Rayleigh-wave group velocity were derived for the 1–15 s period range that is sensitive to shear wave velocities in the crust of north Harat Rahat, Saudi Arabia. We used a continuous dataset of ambient noise that was processed by applying the technique depending on the Rayleigh-wave group velocity tomography. The dataset comprises six months of recordings extracted from 12 broadband seismic stations in north Harrat Rahat, Saudi Arabia. Using a cross-correlation technique, the Rayleigh waves have been generated and stacked along the whole time series. Dispersion curves representing fundamental mode Rayleigh waves were derived by a multiple filter technique. Dispersion curves for each station pair were inverted to obtain the one-dimensional model of corresponding shear wave velocities. The spatial distribution of shear wave velocities was depicted from the inverted one-dimensional models at 138 nodes and a reliable resolution was spatially resolved using grid cells of 0.2° expanded over both latitude and longitude. Images obtained from this study improve our understanding of the tectonic development as influenced by magma upwelling beneath the Arabian Shield. Results obtained from this study revealed two low-velocity zones in the upper crust at depths of 15 km west and shallow 10 km east, respectively. This suggests that high conductivity is present as a result of upwelling magma that flows into the upper crust of Arabian Shield coming from plausible deep sources such as the Red Sea Rift or the Afar plume, which are located to the west of the studied area.
Keywords
Rayleigh waves
Magma flow
Arabian Shield

1 Introduction
The Arabian Shield, representing the eastern flank of the Red Sea, is speculated to be characterized by a complex geodynamic process due to the active asthenosphere that made the lithosphere enriched in many basaltic volcanic eruptions called Harrats (Fig. 1). Tectonically, the Neoproterozoic Arab-Nubian region is adapted to the divergent movement of the Arabian plate concerning the Nubian plate. Owing to diverse tectonic series, the formation of the NW-SE dikes parallel to the Red Sea, the NE-SW strike-slip faults, and NW normal faults are recognized in the Arabian Shield. Structurally, the regions of Harrats are related to the tectonic rift acting in the Red Sea that might associate with a sequence of Cenozoic bursts, volcanic rocks and ridges. Debayle et al. (2001) show evidence of an upper-mantle low-velocity material under the Nubian and Arabian lithosphere. Heterogeneities may affect the Red Sea development. Based on three-dimensional analogue experiments, distinctive morphology in the Red Sea may indicate existing heterogeneities in both crust and mantle (Molnar et al., 2020). It is well known that the basaltic volcanic fields may host between 150 and 300 °C geothermal systems of remains elusive how recent magmatic activities are related to the Red Sea rifting or Afar plume or Jordan plumes. Recent studies to investigate the fine and gross structure of the Arabian Shield’s lithosphere were conducted by Hansen et al. (2013) and Koulakov et al. (2015). However, the enigmatic phenomena do not explain the magma flow sources and origins of lava fields beneath the basaltic volcanic fields of the Arabian Shield. The bimodal distribution of Konrad et al. (2016) may be constrained by the northward progression of younger magma flow. Results of these studies suggest that a lateral flow of magma beneath Harrat Rahat comes from the Afar plume and then the active asthenosphere causes the thinning of the lithosphere in the Arabian Shield.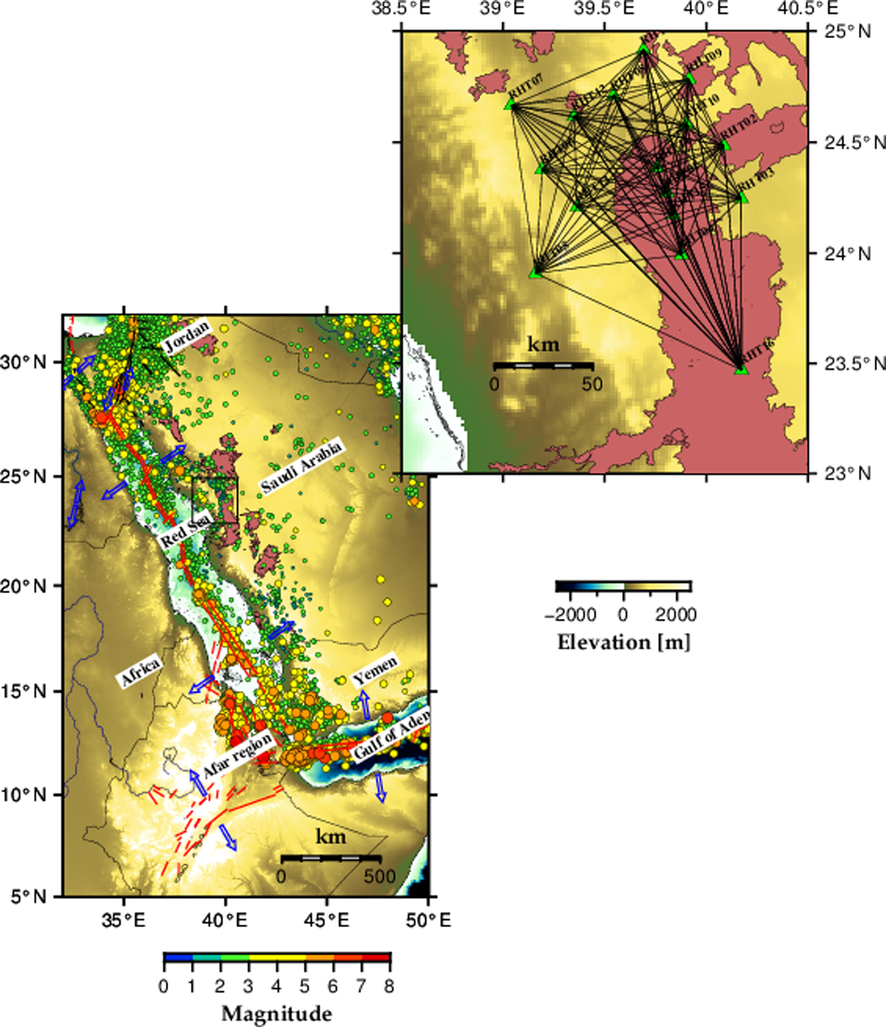
A map of the Arabian shield and its controlling regional tectonics. The distribution of epicentres (coloured circles) as a function of magnitude is also shown. The type of tectonic movements in the region is represented by blue arrows. The spatial coordinates of the broadband seismic stations as well as the density of ray paths between station pairs are also displayed. Cenozoic volcanic fields known as Harrats are shown as polygons.
When few earthquakes are available and inadequate to cover paths from source to receiver well, tomographic techniques depend on using earthquake data are not appropriate for mapping the upper crust with reliable accuracy where intrusions of magma channels or dykes are expected. This problem can be resolved by applying the tomographic technique to the dataset that comprises continuous ambient seismic noise (Shapiro et al., 2005). This technique has been applied on different scales using continuous records of seismic noise that represent a few hours to a few months (Brenguier et al., 2007; Bensen et al., 2008; Mordret et al., 2013). Theoretically, estimates of Green’s function for each station pair can be retrieved from the cross-correlation of continuous ambient noise records, giving signals equivalent to that surface waves recorded at one station and originating from a surface point source acting at other station locations. The retrieval signals from the cross-correlation technique showed spectral amplitudes that were influenced by the effects of the ambient ground motions and Green’s function excitations.
Considering the history of volcanic eruptions in the Arabian shield, notably, the northern Harat Rahat volcanic area is represented the most recent volcanic eruption (Camp et al., 1987; Downs et al., 2018). Therefore, it is essential to devote more studies to this area in order to mitigate the risks that may be associated with volcanic eruptions. As seen in other active magma systems over the world, the potential for a significant decrease in seismic shear wave velocity indicates the presence of a crustal magma chamber (Flinders et al., 2018). Using a dataset of twelve seismic monitoring stations collected from the seismic monitoring network established by the Saudi Geological Survey, we implemented the ambient noise tomography approach in this study. The results presented here focus on the propagation of ambient noise within the northwest part of Harrat Rahat, Saudi Arabia.
2 Crustal heterogeneities in Arabian Shield
The high plateaus that represent the western flank of the Red Sea can reach an elevation of 2,000 m or more in some localities and consist of large Precambrian basement rocks (600–900 Ma). These rocks are believed to contain little or no sedimentary rocks. They are considered as rifted continental margins. The eastern flank known as the Arabian Shield is considered a Juvenile Neoproterozoic crust showing granite, schist, gneiss, volcanic and sedimentary rocks. Ultramafic and ophiolitic rocks are recognised also in some localities. These uplifted Precambrian rocks are intruded by Cenozoic basalt and intrusive volcanic rocks (Fig. 1). The formation of the Arabian Shield results from the convergence of the continental segments that occurred between 630 and 550 Ma (Stern and Johnson, 2010). The Arabian Shield was tectonically adopted by the divergence of the Arabian and African plates during Cenozoic volcanism, giving rise to the Red Sea rifting. According to existing evidence, the Precambrian rocks of the Arabian Shield underwent many tectonic phases. Brittle and ductile faults, NW normal faults and dikes, which are known to run parallel to the Red Sea, and N-S to NE strike-slip faults, which are well known in the southern Arabian Shield, are among the dominant structures in the Arabian Shield.
The epicenters are spatially distributed over the axial fault of the Red Sea, the Gulf of Aqaba, and the Afar region, as shown in Fig. 1. Moreover, the seismicity is randomly spread out within the Arabian Shield. Low-background seismic activity in Haret Rahat is considered to be caused by crustal expansion and the upwelling movements of deep magma (Johnson and Kattan, 2012). Notably, a swarm of 500 occurred between 11 November and 28 December 1999 with magnitude ranges from ML 1.1 to 2.3 (Mokhtar et al., 2013).
The rifting process in the Red Sea is presumably related to the continuous regional extension tectonic movement that began 30 Ma ago and is associated with the Cenozoic volcanic activity in the region (Coleman et al., 1983). The Precambrian basement is composed of different igneous rocks that are exposed at the surface and have remarkable NW-SE and NE-SW trends. Jónsson (2012) identified some surface faults, the majority of which are parallel to the Red Sea rift and striking in the NW-SE trend, regarded as tensional fractures that are typical normal fault styles. The geologic map, as shown in Fig. 2, displays the most recent volcanic rock observations imputed to the 10th-century eruption. It is believed that hot materials in the upper mantle of the Arabian Shield are responsible for the formation of all Cenozoic volcanic rocks known as Harrats including Harrat Rahat (Camp and Roobol, 1992).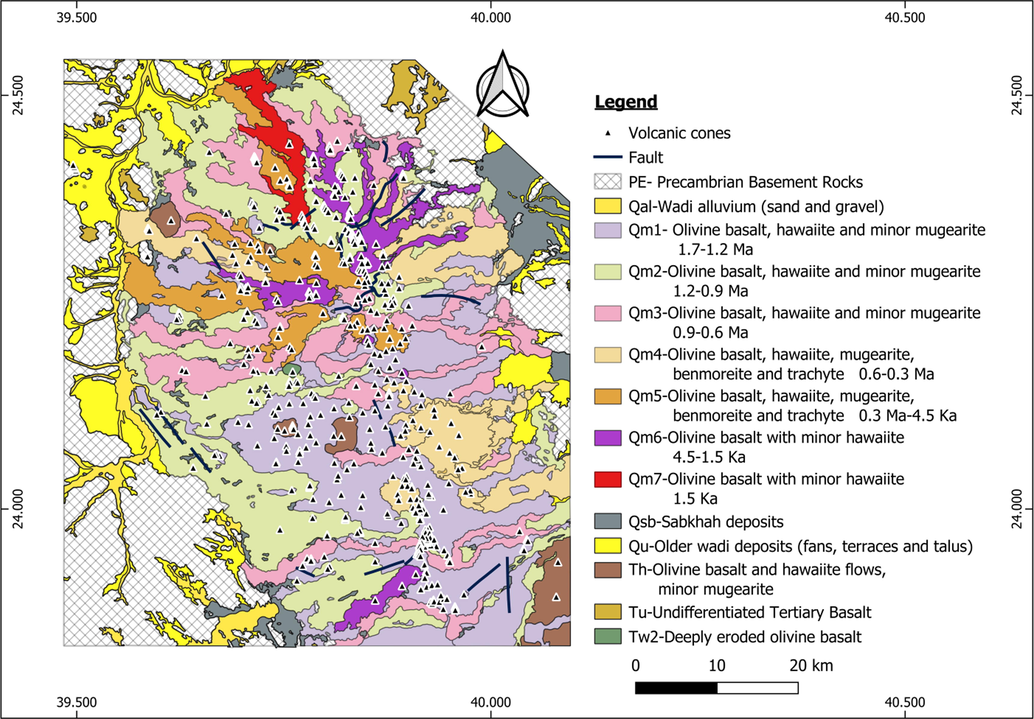
General geological and some other surface features in the study area (After Aboud et al., 2022).
3 Data and methods
3.1 Data and calculation of Green functions
Digital wave recordings were collected from twelve broadband seismic stations that were established by the Saudi Geological Survey (SGS) in north Harrat Rahat. Velocity sensors of Trillium 120 s combined with Trident digitizers represented the main components of all instruments. Locations of seismic stations and ray-path coverages between seismic stations are depicted on a map in Fig. 1.
We employed the cross-correlation method, which is often used to cancel out the typical instrumental phase response and enhance the impact of the instrumental amplitude response. To reduce the impacts of earthquakes and non-stationary noise sources near seismic stations, a whitening process was used to reduce amplitude distortion. Higher signal-to-noise ratios are often provided through cross-correlation calculations that were performed between station pairs with longer time-series lengths (Bensen et al., 2008). In this analysis, we used digital waveform data for continuous recordings that represented six months starting from January 1 to June 2014. The seismic noise records are processed in 46 half-hour portions starting at 00:30 and finishing at 23:30 to enhance the signal-to-noise ratio and prevent potential data loss due to the start and end times of the original raw data (Cho et al., 2007). To provide a flat amplitude spectrum in the 0.05–5 Hz band tapered to zero in the frequency range 0.02–8 Hz, the half-hour segment spectra are whitened. The phase bias of the instruments is subsequently removed by cross-correlating the whitened traces with corresponding instrumental responses. All 46 half-hour cross-correlation functions were symmetrically calculated and stacked over the corresponding frequency band.
To obtain the empirical Green's functions, all-day stacks that are available for each station pair are stacked. Using computer programs in seismology written by Herrmann and Ammon (2004), we adapted some scripts for this procedure. For the Rayleigh wave extractions, Empirical Green's functions were recovered over all conceivable ray paths. Fig. 3 illustrates an example of retrieving the empirical Green's function between vertical component recordings.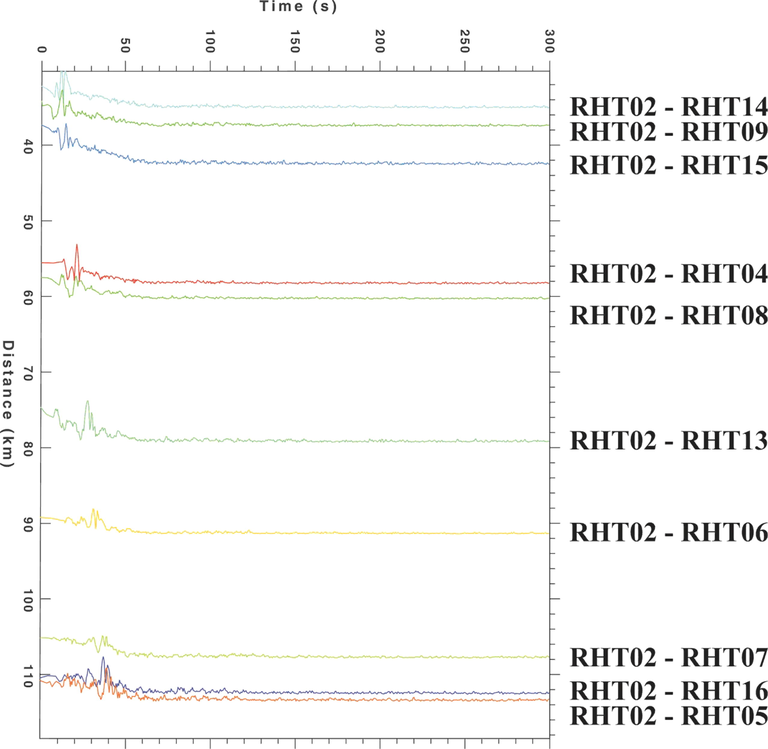
Rayleigh wave generations on the vertical component at interstation distances between station pairs are demonstrated using the cross-correlation technique using the continuous records of station RHT02 and those recorded at other stations.
3.2 Group velocity measurements
A multiple-filter method was used to estimate the dispersion curves of Rayleigh-wave fundamental modes from each retrieved empirical Green's function (Dziewonski et al., 1969; Herrmann, 1973). In order to satisfy the requirement for employing the cross-correlation approach with ambient seismic noise, the dispersion curves of group velocity were measured for station pairs that are at least two wavelengths apart (Brenguier et al., 2007). The accessibility to exclude signals of earthquakes, quarries, explosions, and other abnormal sources from the data resulting from natural noise is one of the advantages of the cross-correlation technique (Herrmann and Ammon, 2004). Only the intelligible dispersion curves were chosen while the distorted ones were disregarded. The multiple filter analysis (MFA) of the vertical components between station pairs produced the group velocities that were displayed in Fig. 4 as an example of the distribution of frequency-time for the fundamental mode of the Rayleigh wave. On the right of Fig. 4, the band pass filtered signal is shown. The fundamental modes were well extracted by the band-pass filter with corners at 0.03 and 1 Hz that was employed for all seismograms after the data trend was eliminated.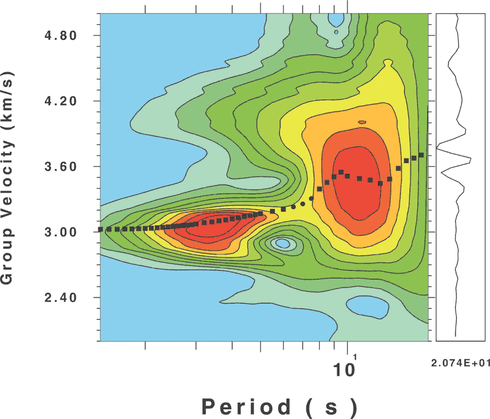
A diagram shows the distribution of Frequency-time for the fundamental mode of the Rayleigh wave (time series on the right side) that was obtained at the interstation distance between the two stations RHT02 and RHT16.
Because the dispersion curves are flattened and the signal-to-noise ratios are weakened, it is frequently difficult to explicate contour maps generated by the MFA. Owing to the objective of this study is to explore the shallow structure above a depth of 30 km in north Harrat Rahat, we used short interstation distances to avoid relatively long interstation distances that potentially restrict the use of high-frequency dispersion data. Furthermore, we trapped the energy of signals within the periods ranging between 1 and 15 s, which were used to retrieve the Rayleigh wave group velocities that corresponded to investigate shallow structures. At a central frequency of 0.25 Hz, the highest possible number of 138 ray paths was attained. Fig. 5 shows examples of dispersion curve measurements along several travel paths. The figure shows that the dispersion curves revealed significant discrepancies that are attributed to considerable lateral heterogeneities, throughout various travel paths, which are commonly distributed in the lithosphere of the Arabian Shield.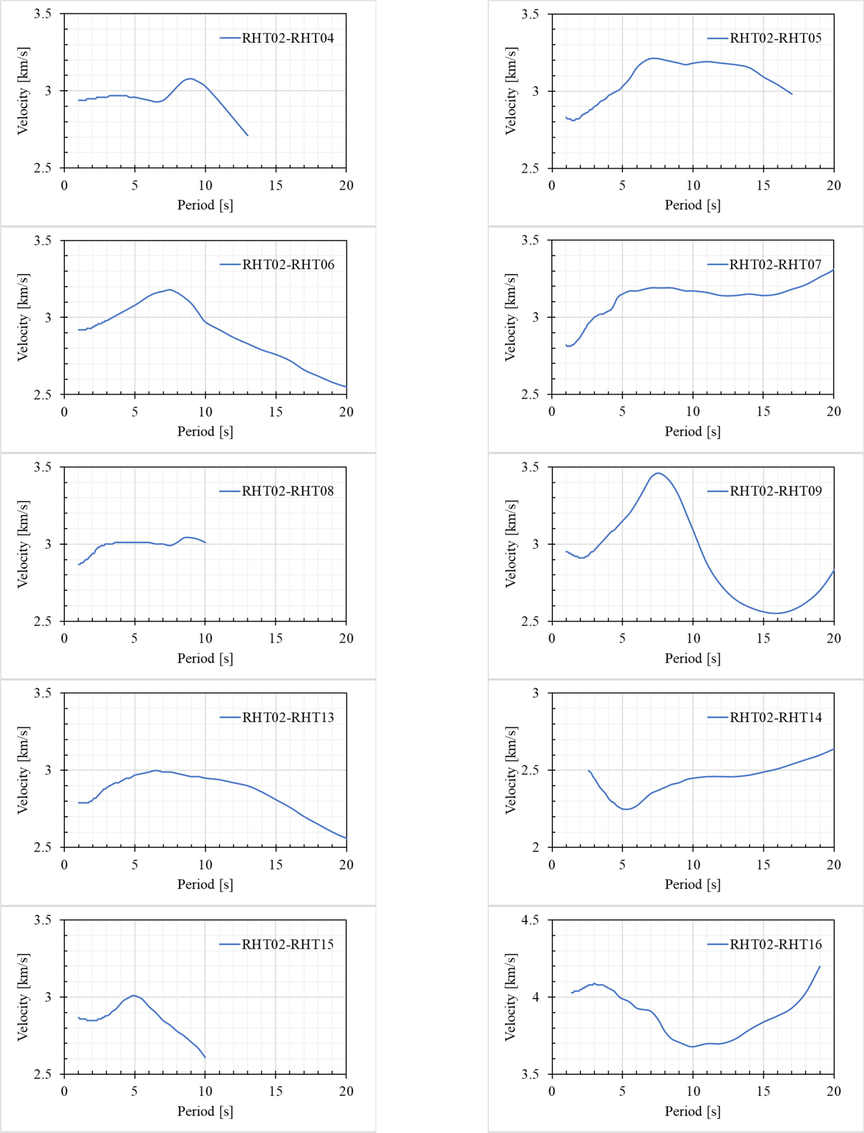
Examples of the dispersion curves designating at the nodes the interstation distance between station pairs.
Using the SURF96 package (Herrmann and Ammon, 2004), the dispersion curves were inverted to produce a one-dimensional velocity model at 138 nodes of each grid to enhance depth resolution. In order to recover the one-dimensional velocity model from the inversion of Rayleigh wave dispersion curves, the one-dimensional velocity model of Rodgers et al. (1999) was used as an initial model. At selected grid nodes denoted by the interstation distance between each station pair, the velocity structure fitted to the dispersion curves as shown in Fig. 6. Additionally, the derived velocity models related to observed and theoretical dispersion curves are displayed in Fig. 6.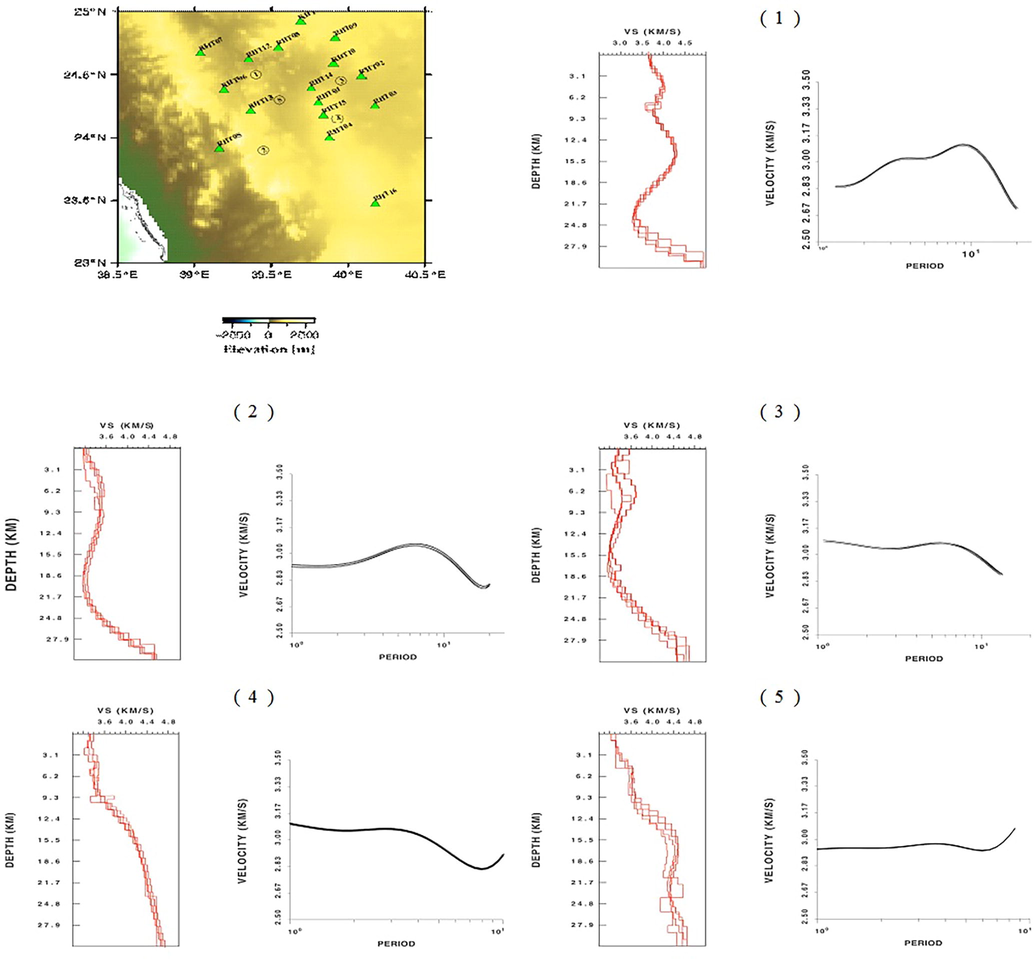
Spatial locations of selected nodes and their corresponding dispersion curves and velocity models that demonstrated the variation of shear wave velocities versus depths. One-dimensional velocity models and dispersion curves are designated by the numbers shown on the spatial location map.
3.3 Group velocity tomography
We calculated the group velocities of fundamental modes by measuring the travel times over a range of defined periods between 1 and 15 s and the interstation distance between station pairs. After obtaining the dispersion curves that depict the travel path between station pairs, maps of the retrieval Rayleigh-wave group velocities were produced using a non-linear iterative 2-D tomographic method (Rawlinson et al., 2008).
The ray paths between station pairs were simultaneously updated during the inversion processing to take into consideration the impact of the ray lengths while theoretical arrival times are calculated. The Fast Matching Method (FMM; Rawlinson and Sambridge, 2004a, b) is employed in this inversion approach to represent group velocity tomography of Rayleigh waves. In tectonic and volcanic settings which are characterized by extreme heterogeneities, the FMM depending on a grid Eikonal solution that incorporates implicit wavefront generation was performed to obtain stable and reliable solutions for wave propagation.
Half-space velocity is the approximation model used to start the inversion procedure. The only variable parameter is the S-wave velocity that updates for each layer during the iteration process. The inversion procedure keeps searching for variations in the model's parameters until the group velocity that reflects the best match is found. The tomographic inversion was carried out using a discretized grid of 0.2° × 0.2° cells at each period, which demonstrated an acceptable resolution and stability of the inversion findings. Synthetic checkboard tests were performed to examine the geometrical resolution of ray trajectories depicting between station pairs. For each corresponding period, a constant velocity perturbed by 0.5 km/s from the apparent average group velocity was allocated to each test model. The same scheme and parameters used for the observational arrival times were performed to compute and invert the synthetic arrival times for each station pair. To assess the sensitivity to various size configurations, a range of different grid sizes was examined. The most logical resolution is represented by a grid with cells that are 0.2° × 0.2° in size. The checkboard resolution test for the 0.2° × 0.2° grid size is shown in Fig. 7 for the same ray trajectories of the observed Rayleigh waves at the corresponding periods.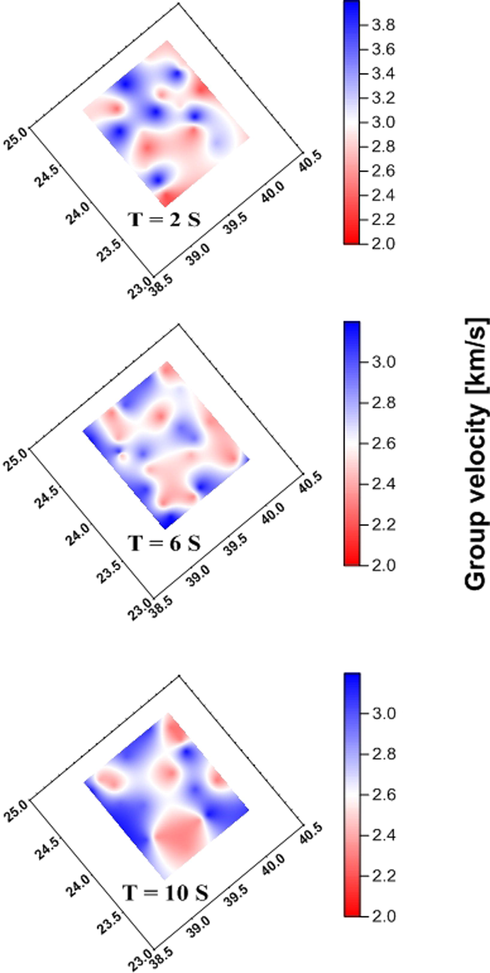
The analysis of checkboard resolution using a grid size of 0.2° × 0.2°.
To recover the 3-D model of S-wave velocities in the upper crust of Harrat Rahat, an inverted one-dimensional S-wave velocity profile was created for each node in a manner equivalent to Bensen et al. (2009). Each 1-D model's velocities at 1 km depth intervals were interpolated using linear interpolation, and all of the nodes were then smoothed using a minimum curvature spline developed by Smith and Wessel (1990).
4 Results and discussions
To highlight the spatial distribution of the three-dimensional model, slices in Fig. 8 display lateral and vertical variations in shear wave velocities for corresponding depths of 5, 10, 15, 20, and 25 km. Using the same inversion method, the synthetic data were inverted for the group velocity maps and the generated images to validate the original data used. Synthetic arrival time data were calculated for the same distributions of interstation pathways as observations (Fig. 7). We started with checkerboard testing to see how reliable the maps were, using testing models with ±10% velocity perturbations. Fig. 8 shows the group velocity distributions that reveal two prominent anomalies beneath the north Harrat Rahat. Anomaly 1 is a considerably low-velocity zone westward of the study area beneath a depth of 15 km. Anomaly 2 is a low-velocity zone east of the study area above a depth of 15 km. The results of this study are depicted in terms of the spatial distribution of the shear-wave velocity over the latitude and longitude with the depth. Over the depth ranges of 5–10, 10–15, and 15–25 km, the velocity was perturbed with average values of 2.7, 3.0, and 3.2 km/s, respectively.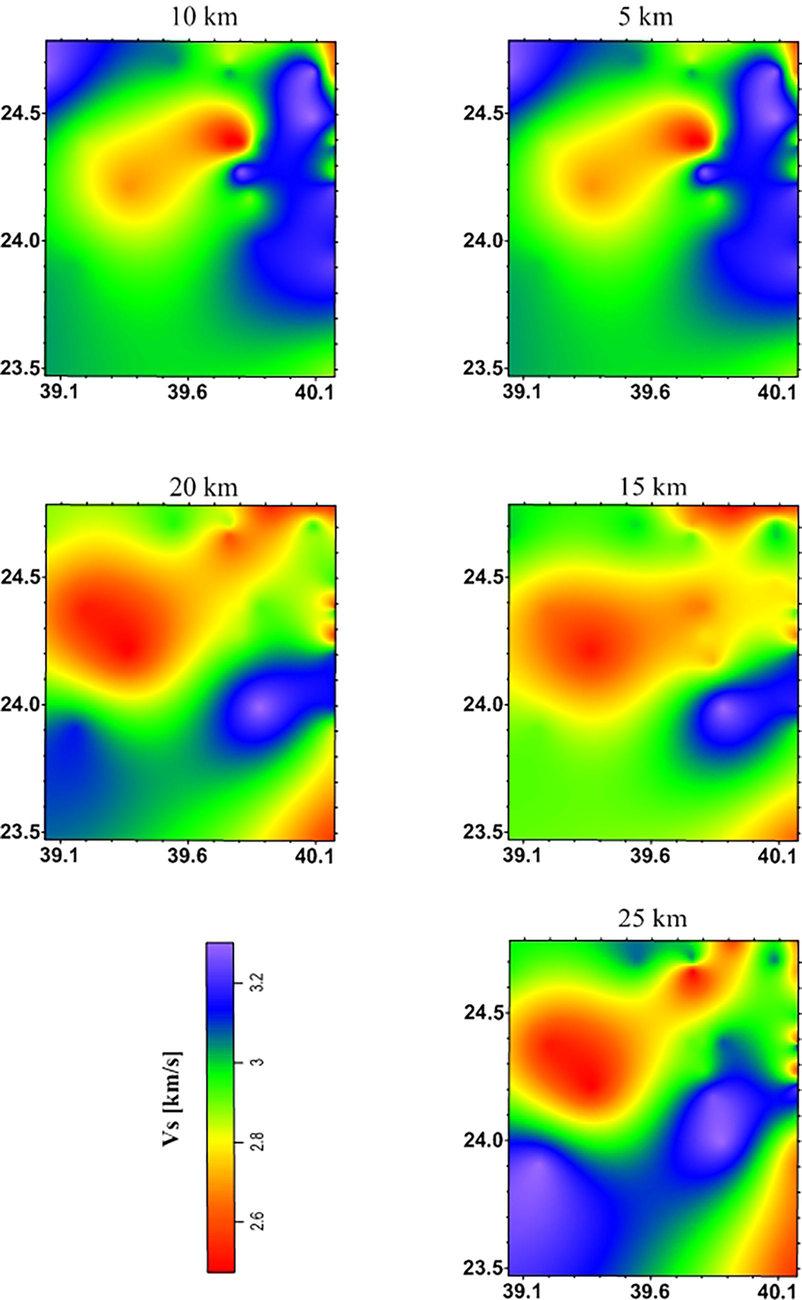
A demonstration of the spatial variations between shear wave velocities and a series of depths of 5, 10, 15, 20, and 25 km.
The current results revealed that the lithosphere under Harrat Rahat is heterogeneous as evidenced by the spatial distribution of three-dimensional velocities. The heterogeneity may be attributed to the complexity of the tectonic phases that ranged from the periods of Precambrian to the active Cenozoic basaltic fields that resulted in the formation of dikes parallel to the Red Sea axial rift, strike-slip faults, normal faults, and Cenozoic volcanisms, characterizing the lithosphere of the Arabian Shield.
The two prominent low-velocity zones that are depicted by the tomographic images in the upper crust of North Harrat Rahat are the most interesting sign in the tomographic pictures derived from this study. The deeper zone is dominant towards the west and the shallower zone is located towards the east. Along with previous studies' hypotheses of Camp and Roobol (1992), Bensen et al. (2009), Choi et al. (2009), Chang and van der Lee (2011), Chang et al. (2011), and Chang et al. (2015), we propose that the simplest explanation for the tomographic images is the existence of magma upwelling from plausible deep sources such as the Red Sea Rifting and Afar plume into the lithosphere of Harrat Rahat. According to this scenario, the spatial distribution of Cenozoic basaltic fields in enriched patterns over the Arabian Shield emphasises that the explanation of magma upwelling is plausible.
The origin of the Cenozoic basaltic fields that enriched along the Arabian Shield is still poorly understood although several studies investigated the velocity structures beneath the Shield. Recently, the ambiguous spatial connection between the Cenozoic volcano in West Saudi Arabia, the Rift Axis of the Red Sea, and deeper low-share wave velocity region of unknown source origin are revealed by regional seismic tomography (Chang et al., 2011). Several models are suggested for the active asthenosphere of the Arabian Shield. A local mantle plume below the Arabian lithosphere has been proposed by Camp and Roobol (1992). Chang and van der Lee (2011) postulated a lateral mantle flow from the Afar plume and possibly from the Jordan hotspot.
Despite various studies that investigated the velocity structures under the Arabian Shield, the formation of the Cenozoic basaltic fields that developed along the Shield is still not well understood and from which sources ascended. A questionable relationship between the Rift Axis of the Red Sea, the spatial distribution of the Cenozoic volcano in the Arabia Shield, and a deeper low-share wave velocity zone with an unexplained source origin have recently been revealed using regional seismic tomography (Chang et al., 2011). For the Arabian Shield's active asthenosphere, many models are suggested. Camp and Roobol (1992) have postulated that a local mantle plume exists under the Arabian lithosphere. A lateral mantle flow from the Afar plume and may be from the Jordan hotspot was proposed by Chang and van der Lee (2011).
On the regional scale, the study of Chang et al. (2011) directed low-shear velocities beneath the southern Red Sea and the western Arabian plate that may support the idea of lateral mantle flow from the Afar. On the global scale, the model deduced by Chang et al. (2015) depicted a low-velocity region that extends from the lower mantle beneath South Africa to the upper mantle beneath the Afar with no clear connection to the low-velocity zones beneath the Arabian Shield. Previous studies of Camp et al. (1987), Camp and Roobol (1992), and Downs et al. (2018) revealed that the velocity structures beneath Cenozoic basaltic fields in the Arabian Shield are characterized by low-velocity zones that are presumably related to lava fields that ahead progressively younger northwards of unknown exact origin. The magma flow under the Arabian Shield has several possible explanations. It is speculated that the Red Sea rift or the Afar plume is thought to be the source of a lateral flow of magma that entered the upper crust of Harrat Rahat (Konrad et al., 2016; Mai et al., 2019). According to the isotopic ratios of Helium from lava flows and mantle xenoliths that were collected from distinct harrats in Saudi Arabia and Yemen, a bimodal distribution of Harrat Rahat is suggested by Konrad et al. (2016) that indicates the lateral magma flow moves from the Afar plume into the Arabian Shield.
The upper lithosphere of the Arabian Shield may be experienced a mixing of morphospheric materials as a result of the effect of thermal erosion and convective instability. Accordingly, the magma plum will be confined to the lava mixture in Harat Rahat. In addition, the Arabian Shield and the Red Sea coastline exhibit a remarkable transition from oceanic crust to continental crust, abruptly, with evidence of crust thickening as we move westward to the eastern coastlines of the Red Sea (Tang et al., 2016). Cenozoic volcanic structures of the Arabian lithosphere have been hypothesized to be recognized by low shear velocities and high temperatures, supporting thermal conductivity due to the magma flow ascending from the Afar plume into the Arabian Shield through fractures in the crust that may give rise to local magma diapers occurred in the Arabian lithosphere (Mai et al., 2019).
To this end, the upwelling of magma plume materials that occur below Harrat Rahat remains an open question that requires a detailed mapping of the border between lithosphere and asthenosphere, as well as the lateral flow of active asthenosphere, which should be modelled beneath the Arabian Shield (e.g., Faccenna et al., 2013). High-resolution data that can give rise to high-resolution tomographic images for deeper depths and cover a large-scale area is required to provide an understandable scenario for the originality of plausible sources and propagation channels of magma flow in the crust and upper mantle beneath Harrat Rahat.
5 Conclusions
The present study focuses mainly on the multiple-analysis stages to explore the crustal structure under Harrat Rahat using continuous data on ambient noise. A total number of 138 nodes, depicted at the interstation distance, between each station pair were represented by Rayleigh wave dispersion curves of fundamental modes that were generated using the cross-correlation approach and stacked for six months of continuous data. An iterative technique was used to retrieve the one-dimensional velocity model at each node. Finally, the three-dimensional structure under Harrat Rahat was depicted using one-dimensional velocity models obtained from this study. Within the upper crust, two low-velocity anomalies were depicted. The shallow anomaly was found at a depth of 5–10 km towards the east of the studied area and the considerable low-velocity anomaly over a depth of more than 15 km was located westward. The results obtained from this study support a magma flow that corresponds to the earlier suggestion of magma upwelling from the deep plausible magma sources of the Red Sea Rift and the Afar plume into the lithosphere of Harrat Rahat. It implies a magma flow coming from the depth of the source westward into the upper crust of Harrat Rahat in the east.
Acknowledgements
This research was supported by Researchers Supporting Project number (RSP2023R425), King Saud University, Riyadh, Saudi Arabia.
Declaration of Competing Interest
The authors declare that they have no known competing financial interests or personal relationships that could have appeared to influence the work reported in this paper.
References
- Geothermal anomaly detection using potential field geophysical data in Raahat volcanic field, Madinah, Saudi Arabia. J. Geol. Geophys.. 2022;11(4):1026.
- [Google Scholar]
- Processing seismic ambient noise data to obtain reliable broad-band surface wave dispersion measurements. Geophys. J. Int.. 2008;169(3):1239-1260.
- [Google Scholar]
- Bensen, G.D., Ritzwoller, M.H., Shapiro, N.M., 2009. Broadband ambient noise surface wave tomography across the United States. J. Geophys. Res. 113, B05306. doi: 200810.1029/2007JB005248.
- 3D surface wave tomography of the Piton de la Fournaise volcano using seismic noise correlations. Geophys. Res. Lett.. 2007;34:L02305.
- [Google Scholar]
- Upwelling Asthenosphere Beneath Western Arabian and Its Regional Implication. J. Geophys. Res.. 1992;97:15255-15271.
- [Google Scholar]
- The Madinah eruption, Saudi Arabia: magma mixing and simultaneous extrusion of three basaltic chemical types. Bull. Volcanol.. 1987;49:489-508.
- [Google Scholar]
- Mantle plumes and associated flow beneath Arabia and East Africa. Earth Planet. Sci. Lett.. 2011;302(3):448-454.
- [Google Scholar]
- Mantle flow beneath Arabia offset from the opening Red Sea. Geophys. Res. Lett.. 2011;38(4)
- [Google Scholar]
- Joint inversion for global isotropic and radially anisotropic mantle structure including crustal thickness perturbations. J. Geophys. Res. Solid Earth. 2015;120:4278-4300.
- [Google Scholar]
- Imaging the upper crust of the Korean Peninsula by surfacewave tomography. Bull. Seismol. Soc. Am.. 2007;97:198-207.
- [Google Scholar]
- Three-dimensional surface wave tomography for the upper crustal velocity structure of southern Korea using seismic noise correlations. Geosci. J.. 2009;13(4):423-432.
- [Google Scholar]
- Coleman, R.G., Gregory, R.T., Brown, G.F., 1983. Cenozoic volcanic rocks of Saudi Arabia. USGS Open-File Report 83–788, 82 pp.
- Seismic evidence for a deeply rooted low-velocity anomaly in the upper mantle beneath the northeastern Afro/Arabian continent. Earth Planet. Sci. Lett.. 2001;193(3):423-436.
- [Google Scholar]
- Volcanic history of the northernmost part of the Harrat Rahat volcanic field, Saudi Arabia. Geosphere. 2018;14(3):1253-1282.
- [Google Scholar]
- A technique for the analysis of transient seismic signals. Bull. Seismol. Soc. Am.. 1969;59:427-444.
- [Google Scholar]
- Mantle convection in the Middle East: Reconciling Afar upwelling, Arabia indentation and Aegean trench rollback. Earth Planet. Sci. Lett.. 2013;375:254-269.
- [Google Scholar]
- Seismic evidence for significant melt beneath the Long Valley Caldera, California, USA. Geology. 2018;46(9):799-802.
- [Google Scholar]
- Investigating the P wave velocity structure beneath Harrat Lunayyir, northwestern Saudi Arabia, using doubledifference tomography and earthquakes from the 2009 seismic swarm. J. Geophys. Res. Solid Earth. 2013;118(9):4814-4826.
- [Google Scholar]
- Herrmann, R.B., Ammon, C.J., 2004. Computer programs in seismology. Manual of the Generic Seismic Application Coding (GSAC). Saint Louis University (Version 3.30).
- Some aspects of band-pass filtering of surface waves. Bull. Seismol. Soc. Am.. 1973;63(2):663.
- [Google Scholar]
- Johnson, P.R., Kattan, F.H., 2012. The Geology of the Saudi Arabian Shield, Saudi Geological Survey.
- Tensile rock mass strength estimated using InSAR. Geophys. Res. Lett. 2012
- [CrossRef] [Google Scholar]
- Konrad, K., Graham, D.W., Thornber, C.R., Duncan, R.A., Kent, A.J., Al-Amri, A.M., 2016. Asthenosphere–lithosphere interactions in Western Saudi Arabia: Inferences from 3He/4He in xenoliths and lava flows from Harrat Hutaymah. Lithos 248, 339–352. doi: 10.1016/ j.lithos.2016.01.031.
- Structural cause of a missed eruption in the Harrat Lunayyir basaltic field (Saudi Arabia) in 2009. Geology. 2015;43(5):395-398.
- [CrossRef] [Google Scholar]
- Mai, P.M., Julia, J., Tang, Z., 2019. Crustal and Upper-Mantle Structure Beneath Saudi Arabia from Receiver Functions and Surface Wave Analysis. Geological Setting, Palaeoenvironment and Archaeology of the Red Sea, 307–322.
- The role of inherited crustal and lithospheric architecture during the evolution of the Red Sea: Insights from three dimensional analogue experiments. Earth Planet. Sci. Lett.. 2020;544:116377
- [Google Scholar]
- Mokhtar, T., Shawali, J., Abdelwahed, M., Runge, M., Kenedi, C., 2013. The 1999 micro-earthquake swarms of Northern Harrat Rahat. In: Proceedings of the Volcanic Risks in Saudi Arabia (VORISA) Scientific Meeting, November 17th–18th, 2013, King Abdulaziz University, Jeddah, Kingdom of Saudi Arabia.
- Seismic noise-based time-lapse monitoring of the Valhall overburden. Geophys. Res. Lett.. 2013;41:4945-4952.
- [CrossRef] [Google Scholar]
- Wave front evolution in strongly heterogeneous layered media using the fast marching method. Geophys. J. Int.. 2004;156:631-647.
- [Google Scholar]
- Multiple reflection and transmission phases in complex layered media using a miltistage fast marching method. Geophysics. 2004;69:1338-1350.
- [Google Scholar]
- A dynamic objective function technique for generating multiple solution models in seismic tomography. Geophys. J. Int.. 2008;174:295-308.
- [Google Scholar]
- Lithospheric structure of the Arabian Shield and platform from complete regional waveform modelling and surface wave group velocities. Geophys. J. Int.. 1999;138:871-878.
- [Google Scholar]
- High-resolution surface wave tomography from ambient seismic noise. Science. 2005;307:1615-1618.
- [Google Scholar]
- Gridding with Continuous Curvature Splines in Tension. Geophysics. 1990;55(3):293-305.
- [CrossRef] [Google Scholar]
- Continental lithosphere of the Arabian Plate: a geologic, petrologic and geophysical synthesis. Earth Sci. Rev.. 2010;101:29-67.
- [Google Scholar]
- The lithospheric shear-wave velocity structure of Saudi Arabia: Young volcanism in an old shield. Tectonophysics. 2016;680:8-27.
- [CrossRef] [Google Scholar]
Appendix A
Supplementary material
Supplementary data to this article can be found online at https://doi.org/10.1016/j.jksus.2022.102523.
Appendix A
Supplementary material
The following are the Supplementary data to this article:


