

Translate this page into:
Mapping novel QTLs for tolerance to salt stress at the late vegetative stage in durum wheat (Triticum durum L.)
⁎Corresponding author. turki.najla@hotmail.fr (Nejla Turki), turkinajla@gmail.com (Nejla Turki),
-
Received: ,
Accepted: ,
This article was originally published by Elsevier and was migrated to Scientific Scholar after the change of Publisher.
Peer review under responsibility of King Saud University.
Abstract
Salt stress adversely affects the global durum wheat productivity. Breeding for salinity tolerance is an effective approach to improve crop production under saline conditions provided it is based on a good understanding of the genetic control of salinity tolerance. The present study was conducted, at the university of Tsukuba (in 2014), with the objective of mapping QTLs conferring salt tolerance in F2:3 populations of durum wheat derived from a cross between Razzek (salt sensitive variety) and Saragolla (salt tolerant variety). Two QTLs for salt tolerance were detected on chromosome 4B and 5B conferring the proportion of dead leaves with major effects. These two QTLs, which explained 68% of total phenotypic variation of %DL are an ideal candidate for Marker Assisted Selection (MAS) in wheat breeding programs and selection strategies to increase wheat production under saline conditions in order to meet the increasing global demand.
Keywords
Salt tolerance
Durum wheat
QTL analysis
Marker Assisted Selection

- QTL
-
Quantitative trait locus
- PCR
-
Polymerase Chain Reaction
- SSR
-
Simple sequence repeats
- %DL
-
Proportion of dead leaves
Abbreviations
1 Introduction
Durum wheat (Triticum turgidum L. var durum) is one of the most widely grown cereal crops in the world, which is mainly grown in South European, North African and West Asian countries (Maccaferri et al., 2003). The cultivation areas of durum wheat largely overlap those of bread wheat, but durum is less widely grown than bread wheat. Additionally, durum wheat is better adapted to Mediterranean dry land than bread wheat. This is the reason why durum wheat production and cultivation areas are concentrated in the Mediterranean. Moreover, the countries of the Mediterranean basin are the largest importers and the largest consumers of durum wheat products (flour, pasta, and semolina) (Xynias et al., 2020).
These areas, where durum wheat is grown, are facing an increase of temperature due to the climate change. In particular, global warming has rapidly increased abiotic stresses in durum wheat and have substantial impacts on its yields. Salinity is one of these abiotic stresses, which lead to soil degradation. Salt stress affects 20 % of global cultivable land and is increasing continuously owing to the change in climate and anthropogenic activities (Arora, 2019). This problem is more acute in arid and semi-arid areas because of high evaporation rates in the soil. To cope with this risk, several issues should be addressed in breeding resistant cultivars of durum wheat to salt stress.
Salt stress altered water status leads to initial growth reduction and limitation of crop productivity (Shrivastava and Kumar, 2015). The immediate response to salt stress is reduction in the rate of leaf surface expansion inducing plant death (Wang and Nii, 2000). Salt stress also affects fresh and dry weights of leaves and stems and results in decrease of productivity. The suppression of plant growth occurs during all development stages however, the response to salt stress widely changes among different plant species (Ondrasek et al., 2021). Intraspecific and interspecific variation in response to salt stress gives us a great impact on a new challenge for better understanding of the machinery involved in salt tolerance and for crop breeding programs.
QTL mapping has been a key tool to study the genetic architecture of complex traits in plants. Most agronomically important traits such as yield, grain quality and resistance/tolerance to biotic and/or abiotic stresses are complex traits. QTL mapping of traits is the best method to understand the genetic basis between important traits (Xu et al., 2017). In this way, different QTLs associated with salt tolerance have been detected in cultivated crops such as: soybean (Cho et al., 2021); maize (Luo et al., 2019), rice (Singh et al., 2020; (Ahmadizadeh et al., 2021) and wheat (Hu et al., 2021); (Genc et al., 2010); (Turki et al., 2015). Although most of QTL mapping studies in cereals have been limited to salt tolerance at seedling-stage tolerance because phenotyping for salt tolerance at reproductive stage is very tedious and time consuming. Only few studies on QTL analysis of salt tolerance at either the late vegetative or reproductive stage in durum wheat have been reported. Thus, the prime objective of the current study is mapping QTLs conferring salt tolerance at the late vegetative sage in F2:3 populations of durum wheat derived from a cross between Razzek (salt sensitive variety) and Saragolla (salt tolerant variety).
2 Materials and methods
2.1 Growth conditions and phenotyping
A seedling stage experiment was conducted in a vinyl house under natural day-length conditions (13/11 h) (the temperature ranged from 20 to 25 °C) at the University of Tsukuba, Japan. The soil used in this experiment contained 200 mg/L of N, 1000 mg/L of P and 200 mg/L of K. Ten seeds per line were sown in plastic pots (30 cm diameter). At the 2-leaves stage, the sample was thinned to eight per pot. 163 F3 lines, each derived from bagged seeds of a single F2 plant, and the two parents were subjected to 100 mM of NaCl (approximately 10 dS m−1) at three leaves stage (Z13). Sixty days later, the proportion of dead leaves for each line was calculated.
2.2 DNA extraction and genotyping
DNA extraction of F2 population and the two parents was carried out using leaves of 25-day-old plants. Isolation of the DNA from the leaf tissues was based on the CTAB method as described by Murray and Thompson (1980). Chloroform-isoamyl alcohol (24:1) extraction was used to eliminate proteins and plant debris. The precipitation of DNA was occurred by adding 2-propanol, after that the precipitate was rinsed with 70 % and then 95.5 % ethanol. The final precipitate was dissolved in 50 µL 1/10 TE and stored at 4 °C.
2.3 Screening of SSR markers
The parental lines were subjected to genotypic screening using 244 SSR markers; and 57 primers exhibiting polymorphism were used to amplify the DNA of each plant of F2 population derived from the cross between selected parents. The other primer sets were discarded because no band, or no polymorphic nature.
The following markers were used, barc (Song et al., 2005), cfa (Sourdille et al., 2003), cfd (Guyomarc’h et al., 2002), gdm (Pestsova et al., 2000), gwm (Roder et al., 1998) and wmc (Gupta et al., 2002).
2.4 PCR conditions and electrophoresis
Polymerase chain reaction (PCR) was carried out using 25 ng of template DNA. PCR amplification was performed on a thermal cycler (Biometra Uno II, Göttingen, Germany) in University of Tsukuba, Japan. The PCR profile was maintained as initial denaturation at 94 °C for 2 min, and then the reaction was subjected to 40 cycles of 94 °C for 30 s, annealing temperature for 1.3 min, and 72 °C for 30 s, with a final elongation step of 7 min at 72 °C. The annealing temperature changed depending on the marker. The amplification products were separated on 8 % acrylamide gel with ethidium bromide in TBE buffer (10 × ). Finally, the gel was photographed using Kodak Digital Science EDAS 290 ver.3.6 with Kodak ID Image analysis software ver.3.5. Different bands for the same SSR primer were grouped according to their respective size in comparison with a 100 bp ladder DNA size marker.
2.5 Construction of linkage maps and identification of QTLs conferring salt tolerance
Genotypic data of 32 SSR markers were used for QTL analysis. This data set was used for mapping the quantitative trait loci associated with salt-tolerance of F2:3 population. Map distances between primers were measured in cM using the function of the mapping program (Kosambi, 1943). To determine both the linkage groups and the order of markers a logarithmic odds (LOD) score of 2.5 was used. The initial linkage map was constructed based on segregation at 32 SSR markers loci using Mapdisto software (Lorieux, 2012). QTL cartographer (Basten et al., 2001) was used to identify QTLs conferring salt tolerance on the basis of composite interval mapping analysis. The percentage of total phenotypic variation explained by each QTL, and the additive effects were estimated by this software. Test performed at 2-cM interval, and cofactors were selected by forward/backward stepwise regression (Model 6) with QTL Cartographer v 2.5 (Basten et al., 2001). Significance threshold for composite interval mapping (CIM) was determined at likelihood ratio (LR) 11.5 (LOD = 2.5). The phenotypic variation explained by a QTL (r2) conditioned by the CIM cofactors included in the model was calculated at the most likely QTL position. The additive effect of an allelic substitution at each QTL was also obtained. The LOD peak of each significant QTL was considered as the QTL location on the linkage map.
3 Results
3.1 Choice of parental varieties for QTL analysis
119 genotypes were tested for salinity tolerance. The proportion of dead leaves was significantly increased under salinity compared to control conditions. This trait (%DL) ranged from 0 to 100 %, with an average of 48.5 % as previously reported by Turki et al. (2015). Based on these results, two parental varieties, Saragolla and Razzek, showing a higher genotypic and phenotypic variation (Fig. 1), were used with their progenies lines to detect QTLs controlling the %DL under salt stress.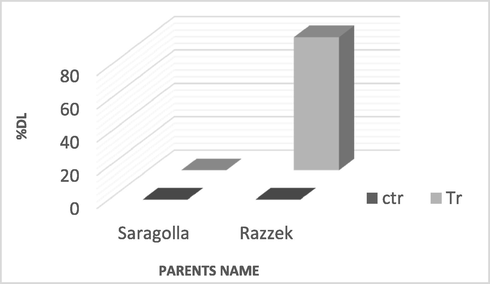
Variation of the proportion of dead leaves within wheat parents under control and stress conditions.
The selection criterion of proportion of dead leaves (%DL) was based on previous findings in our publication (Turki et al., 2015) as the most suitable parameter for assessment of salinity tolerance in durum varieties at early vegetative stages because of a broader range of variation among varieties and narrower range of variation within varieties compared to other traits.
3.2 Phenotypic data analysis of F3 population
The proportion of dead leaves (%DL) varied widely among the parental varieties and their F3 lines grown in pots under salt stress condition. The tolerant parent (Saragolla) showed 0 % of %DL, whereas the sensitive parent (Razzek) showed around 80 % of %DL. The frequency distribution for %DL in the F3 lines ranged from 0 to 80 % and was without transgressive segregation (Fig. 1). The analysis indicated considerable differences between the parental varieties and their F3 lines with regards to the variation in response to salt stress. Analyses of variance showed a significant variation within F3 lines due to the segregation of %DL. The coefficient of heritability of %DL was greater than 0.5 (Table 1). This result showed that most of the variance in %DL was based on the genetic variance between two varieties. This may reduce the environmental effect and give high values of heritability.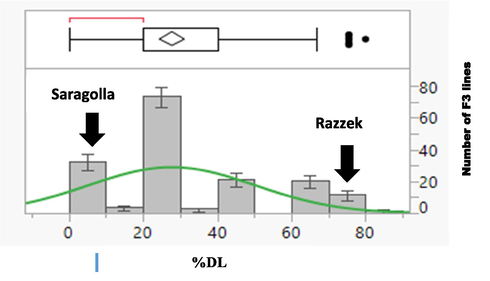
Variation of the proportion of dead leaves in F3 lines and their parents under salt stress.
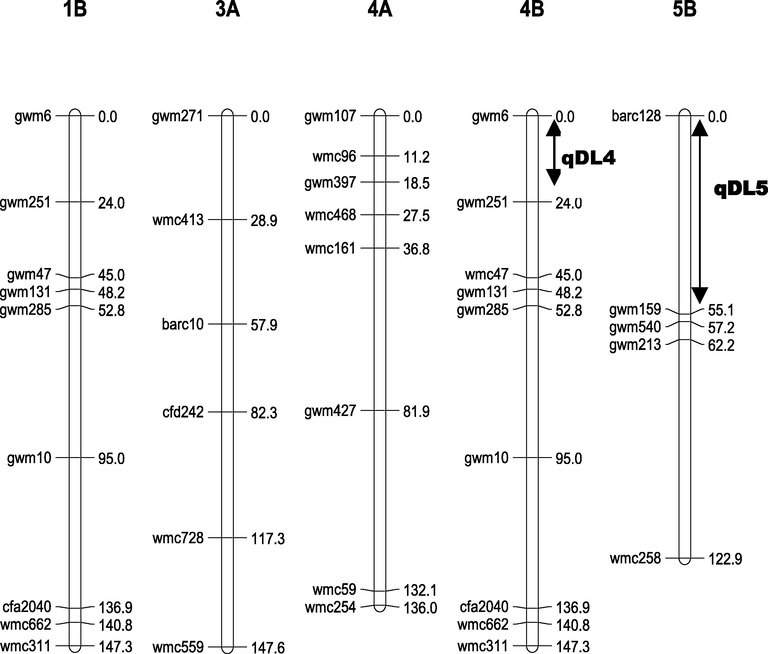
Genetic map and Location of QTLs on chromosomes 4B and 5B.
Source Of variation
SS
DF
MS
F
P value
Fcrit
VG*
VE*
VP*
Heritability
Between F3 lines
14593,24
5
2918,64
3,82
0,0019
2,22
1078,18
762,27
1840,45
0,59
Within F3 lines
750078,14
984
762,27
Total
764671,39
989
3.3 Construction of linkage map and identification of QTLs conferring %DL under salt stress
Of the 244 markers screened using the parental varieties, a total of 57 SSR primers generated clear polymorphic band between two parental varieties. The polymorphic SSR markers were used for the construction of linkage map and QTL analysis for salt tolerance in durum wheat. The final linkage map containing 32 SSR markers spanning whole genome was constructed.
Using composite interval mapping analysis, two QTLs, qDL4 on chromosome 4B and qDL5 on chromosome 5B conferring %DL were identified in the F2:3 plants grown under salt stress condition (Table 2). The qDL4 on chromosome 4B explained 25 % of phenotypic variation and qDL5 on chromosome 5B explained 43 % of phenotypic variation. The qDL4 and qDL5 had an additive effect of 1.74 and −2.88, respectively. Saragolla allele at qDL4 decreased %DL while Saragolla allele at qDL5 increased %DL.
QTLs
Chr
Interval
LOD score
Additive effect
Phenotypic variation (%)
qDL4
4B
gwm6
wmc251
13.34
1.75
25
qDL5
5B
barc128
gwm159
23.75
−2.85
43
3.4 Association between alleles at franking marker loci and variation in phenotypic values
The association between alleles at franking marker loci and variation in phenotypic values was evaluated among durum wheat varieties used in this study. The phenotypic data (%DL) was recorded in all genotypes with the same allele at SSR marker loci as each parent. Regarding qDL4, the genotypes at SSR marker loci co-segregated with salt tolerance. These results were confirmed by the significant (α = 0.05) variation between tolerant and sensitive varieties on the basis of %DL (Table S1, Table S2).
Varieties with Saragolla allele at SSR marker locus, gwm251 varied from 0 % to 70 % in %DL, while varieties with Razzek allele at gwm6 varied from 20 % to 70 %. The distribution of %DL in two groups overlaps (Fig. 4). Varieties with Saragolla allele at SSR marker locus, gwm6 varied from 0 % to 70 % in %DL, while varieties with Razzek allele at gwm6 varied from 20 % to 100 %. The distribution of %DL in two groups overlaps (Fig. 5).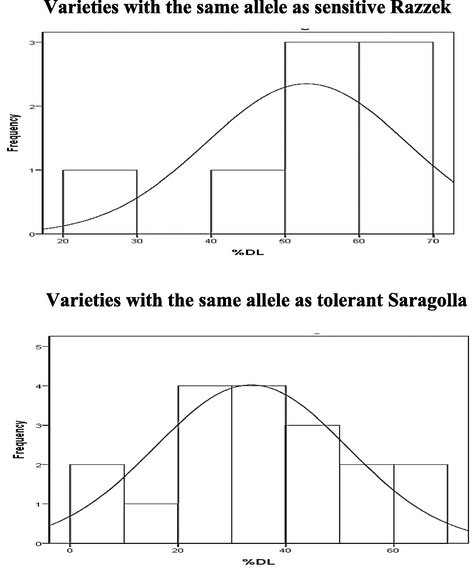
Frequency distribution of %DL in varieties with the same alleles as sensitive and tolerant parents at the nearest SSR marker locus gwm6.
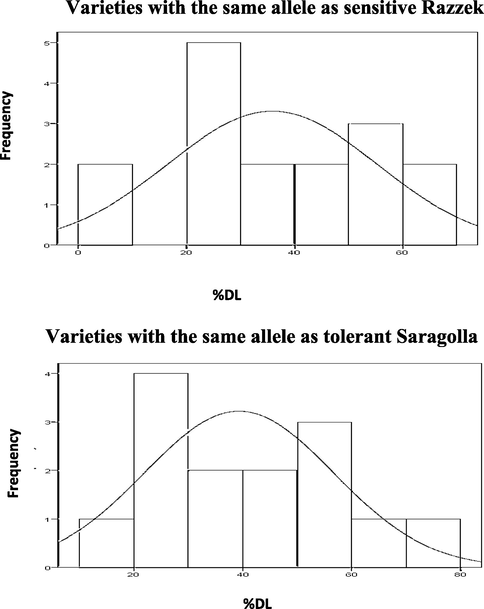
Frequency distribution of %DL in varieties with the same alleles as sensitive and tolerant parents at the nearest SSR marker locus gwm159.
4 Discussion
Tolerance to salinity is a complex trait and plants adopt various mechanisms that contribute to salinity tolerance (tissue tolerance, sodium exclusion, osmotic stress tolerance, tissue-specific sodium sequestration), with many transporter genes associated with sodium exclusion process within plants such as those members of the HKT (for high-affinity K+ transporter) family of K+ and Na+ transporters which are implicated to control natural variation in salt tolerance at a number of loci in rice, wheat, and Arabidopsis (Zhao et al., 2020). Two loci, Nax1 and Nax2, controlling shoot Na accumulation were identified by QTL mapping in durum wheat. TmHKT7-A2 is the candidate for Nax1 on long arm of chromosome 2A. TmHKT1;5-A (HKT8) is the candidate for Nax2 on long arm of chromosome 5A, and the corresponding homolog in the D genome (TaHKT1;5-D) is the candidate for the Kna1 gene on chromosome arm 4DL, which is responsible for the superior salt tolerance of bread wheat compared with durum wheat (James et al., 2012). Nax1 promotes Na retention in the leaf sheath relative to the leaf blade, whereas Nax2 and Kna1 do not affect this relative accumulation, suggesting that the former promotes xylem unloading of Na in leaf sheath as well as in roots (James et al., 2012). Many researchers studied the relationship between salt tolerance, Na+ concentration and many others agronomic parameters (Genc et al., 2010; (Sharbatkhari et al., 2013).
In this study, all F3 lines evaluated showed an apparent increase in the proportion of dead leaves under salt stress. This result is in accordance with (Hannachi et al., 2022)) who reported that salinity leads to injury of photo-synthetically active leaves by causing chlorosis and triggering leaf senescence. The variation of the proportion of dead leaves among durum wheat varieties including tolerant Saragolla and sensitive Razzek and their F2 population and F3 lines grown under salt stress (Fig. 2) might be related to their ability to prevent from salt toxicity in the leaves. Such results are in agreement with Munns et al. (2016) who reported that sensitive genotypes resulted in the death of old leaves and injury to new leave that may become succulent to dilute the salts under stress condition which salt is not effectively excluded from the transpiration stream, and salt accumulates to toxic levels in the leaves, Thus, only tolerant plants may enable to cope with salt stress and prevent salt from reaching toxic levels in the transpiring leaves by producing photo synthetically active leaves.
In rice, barley and sorghum, leaf death rate was considered as a selective parameter for salt tolerance. The ionic stress is associated with a reduction in chlorophyll content and inhibits photosynthesis, inducing leaf senescence and premature leaf death. In our previous study, we detected a correlation between the proportion of dead leaves and yield related parameters (Turki et al., 2015). Similarly, the survival of plant highly depends on leaf death rate. If production of new leaves is more than older leaves, plants have enough leaves for flowering and seeds production. Conversely, if death rate of older leaves is greater than production of new leaves, plants cannot continue to grow. Therefore, the proportion of dead leaves is an important parameter for the evaluation of salt tolerance in crops.
Our study detected two QTLs for the proportion of dead leaves (%DL) under salt stress. These are qDL4 on chromosome 4B and qDL5 on chromosome 5B. These QTLs explained 25 and 43 % of phenotypic variation, respectively. The qDL4 was mapped in the region delimited by gwm6 and gwm251 (24 cM) (Fig. 3) on chromosome 4B. Similarly, Xu et al. (2013) detected that the region xgwm6-xgwm538 on chromosome 4B was a major locus for total dry weight under salt stress. The marker xgwm6 may be useful for marker-assisted selection. QTL for seedling shoot biomass and tiller number under salt tolerance was also located in a similar region near the marker xgwm6 (Genc et al., 2010). Additionally, QTL for %DL was mapped to the neighboring region of the marker gwm251 on chromosome 4B using LD association analysis (Turki et al., 2015). A QTL for root K+ concentration under salt stress was also detected on chromosome 4B (Hussain et al., 2017). Ren et al. (2018) identified 3 QTLs for salt tolerance on the similar region of chromosome 4B: one QTL for root dry weight, one QTL for shoot dry weight and one QTL for total dry weight. These findings confirm the importance of loci identified in our study and previous studies for maintaining biomass production under salt stress by reducing the number of dead leaves and increasing shoot and root dry weights. Thus, this region on chromosome 4B may be useful for genetic improvement of salinity tolerance in durum wheat.
QDL5 was mapped in the region delimited by barc128 and gwm159 with long distance (0–55 cM) (Fig. 3). QTLs for the number of leaves and the root length were detected in a region adjacent to qDL5 (Turki et al., 2015). One of the recent studies found genomic regions for adult stage salt tolerance on chromosome 5B using genome-wide association study (Hu et al., 2021). Similary, Ghaedrahmati et al. (2014) mapped QTL for shoot fresh weight at seedling stages on chromosome 5B using 254 recombinant inbred lines (RILs) The group-5 chromosomes appear to harbor genes associated with abiotic stress resistance, and several QTLs for grain yield and related traits under salt-stress conditions were especially located on the group-5 chromosomes of wheat (Hu et al, 2021). Salt responsive-genes were also identified by Mehta et al. (2021) on different chromosome locations including 4B (eight genes) and 5B (twelve genes) chromosomes using candidate gene based SSRs (cg-SSRs) and MIR gene based SSRs (miR-SSRs). These genes were detected with various functional groups, among the latter, 33 %, 24 %, 10 %, 6 %, 6 % and 4 % of the total salt stress responsive genes belongs to transcription factors, signaling and kinase, transporter, biosynthesis, DNA/RNA modification and antioxidation, respectively (Mehta et al., 2021).
In our study, the long distance found between flanking markers in qDL5 gave inaccuracy about its chromosomal location between these two markers. For this reason, further analyses are required to better understand the relationship between qDL5 and flanking markers. The marker gwm159 was mapped with the genetic distance of 55 cM but the linkage between gwm159 and qDL5 was not confirmed because there was no difference in %DL between varieties with the same allele as tolerant and sensitive parents at gwm159 locus (Table S3). These results were also confirmed by the frequency distribution of tolerant and sensitive varieties (Fig. 5). Further experiments are still needed to confirm the location of qDL5 using backcrossed population or recombinant inbred lines (RILs) or by more number of SSR markers in-between marker loci, barc128 and gwm159 in this region.
QTLs have been identified for related traits at similar positions on chromosome 4B (Xu et al. 2013; Turki et al. 2015; Genc et al. 2010) which confirmed the importance of the loci identified in the present study. In this study qDL4 and qDL5 showed with small additive effect. This finding agreed with Genc et al., (2010) who detected 6 QTLs for leaf symptoms under salt stress with small additive effect containing 4 QTLs with negative additive effect and 2 QTLs with positive effect. The smaller additive effects reflect the dominance of some genes which can appear at different salt levels and might be beneficial for breeding programs aiming at increased salt tolerance.
5 Conclusion
Soil salinization has become a serious worldwide problem restricting wheat development and productivity. Thus, the development of functional markers and the selection of salt-tolerant varieties provides a new way to accelerate the genetic improvement of wheat crop. The present study was conducted with the objective of mapping QTLs conferring salt tolerance in F2:3 populations of durum wheat derived from a cross between Razzek (salt sensitive variety) and Saragolla (salt tolerant variety). Despite the small number of markers used in this study we succeeded in identifying new QTLs, qDL4 on chromosome 4 and qDL5 on chromosome 5 conferring the proportion of dead leaves with major effects. These two QTLs explained 68 % of total phenotypic variation of %DL and are possibly associated with salt tolerance of durum wheat. Our findings provide the primary insights necessary to develop a deep understanding of the complicated salinity defense mechanisms as well as promising genetic resources conferring salt tolerance for durum wheat breeding. These QTLs can further be finely mapped on chromosomes for cloning and used in development of elite germplasm.
Declaration of Competing Interest
The authors declare that they have no known competing financial interests or personal relationships that could have appeared to influence the work reported in this paper.
References
- High-density linkage mapping for agronomic and physiological traits of rice (Oryza sativa L.) under reproductive-stage salt stress. J. Genet.. 2021;100:51.
- [Google Scholar]
- Impact of climate change on agriculture production and its sustainable solutions. Environ. Sustain.. 2019;2:95-96.
- [CrossRef] [Google Scholar]
- Basten, C., Weir, B., Zeng, Z.-B., 2001. QTL Cartographer, version 1.15.
- Novel QTL identification and candidate gene analysis for enhancing salt tolerance in soybean (Glycine max (L.) Merr.) Plant Sci.. 2021;313:111085
- [CrossRef] [Google Scholar]
- Sodium exclusion QTL associated with improved seedling growth in bread wheat under salinity stress. Theor. Appl. Genet.. 2010;121:877-894.
- [CrossRef] [Google Scholar]
- Ghaedrahmati, M., Mardi, M., Naghavi, M.R., Haravan, E.M., Nakhoda, B., Kazemi, M., n.d. Mapping QTLs Associated with Salt Tolerance Related Traits in Seedling Stage of Wheat (Triticum aestivum L.) 16.
- Characterisation of polymorphic microsatellite markers from Aegilops tauschii and transferability to the D-genome of bread wheat. Theor. Appl. Genet.. 2002;104:1164-1172.
- [Google Scholar]
- Salt Stress Induced Changes in Photosynthesis and Metabolic Profiles of One Tolerant (‘Bonica’) and One Sensitive (‘Black Beauty’) Eggplant Cultivars (Solanum melongena L.) Plants. 2022;11:590.
- [CrossRef] [Google Scholar]
- Genome-wide association study of yield and related traits in common wheat under salt-stress conditions. BMC Plant Biol.. 2021;21:27.
- [CrossRef] [Google Scholar]
- Mapping QTLs conferring salt tolerance and micronutrient concentrations at seedling stage in wheat. Sci. Rep.. 2017;7:15662.
- [CrossRef] [Google Scholar]
- Impact of ancestral wheat sodium exclusion genes Nax1 and Nax2 on grain yield of durum wheat on saline soils. Funct. Plant Biol. FPB. 2012;39:609-618.
- [CrossRef] [Google Scholar]
- The estimation of map distances from recombination values. Ann. Eugen.. 1943;12:172-175.
- [CrossRef] [Google Scholar]
- MapDisto: fast and efficient computation of genetic linkage maps. Mol. Breed.. 2012;30:1231-1235.
- [CrossRef] [Google Scholar]
- Mapping of quantitative trait loci for seedling salt tolerance in maize. Mol. Breed.. 2019;39:64.
- [CrossRef] [Google Scholar]
- Microsatellite analysis reveals a progressive widening of the genetic basis in the elite durum wheat germplasm. Theor. Appl. Genet.. 2003;107:783-797.
- [CrossRef] [Google Scholar]
- Identification and development of novel salt-responsive candidate gene based SSRs (cg-SSRs) and MIR gene based SSRs (mir-SSRs) in bread wheat (Triticum aestivum) Sci. Rep.. 2021;11:2210.
- [CrossRef] [Google Scholar]
- Tissue tolerance: an essential but elusive trait for salt-tolerant crops. Funct. Plant Biol.. 2016;43:1103.
- [CrossRef] [Google Scholar]
- Rapid isolation of high molecular weight plant DNA. Nucleic Acids Res.. 1980;8:4321-4326.
- [CrossRef] [Google Scholar]
- Growth and element uptake by salt-sensitive crops under combined NaCl and Cd stresses. Plants. 2021;10:1202.
- [CrossRef] [Google Scholar]
- Microsatellite analysis of Aegilops tauschii germplasm. Theor. Appl. Genet.. 2000;101:100-106.
- [Google Scholar]
- QTLs for seedling traits under salinity stress in hexaploid wheat. Ciênc. Rural. 2018;48
- [CrossRef] [Google Scholar]
- Assessment of agro-physiological traits for salt tolerance in drought-tolerant wheat genotypes. Int. J. Plant Prod.. 2013;7:437-454.
- [Google Scholar]
- Soil salinity: A serious environmental issue and plant growth promoting bacteria as one of the tools for its alleviation. Saudi J. Biol. Sci.. 2015;22:123-131.
- [CrossRef] [Google Scholar]
- Breeding and biotechnological interventions for trait improvement: status and prospects. Planta. 2020;252:54.
- [CrossRef] [Google Scholar]
- Development and mapping of microsatellite (SSR) markers in wheat. Theor. Appl. Genet.. 2005;110:550-560.
- [Google Scholar]
- An update of the Courtot x Chinese Spring intervarietal molecular marker linkage map for the QTL detection of agronomic traits in wheat. Theor. Appl. Genet.. 2003;106:530-538.
- [Google Scholar]
- Detection of QTLs associated with salinity tolerance in durum wheat based on association analysis. Euphytica. 2015;201:29-41.
- [CrossRef] [Google Scholar]
- Changes in chlorophyll, ribulose bisphosphate carboxylase-oxygenase, glycine betaine content, photosynthesis and transpiration in Amaranthus tricolor leaves during salt stress. J. Hortic. Sci. Biotechnol.. 2000;75:623-627.
- [CrossRef] [Google Scholar]
- Mapping QTLs for salt tolerance with additive, epistatic and QTL × treatment interaction effects at seedling stage in wheat. Plant Breed.. 2013;132:276-283.
- [CrossRef] [Google Scholar]
- Genetic mapping of quantitative trait loci in crops. Crop J.. 2017;5:175-184.
- [CrossRef] [Google Scholar]
- Durum wheat breeding in the mediterranean region: current status and future prospects. Agronomy. 2020;10:432.
- [CrossRef] [Google Scholar]
- Genome-wide MNase hypersensitivity assay unveils distinct classes of open chromatin associated with H3K27me3 and DNA methylation in Arabidopsis thaliana. Genome Biol.. 2020;21:24.
- [CrossRef] [Google Scholar]
Appendix A
Supplementary material
Supplementary data to this article can be found online at https://doi.org/10.1016/j.jksus.2022.102506.
Appendix A
Supplementary material
The following are the Supplementary data to this article:


