

Translate this page into:
Feature importance and model performance for prediabetes prediction: A comparative study
⁎Corresponding author. falkhulaifi@iau.edu.sa (Fadwa M Alkhulaifi),
-
Received: ,
Accepted: ,
This article was originally published by Elsevier and was migrated to Scientific Scholar after the change of Publisher.
Abstract
Machine learning models enhance prediabetes prediction using diverse data. Key predictors include cholesterol, BMI, hypertension, age, and income. Random Forest demonstrated the highest accuracy and recall in predictions. Insights support cost-effective, large-scale prediabetes screening solutions. Findings help identify high-risk groups for early intervention and prevention.
Abstract
Objectives
Prediabetes is a significant health condition that elevates the risk of developing type 2 diabetes and other associated complications. This study aims to (1) explore the potential of machine learning models to improve the prediction of prediabetes, (2) compare the performance of various machine learning models with traditional regression methods, and (3) identify the most influential demographic, socioeconomic, and health-related factors associated with prediabetes.
Methods
This study utilized data from the 2021 Behavioral Risk Factor Surveillance System (BRFSS) and employed comprehensive data preprocessing techniques. Logistic regression analysis was conducted to assess correlations between features and prediabetes risk. Feature importance was quantified using Adjusted Mutual Information values. Multiple machine learning models, including Random Forest, K Nearest Neighbors (KNN), Extreme Gradient Boosting (XGBoost), Neural Network, and Logistic Regression, were used for prediction. The best model was selected and validated through cross-validation to ensure robustness.
Results
Significant associations were observed between prediabetes and key predictors such as cholesterol levels, BMI categories, hypertension status, age groups, and income categories. Among the models tested, Random Forest demonstrated the highest accuracy and robustness, outperforming traditional regression models.
Conclusions
This study highlights the potential of machine learning to enhance prediabetes prediction and underscores the importance of identifying high-risk individuals for early intervention. The findings contribute to population health strategies by integrating advanced analytical methods with public health data.
Keywords
Adjusted mutual information
Machine learning models
Multivariate logistic regression
Prediabetes
Risk factors

- AMI
-
Adjusted Mutual Information
- AUC ROC
-
Area under the ROC curve
- BMI
-
Body Mass Index
- CDC
-
Centers for Disease Control and Prevention
- IFG
-
impaired fasting glucose
- IGT
-
impaired glucose tolerance
- KNN
-
K Nearest Neighbors
- XGBoost
-
Extreme Gradient Boosting
Abbreviations
1 Introduction
Diabetes mellitus (DM) is a chronic metabolic disorder characterized by persistent hyperglycemia and disruptions in carbohydrate, fat, and protein metabolism. It arises due to insufficient insulin secretion, impaired insulin action (insulin resistance), or a combination of both (Singh et al., 2022). A precursor to DM, prediabetes, is a critical health condition marked by elevated blood glucose levels that fall short of meeting the diagnostic criteria for type 2 diabetes (CDC, 2022). Prediabetes is typically diagnosed based on impaired fasting glucose (IFG) levels ranging from 5.7 to 6.3 mmol/L, impaired glucose tolerance (IGT) levels between 7.8 and 11.0 mmol/L, or glycated hemoglobin (HbA1c) levels of 6.4 % to 6.9 % (Barr et al., 2007; Echouffo-Tcheugui et al., 2023). Prediabetes affects approximately 96 million American adults, significantly increasing their risk of developing diabetes, cardiovascular disease, kidney disease, and other associated complications (Schlesinger et al., 2022; Zheng et al., 2018). Globally, an estimated 7.5 % of the population was diagnosed with prediabetes in 2019, a figure projected to rise to 8.0 % by 2030 (Saeedi et al., 2019). The asymptomatic nature of prediabetes often leads to low patient awareness and detection rates, exacerbating poor adherence to treatment.
Evidence suggests that early detection and intervention in prediabetes can substantially reduce the progression to type 2 diabetes. Identifying individuals with prediabetes early facilitates the implementation of preventive measures, such as lifestyle modifications and pharmacotherapy, to delay or prevent the onset of diabetes (Thipsawat, 2023; Tabák et al., 2012). However, current screening methods for prediabetes are often invasive, time-consuming, and costly, limiting their feasibility for large-scale application, particularly among low-income populations.
Machine learning models present a promising and efficient approach for prediabetes screening. By training these models on large-scale population data, they can accurately identify individuals at high risk of developing prediabetes. These models utilize diverse demographic, socioeconomic, and health-related variables to predict prediabetes risk, thereby facilitating targeted screening and early intervention strategies. Numerous studies have successfully developed machine learning models for prediabetes prediction, incorporating a wide range of features, including age, gender, body mass index (BMI), blood pressure, dietary habits, physical activity, family history, laboratory findings, and socioeconomic factors such as income, education, and marital status (Abbas et al., 2021; Li et al., 2021; Rajput et al., 2019; Štiglic et al., 2018; Walker et al., 2016; Wang et al., 2020; Wang et al., 2021). Various algorithms can be employed for predicting prediabetes using a diverse set of features. Logistic regression estimates the likelihood of prediabetes by modeling it as a linear combination of predictors (Kleinbaum et al., 2002). Support vector machines delineate the hyperplane that optimally separates individuals with low risk from those at high risk (Cortes and Vapnik, 1995). Neural networks are capable of capturing complex nonlinear interactions between variables through the use of hidden layers and weight optimization (LeCun et al., 2015). Ensemble methods, such as random forests, enhance generalizability by aggregating the outputs of multiple decision trees, each trained on different subsets of features and samples (Breiman, 2001).
The aim of this study is to develop a machine learning model leveraging extensive data from the Centers for Disease Control and Prevention (CDC) to predict prediabetes. Advanced methodologies, including adjusted feature importance analysis and multivariate logistic regression, were employed to identify the most significant factors associated with prediabetes prediction.
2 Materials and methods
2.1 Data source
This study utilized secondary open-source data from the 2021 Behavioral Risk Factor Surveillance System (BRFSS), managed by the U.S. Centers for Disease Control and Prevention (CDC, 2022). It is publicly accessible under the CC0 1.0 Universal (CC0 1.0) Public Domain Dedication license. Consequently, ethical approval or informed consent was not necessary.
2.2 Data Collection preprocessing
Data preprocessing encompassed tasks such as data cleansing, feature selection, and feature engineering using the Python programming language within the Google Colab environment. We addressed missing values and selected relevant attributes. Feature engineering involved both combining existing features and creating new ones. The original dataset contained 438,693 records, but after excluding individuals with diabetes, we were left with 381,077 entries for predicting prediabetes. We derived the 'Prediabetes' variable by removing rows corresponding to individuals with diabetes from the 'Diabetes status' variable. The remaining groups were categorized as either 'no prediabetes' or 'prediabetes.' For predicting prediabetes, we utilized several categorical variables, including gender, age group, marital status, BMI category, cholesterol status, hypertension status, physical activity, income category, and education level, Table 1. BMI: Body Mass Index; PreDiabetes: Defined based on fasting glucose (5.7–6.3 mmol/L), glucose tolerance (7.8–11.0 mmol/L), or HbA1c levels (6.4–6.9 %).
Variable
Definition
PreDiabetes
PreDiabetes: 0 (Not Pre-Diabetic), 1 (Prediabetic)
Gender
Gender: 0 (Female), 1 (Male)
Age Group
Age group: 13-level category (1: 18–24 y, 2: 25–29 y, 3: 30–34 y, 4: 35–39 y, 5: 40–44 y, 6: 45–49 y, 7: 50–54 y, 8: 55–59 y, 9: 60–64 y, 10: 65–69 y, 11: 70–74 y, 12: 75–79 y, 13: 80 y or above)
Marital Status
Marital Status: 0 (not Married), 1 (Married)
BMI Category
Body Mass Index: 1: Underweight (BMI < 18.5 Kg/m2), 2: Normal weight (BMI 18.5–24.9 Kg/m2), 3: Overweight (BMI 25–––29.9 Kg/m2), 4: Obese (BMI ≥ 30 Kg/m2)
Cholesterol Status
High Cholesterol: 0 (No High Cholesterol), 1 (High Cholesterol)
Hypertension Status
Hypertension: 0 (No Hypertension), 1 (Hypertension)
Physical Activity
Engage in Regular Physical Activity: 0 (No), 1 (Yes)
Income Category
Income: 1 − $15,000 to < $25,000, 2 − $25,000 to < $35,000, 3 − $35,000 to < $50,000, 4 − $50,000 to < $100,000, 5 − $100,000 to < $200,000, 6 − $200,000 or more
Education Level
1 − Did not graduate High School, 2 − Graduated High School,
3 − Attended College or Technical School, 4 − Graduated from College or Technical School
2.3 Descriptive analysis
Descriptive analysis was employed to summarize the categorical variables and their respective groups in the dataset. The percentage distribution of groups within each variable was calculated to gain a comprehensive understanding of the dataset's composition.
2.4 Multiple regression analysis
A logistic regression analysis was conducted to assess the relationship between 'gender,' 'age group,' 'marital status,' 'BMI category,' 'cholesterol status,' 'hypertension status,' 'physical activity,' 'income category,' 'education level,' and the target variable 'PreDiabetes.' The analysis involved calculating both correlation coefficients and odds ratios (ORs) to measure the strength of the associations. To evaluate the precision of the estimates, 95 % confidence intervals (CIs) were utilized. The statistical significance of the associations was determined by obtaining p-values, with values below 0.05 considered statistically significant.
2.5 Feature importance
The significance of features in predicting the target variable 'PreDiabetes' was evaluated using the Adjusted Mutual Information (AMI) method. AMI quantifies the mutual information between two variables while accounting for chance agreement, ensuring that feature rankings are not influenced by redundancy or irrelevant correlations. Unlike standard mutual information, AMI eliminates shared information among features, enhancing its effectiveness in feature evaluation. This robust methodology was selected for its ability to provide accurate and reliable rankings of feature importance in predicting prediabetes (Newman et al., 2020).
2.6 Model selection and evaluation
Multiple machine learning models were employed to predict PreDiabetes, and their performance was assessed using metrics such as accuracy, the area under the ROC curve (AUC ROC), precision, recall, and F1 score. The best model was retrained and evaluated using cross-validation to ensure robustness. Given the class imbalance issue, different models, along with the Synthetic Minority Over-sampling Technique (SMOTE), were utilized to address this challenge. The models encompassed various techniques, including Random Forest, K Nearest Neighbors (KNN), Extreme Gradient Boosting (XGBoost), Neural Network, and Logistic Regression. SMOTE proved to be a valuable approach for mitigating imbalanced data, as it generates synthetic minority class samples while preserving information and reducing overfitting. To rigorously validate the results of the best-performing model, we employed a cross-validation approach with 5 folds.
3 Results
3.1 Descriptive analysis
The study provides a detailed analysis of demographic and health-related characteristics within the studied population, offering valuable insights into factors influencing population health dynamics. The gender distribution is relatively balanced, with 53.9 % identifying as female and 46.1 % as male. The sample also demonstrates diverse age composition, with individuals aged 65–69 years comprising the largest age group, representing 9.7 % of the population. Age groups 9 (60–64 years) and 11 (70–74 years) closely follow, accounting for 9.6 % and 8.8 %, respectively, highlighting the heterogeneity of age groups in the population. The distribution of marital status is relatively even, with 52.1 % of the population identified as married and 47.9 % as unmarried individuals. Educational attainment in the population is diverse, with the majority (42.5 %) having graduated from college or technical school. This is followed by those who attended college or technical school (27.1 %) and those who graduated high school (24.9 %). Income distribution in the population shows significant diversity, with category 5 representing the highest income group at 28.5 %, followed closely by category 9 at 25.1 %. The results reveal that the majority of the population (54.7 %) is overweight or obese, with a notable 2 % being underweight. A significant proportion of the population (77.9 %) does not engage in regular physical activity, while 22.1 % do. Approximately 64.0 % of the population has normal cholesterol levels, while 36.0 % have elevated cholesterol levels. Regarding hypertension, around two-thirds of the population (65.7 %) do not have hypertension, while 34.3 % have hypertension. The majority of the population (97.4 %) does not have prediabetes, with only 2.6 % having been diagnosed with prediabetes. However, in the original dataset, 57,616 individuals have diabetes, accounting for approximately 13.6 % of the total population, while 366,342 individuals have neither diabetes nor prediabetes.
3.2 Logistic regression analysis
In this comprehensive analysis, we identified significant correlations between all the features and pre-diabetes. Starting with cholesterol levels (cholesterol status), individuals with elevated levels had a 73 % higher likelihood of developing prediabetes compared to their counterparts with lower cholesterol levels. This means that their risk of experiencing prediabetes was nearly three quarters greater. Furthermore, individuals placed in higher BMI categories (BMI category) exhibited a 41 % elevated risk of prediabetes when compared to those in lower BMI categories. This 41 % increase underscores the importance of BMI as a predictor of prediabetes risk. Moreover, individuals diagnosed with hypertension (hypertension status) showed a 28 % higher likelihood of having prediabetes when contrasted with those without hypertension. This finding highlights the relationship between hypertension and an increased risk of prediabetes. As age advanced within the specified age groups (age group), the odds of prediabetes increased by a factor of 1.06, emphasizing the progressive nature of age-related risk. Turning to education levels (education level), individuals with higher educational attainment exhibited a 17.8 % lower risk of prediabetes compared to those with lower educational backgrounds. This reduction in risk aligns with the protective effect of higher education. Similarly, individuals in higher income categories (income category) showed a 19 % lower likelihood of prediabetes in contrast to their counterparts in lower income categories. This 19 % decrease underscores the role of income as a protective factor against prediabetes. Additionally, a strong positive correlation emerged between physical activity levels (physical activity) and pre-diabetes risk. Individuals engaging in higher levels of physical activity had a 20 % lower risk of prediabetes compared to those with lower physical activity levels. Lastly, marital status (marital status = 1), particularly being married, was associated with a 21 % lower likelihood of prediabetes compared to individuals who were not married. This reduction in risk highlights the potential influence of marital status on prediabetes risk. Notably, males (gender = 1) exhibited a 40 % lower risk of prediabetes compared to females, underscoring gender differences in prediabetes susceptibility. The statistical analysis demonstrated statistically significant associations between 'PreDiabetes' and all the considered features, Table 2.
Feature
Coefficient
95 % CI
OR
95 % CI
p-value
Hypertension status
0.55
[0.539, 0.564]
1.74
[1.719, 1.808]
< 0.05
BMI category
0.25
[0.239, 0.265]
1.41
[1.271, 1.309]
< 0.05
Income category
0.34
[0.336, 0.350]
1.29
[1.399, 1.421]
< 0.05
Age group
−0.21
[-0.217, −0.208]
1.06
[0.804, 0.816]
< 0.05
Education level
0.05
[0.053, 0.057]
0.82
[1.052, 1.058]
< 0.05
Marital status
−0.20
[-0.206, −0.193]
0.81
[0.814, 0.826]
< 0.05
Physical activity
−0.24
[-0.251, −0.224]
0.80
[0.779, 0.801]
< 0.05
Hypertension Status
−0.23
[-0.242, −0.214]
0.79
[0.788, 0.812]
< 0.05
Gender
−0.52
[-0.528, −0.505]
0.60
[0.591, 0.619]
< 0.05
3.3 Features importance
In the analysis of the association between various features and the target variable “PreDiabetes,” five features emerged as the most influential in predicting the occurrence of PreDiabetes. These features, ranked in descending order of importance based on their AMI values, cholesterol status, hypertension status, BMI category, income category, and age group. Cholesterol status demonstrated the highest importance, with approximately 4.03 % higher importance than hypertension status. Moreover, when comparing cholesterol status to BMI category, the third-ranked feature, it displayed a substantial importance that was around 1.5 times higher (141.55 %). Similarly, in comparison to income category and age group, cholesterol status exhibited approximately 2.7 times (272.30 %) and 3.1 times (310.00 %) higher importance, respectively. These findings underscore the significance of cholesterol status as the most influential feature in predicting PreDiabetes compared to the other top-ranking features. Hypertension status, the second-ranked feature, displayed notable importance compared to BMI category, the subsequent feature in the ranking, with a significance approximately 1.4 times higher (136.27 %). Similarly, when compared to income category and age group, hypertension status demonstrated an approximately 2.6 times (261.49 %) and 3 times (297.69 %) higher importance, respectively. BMI category, the third-ranked feature, displayed significance approximately 1.9 times (191.89 %) higher than income category and roughly 2.2 times (218.46 %) higher than age group. The income category is the fourth-ranked feature. When compared to age group, the subsequent feature in the ranking, it displayed an importance approximately 1.1 times (113.85 %) higher. Age group, the fifth-ranked feature, exhibited an importance approximately 1.5 times (146.07 %) higher than education level, which did not make it to the top five in terms of importance. Other features had lower importance compared to the top five features, Fig. 1.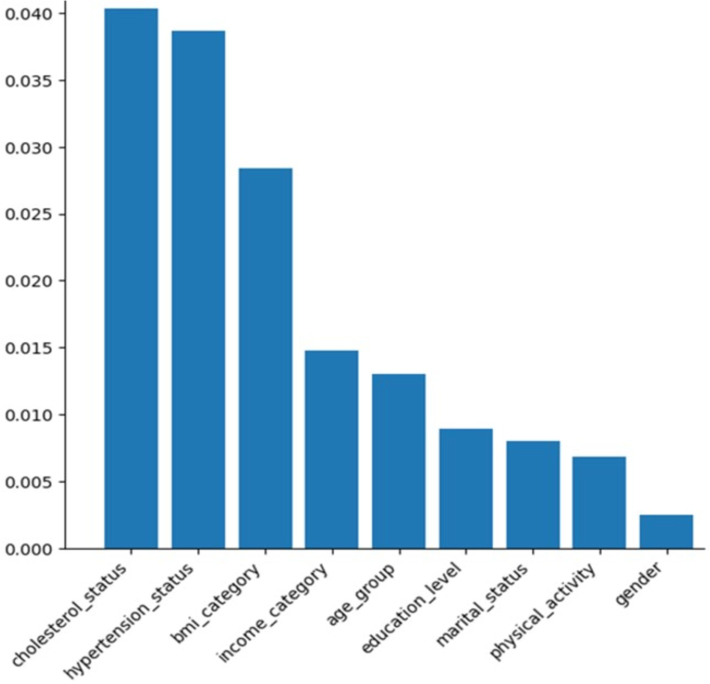
Feature importance using Adjusted Mutual Information.
3.4 Models’ performance
In our evaluation of machine learning models for PreDiabetes prediction, Random Forest demonstrated impressive performance with an accuracy of 0.81, precision of 0.77, recall of 0.87, F1 score of 0.82, and AUC ROC of 0.81, Table 3. These metrics collectively indicate the model's proficiency in achieving a high level of accuracy and its strong ability to correctly identify true positive cases, which is pivotal in prediabetes prediction. However, it is noteworthy that there is a slightly higher rate of false positives, as indicated by the lower precision. KNN also delivered robust performance, boasting an accuracy of 0.77, precision of 0.75, recall of 0.83, F1 score of 0.78, and AUC ROC of 0.77. This model effectively balances accuracy and recall, showcasing its capability to correctly identify prediabetes cases. Like Random Forest, it exhibits a slightly elevated rate of false positives compared to true positives. XGBoost yielded respectable results with an accuracy of 0.71, precision of 0.70, recall of 0.75, F1 score of 0.72, and AUC ROC of 0.71. These findings suggest that the XGBoost model performs reasonably well in prediabetes prediction, maintaining a balance between precision and recall, which indicates its competence in correctly classifying both true positive and true negative cases with commendable accuracy. The Neural Network model achieved an accuracy of 0.68, precision of 0.67, recall of 0.72, F1 score of 0.70, and AUC ROC of 0.68. While its performance closely aligns with that of XGBoost, it exhibits slightly lower accuracy, precision, and recall. Nevertheless, it demonstrates a notable capacity for prediabetes prediction, albeit with the potential for further fine-tuning to enhance its efficacy. Lastly, Logistic Regression displayed more modest performance, reporting an accuracy of 0.66, precision of 0.66, recall of 0.67, F1 score of 0.67, and AUC ROC of 0.66. While achieving moderate accuracy, precision, and recall, it lags behind the other models in terms of overall predictive capability for prediabetes.
Model
Accuracy
Precision
Recall
F1 Score
AUC ROC
Random Forest
0.81
0.77
0.87
0.82
0.81
KNN
0.77
0.75
0.83
0.78
0.77
XGBoost
0.71
0.70
0.75
0.72
0.71
Neural Network
0.68
0.67
0.72
0.70
0.68
Logistic Regression
0.66
0.66
0.67
0.67
0.66
3.5 Validating model performance
To rigorously validate the results of the best-performing model, Rom Forest, we employed a cross-validation approach with a fold count of 5. Cross validation is a fundamental technique in the evaluation of machine learning models, designed to assess the robustness and generalizability of the model's performance. In this process, the dataset is divided into multiple subsets, or “folds,” where the model is iteratively trained on one portion of the data and tested on the remaining part. This enables us to gauge how effectively the model performs across different data samples and helps mitigate the risk of overfitting, where a model may excel on the training data but perform poorly on unseen data. The results obtained after cross validation were consistent with the initial findings, reaffirming the model's predictive capabilities and the reliability of the reported performance metrics. This rigorous validation process enhances our confidence in the effectiveness of the chosen machine learning models for prediabetes prediction.
4 Discussion
The descriptive analysis of the study population provides valuable insights into the distribution of key demographic and health-related characteristics in the sample. The relatively equal gender distribution enables an unbiased assessment of prediabetes risk factors across males and females. The heterogeneity across age groups suggests that the data sufficiently captures prediabetes risk across the adult age spectrum, allowing for age-stratified analysis. The fact that married and unmarried people are represented in the data in roughly equal proportions means that we can be confident that the results of the study are not biased toward either group. The educational diversity of the sample population is a strength, as it enables quantifying differential prediabetes susceptibility across education levels, which is a known socioeconomic determinant (Walker et al., 2014). The income variation also permits elucidating income-related prediabetes disparities. A substantial proportion of overweight and obese individuals is expected, given the rising obesity prevalence (Hales et al., 2020). The high rate of physical inactivity aligns with literature indicating that around 43 % of adults are physically inactive (Silveira et al., 2022). The sizable subgroup with hypertension mirrors nearly half of U.S. adults with hypertension (Virani et al., 2021) and enables quantification of its prediabetes association. The elevated cholesterol percentage conforms to research estimating a prevalence of around 36 % (Fryar et al., 2012). The relatively low rate of prediabetes is consistent with the latest global study of prevalence that ranges from 3 % to 13 % (Rooney et al., 2023).
The logistic regression analysis yielded valuable insights into the impact of key demographic, clinical, and socioeconomic factors on prediabetes odds. In line with previous findings, dyslipidemia characterized by elevated cholesterol emerged as the most influential risk factor, increasing the likelihood of prediabetes by 73 % (Bianchi et al., 2008). This underscores the importance of cholesterol screening for prediabetes risk assessment. Higher BMI categories also substantially elevated the odds, emphasizing the well-established dose–response relationship between excess adiposity and prediabetes (Kahn et al., 2005). Hypertension was associated with a 28 % increase in prediabetes odds, consistent with its connections to insulin resistance and metabolic dysfunction (Berbari et al., 2023). Advancing age significantly heightened the odds of prediabetes, reflecting the rising prevalence observed nationally among middle-aged individuals (CDC, 2022). Higher levels of education and income conferred protective effects, reducing the odds by 17.8 % and 19 %, respectively. These reductions likely stem from healthier behaviors and increased access to healthcare among higher socioeconomic groups (Walker et al., 2016). Greater physical activity and being married were also linked to a lower likelihood of prediabetes, suggesting the influence of social and lifestyle factors in mitigating risk. Notably, males had a 40 % reduction in odds compared to females. While premenopausal women are relatively protected from diabetes, males experience higher rates of impaired fasting glucose, contributing to their prediabetes risk (Kautzky-Willer et al., 2016). The higher prediabetes odds among females warrant further investigation into gender-specific trajectories. In summary, the analysis quantitatively demonstrated significant associations between prediabetes and a range of clinical and demographic factors.
The feature importance analysis using AMI scores provided critical insights into the relative predictive capacity of different demographic, clinical, and socioeconomic factors for prediabetes. In alignment with the logistic regression findings, elevated cholesterol was identified as the most influential prediabetes predictor, with importance scores exceeding all other features. This reinforces the value of dyslipidemia screening and monitoring for prediabetes risk assessment (Bianchi et al., 2008). Hypertension ranked second, again validating its significant contribution to risk, likely via mechanisms involving inflammation and insulin signaling dysfunction (Berbari et al., 2023). Higher BMI and older age categories also ranked highly, reflecting the well-established dose–response relationship between excess weight, advancing age, and prediabetes odds (Kahn et al., 2006; CDC, 2022). Lower income status emerged as the fourth most significant feature. This aligns with the socioeconomic prediabetes disparities seen nationally and the heightened susceptibility among disadvantaged groups (Walker et al., 2016).
The comparative feature importance scores provide a quantitative basis for emphasizing medical risks like dyslipidemia and hypertension over demographic factors in prediabetes screening frameworks. However, demographic features may serve as crucial indicators for targeted screening of high-risk subgroups that may have less frequent healthcare contact. For example, lower income groups could be proactively assessed given income category’s relatively high importance compared to education level. Machine learning models leveraging both clinical and sociodemographic inputs could balance sensitivity and precision to optimize predictive performance and cost-effectiveness. Overall, the feature importance analysis provides a quantitative basis for prioritizing medical and demographic screening indicators to enhance prediabetes prediction and early detection efforts.
The present study demonstrates the potential of machine learning algorithms in leveraging key demographic, clinical, and health-related data to predict prediabetes risk. Among the models tested, Random Forest emerged as the top performer, achieving high accuracy and strong discrimination with an AUC ROC exceeding 0.80. The high recall rates of this model highlight its effectiveness in correctly identifying individuals with prediabetes. The robust performance of ensemble tree-based methods like Random Forest for medical prediction has been noted previously (Christodoulou et al., 2019). Random Forest mitigates overfitting risks by aggregating outputs from diverse decision trees trained on subsets of data. KNN also generalizes well by basing predictions on similarity to multiple neighboring points. We identified elevated cholesterol, hypertension, higher BMI, lower income, and older age as the most influential prediabetes predictors. These findings corroborate established evidence on the significance of clinical and sociodemographic risk factors. Dyslipidemia marked by high cholesterol often arises before diabetes onset and indicates insulin resistance (Bianchi et al., 2008). Hypertension is also closely linked to prediabetes through overlapping pathophysiology related to insulin signaling, inflammation, and oxidative stress (Berbari et al., 2023; Usui, 2023). The dose–response relationship between excess weight and prediabetes risk is well-documented, with a 5-fold higher risk above BMI 30 kg/m2 compared to below 25 kg/m2 (Kahn et al., 2006). Lower socioeconomic status marked by income strongly predicts diabetes incidence, likely mediated through poor diet, inactivity, and limited healthcare access (Walker et al., 2016). Prevalence escalates with advancing age, peaking at 45–64 years (CDC, 2022). Our study provides quantitative validation of the relative importance of these known risk factors.
Machine learning models offer distinct advantages over traditional regression when predicting complex multifactorial conditions like prediabetes. While logistic regression evaluates the independent effects of single features, our machine learning approaches capture interactions among risk factors. For example, excesses in BMI and cholesterol likely confer a greater risk when considered together rather than individually. Machine learning models can automatically identify nonlinear relationships, such as the exponential growth of prediabetes with age, which are challenging to specify in advance using regression models. However, a trade-off of machine learning is that the models' decisions are less interpretable than the intuitive outputs of regression models, such as odds ratios from logistic regression. Therefore, in our study, we incorporated logistic regression analysis to provide crucial insights into the effects of key demographic, clinical, and socioeconomic factors on prediabetes odds. Additionally, we included feature importance analysis using AMI scores to gain critical insights into the relative predictive capacity of different demographic, clinical, and socioeconomic factors for prediabetes. To the best of our knowledge, this is the first study to combine these features to predict prediabetes and the first to use multivariate logistic regression in conjunction with AMI to identify the most significant risk factors for prediabetes, in comparison to previous studies (Fujiati et al., 2017; Koopman et al., 2008; Liu et al., 2011; Ouyang et al., 2016; Soo et al., 2017; Wang et al., 2015).
Our study presents several limitations, providing opportunities for future improvement. The models were developed using a single dataset, necessitating further external validation on diverse populations. The BRFSS data relied on self-reports, potentially introducing recall biases. Integrating objective clinical data could enhance prediction accuracy. Additionally, our models were cross-sectional, but incorporating longitudinal data would allow for an assessment of prediabetes trajectories.
5 Conclusion
This study provides valuable insights into prediabetes risk factors through a comprehensive analysis of the study population's demographics, socioeconomic and health-related characteristics. Further optimization in diverse populations over time is warranted to translate these tools towards targeted prevention efforts combating the prediabetes epidemic.
CRediT authorship contribution statement
Saeed Awad M Alqahtani: Writing – original draft, Validation, Software, Resources, Methodology, Investigation, Formal analysis, Data curation. Hussah M Alobaid: Writing – review & editing. Jamilah Alshammari: Writing – review & editing. Safa A Alqarzae: Writing – review & editing. Sheka Yagub Aloyouni: Writing – review & editing, Funding acquisition. Ahood A. Al-Eidan: Writing – review & editing. Salwa Alhamad: Writing – review & editing. Abeer Almiman: Writing – review & editing. Fadwa M Alkhulaifi: Writing – review & editing. Suliman Alomar: .
Funding
This project was supported by the Researchers Supporting Project number (RSP-2024/35), King Saud University, Riyadh, Saudi Arabia, and by Princess Nourah bint Abdulrahman University Researchers Supporting Project number (PNURSP2024R713), Princess Nourah bint Abdulrahman University, Riyadh, Saudi Arabia.
Declaration of competing interest
The authors declare that they have no known competing financial interests or personal relationships that could have appeared to influence the work reported in this paper.
References
- Simple risk score to screen for prediabetes: A cross‐sectional study from the Qatar Biobank cohort. Journal of Diabetes Investigation. 2021;12(6):988-997.
- [Google Scholar]
- Risk of cardiovascular all-cause mortality in individuals with diabetes mellitus, impaired fasting glucose, impaired glucose tolerance: the Australian Diabetes, Obesity, Lifestyle Study (AusDiab) Circulation. 2007;116(2):151-157.
- [Google Scholar]
- Coexistence of Diabetes Mellitus Hypertension. In: Blood Pressure Disorders in Diabetes Mellitus. Cham: Springer International Publishing; 2023. p. :3-17.
- [Google Scholar]
- Elevated 1-hour postload plasma glucose levels identify subjects with normal glucose tolerance but impaired β-cell function, insulin resistance, worse cardiovascular risk profile: the GENFIEV study. J. Clin. Endocrinol. Metab.. 2013;98(5):2100-2105.
- [Google Scholar]
- Random Forests. Machine Learning. 2001;45:5-32.
- A systematic review shows no performance benefit of machine learning over logistic regression for clinical prediction models. J. Clin. Epidemiol.. 2019;110:12-22.
- [Google Scholar]
- Support-Vector Networks. Machine Learning. 1995;20:273-297.
- Prevalence of overweight, obesity, extreme obesity among adults: United States, trends 1960–1962 through 2009–2010. Hyattsville, MD: National Center for Health Statistics; 2012.
- Development validation of prediabetes risk score for predicting prediabetes among Indonesian adults in primary care: Cross-sectional diagnostic study. Interventional Medicine Applied Science. 2017;9(2):76-85.
- [Google Scholar]
- Hales, C. M., Carroll, M. D., and Ogden, C. L., 2020. Prevalence of obesity severe obesity among adults: United States, 2017–2018.
- The metabolic syndrome: time for a critical appraisal: joint statement from the American Diabetes Association the European Association for the Study of Diabetes. Diabetes Care. 2005;28(9):2289-2304.
- [Google Scholar]
- Simple risk score to screen for prediabetes: A cross‐sectional study from the Qatar Biobank cohort. Journal of Diabetes Investigation. 2021;12(6):988-997.
- [Google Scholar]
- Sex gender differences in risk, pathophysiology complications of type 2 diabetes mellitus. Endocr. Rev.. 2016;37(3):278-316.
- [Google Scholar]
- Logistic Regression: a Self-Learning Text. Vol Vol. 94. New York: springer; 2002.
- Tool to assess likelihood of fasting glucose impairment (TAG-IT) The Annals of Family Medicine. 2008;6(6):555-561.
- [Google Scholar]
- Deep Learning. Nature. 2015;521(7553):436-444.
- A tongue features fusion approach to predicting prediabetes diabetes with machine learning. J. Biomed. Inform.. 2021;115:103693
- [Google Scholar]
- A Chinese diabetes risk score for screening of undiagnosed diabetes abnormal glucose tolerance. Diabetes Technol. Ther.. 2011;13(5):501-507.
- [Google Scholar]
- Improved mutual information measure for clustering, classification, and community detection. Phys. Rev. E. 2020;101(4):042304
- [Google Scholar]
- A simple score model to assess prediabetes risk status based on the medical examination data. Can. J. Diabetes. 2016;40(5):419-423.
- [Google Scholar]
- Prediabetes Risk Evaluation Scoring System [PRESS]: A simplified scoring system for detecting undiagnosed Prediabetes. Prim. Care Diabetes. 2019;13(1):11-15.
- [Google Scholar]
- Global and regional diabetes prevalence estimates for 2019 and projections for 2030 and 2045: Results from the International Diabetes Federation Diabetes Atlas. Diabetes Res. Clin. Pract.. 2019;157:107843
- [Google Scholar]
- Prediabetes risk of mortality, diabetes-related complications comorbidities: umbrella review of meta-analyses of prospective studies. Diabetologia. 2022;65(2):275-285.
- [CrossRef] [Google Scholar]
- Sedentary behavior, physical inactivity, abdominal obesity in adults older adults: A systematic review meta-analysis. Clinical Nutrition ESPEN. 2022;50:63-73.
- [Google Scholar]
- Animal models of diabetic microvascular complications: Relevance to clinical features. Biomed. Pharmacother.. 2022;145:112305
- [Google Scholar]
- Derivation validation of the prediabetes self-assessment screening score after acute pancreatitis (PERSEUS) Digestive Liver Disease. 2017;49(10):1146-1154.
- [Google Scholar]
- Development of a screening tool using electronic health records for undiagnosed Type 2 diabetes mellitus and impaired fasting glucose detection in the Slovenian population. Diabet. Med.. 2018;35(5):640-649.
- [Google Scholar]
- Prediabetes: a high-risk state for diabetes development. Lancet. 2012;379(9833):2279-2290.
- [Google Scholar]
- Intervention for Prevention of Type 2 Diabetes Mellitus Among Prediabetes: A Review of the Literature. SAGE Open Nursing. 2023;9:23779608231175581
- [CrossRef] [Google Scholar]
- Common metabolic features of hypertension type 2 diabetes. Hypertens. Res.. 2023;46(5):1227-1233.
- [Google Scholar]
- Heart disease and stroke statistics-2021 update: a report from the American Heart Association. Circulation. 2021;143(8):p.CIR0000000000000950
- [Google Scholar]
- Relationship between social determinants of health processes outcomes in adults with type 2 diabetes: validation of a conceptual framework. BMC Endocr. Disord.. 2014;14:1-10.
- [Google Scholar]
- Influence of race, ethnicity and social determinants of health on diabetes outcomes. Am. J. Med. Sci.. 2016;351(4):366-373.
- [Google Scholar]
- A simple risk score for identifying individuals with impaired fasting glucose in the Southern Chinese population. International Journal of Environmental Research Public Health. 2015;12(2):1237-1252.
- [Google Scholar]
- IGRNet: a deep learning model for non-invasive, real-time diagnosis of prediabetes through electrocardiograms. Sensors. 2020;20(9):2556.
- [Google Scholar]
- Prediction model for the onset risk of impaired fasting glucose: a 10-year longitudinal retrospective cohort health check-up study. BMC Endocr. Disord.. 2021;21:1-9.
- [Google Scholar]
- Global aetiology and epidemiology of type 2 diabetes mellitus and its complications. Nat. Rev. Endocrinol.. 2018;14(2):88-98.
- [Google Scholar]
Appendix A
Supplementary data
Supplementary data to this article can be found online at https://doi.org/10.1016/j.jksus.2024.103583.
Appendix A
Supplementary data
The following are the Supplementary data to this article:


