

Translate this page into:
Characterization of tin oxide nanoparticles synthesized by discharging the non-thermal plasma jet in liquid and their application as an antibacterial agent
⁎Corresponding author. ayhamomar07@gmail.com (Omar O. Abdulhadi)
-
Received: ,
Accepted: ,
This article was originally published by Elsevier and was migrated to Scientific Scholar after the change of Publisher.
Abstract
This study reports the synthesis of tin oxide nanoparticles using a non-thermal plasma jet technique. Spectroscopic analysis (OES) of plasma was carried out at atmospheric pressure to measure the plasma parameters used in the synthesis of nanoparticles. SnO2 NPs were synthesized at different durations (3 and 5 min) using a DC-high-voltage power source with a voltage of 13 kV.
X-ray diffraction (XRD) showed that SnO2 NPs, prepared in 3 min, are rutile tetragonal polycrystalline and have an average crystallite size of 12.45 nm. Field emission scanning electron (FE-SEM) images also show that the nanoparticles are spherical and homogenous, with an average nanostructure diameter of 22 to 58 nm for both (3 and 5 min) preparation times. UV–Vis spectroscopy showed peaks of surface plasmon resonance around 255–260 nm. The ICP-mass technique was used to evaluate nanoparticle concentrations, which were between 90–100 μg/ml. Zeta potential (ZP) measurements revealed that the particles are relatively stable colloids. The study shows that synthesized nanoparticles have exceptional antibacterial efficacy against Escherichia coli and Staphylococcus aureus bacteria. These nanoparticles are low-cost, scalable, and can be synthesized using gas or liquid phases, enabling the synthesis of a wide range of nanoparticles suitable for various pathogenic bacterial types.
Keywords
Tin oxide nanoparticles
Non-thermal plasma jet
Plasma diagnosis
Antibacterial agent

1 Introduction
The high prevalence of infectious diseases and the increasing drug resistance of pathogenic microorganisms are highly concerning. Although there has been a lot of progress in understanding microbial causes and using advanced therapy, the morbidity and death rates related to microbial infections continue to be high (Kolář et al., 2001). New antimicrobial agents are critical for controlling microbial diseases; hence, inorganic disinfectants, including metal oxide nanoparticles, are very interesting.
Over the past decade, remarkable developments have been made in synthesizing nanoparticles made from metal oxides, which are crucial in various fields of science (Fernández-García et al., 2004). Many techniques that have been used for synthesizing nanomaterials. The previously approved techniques have some drawbacks, including the high cost of reactive materials and their effects on public health. The synthesis of nanomaterials for biomedical applications necessitates alternative methods that do not involve toxic chemicals. Conventional methods require toxic reducing or oxidant agents to synthesis stable nanoparticles, making alternative synthesis crucial for the development of nanotechnology. Therefore, we should develop a mechanism to overcome these challenges and advance research on colloidal nanoparticles. Non-thermal liquid plasma systems have recently seen increased interest due to their important properties in antimicrobial, sterilization, biomedical, and other future applications, including nanotechnology and environmental remediation (Rezaei et al., 2019).
Metal oxide nanoparticles have high inhibitory activity against many types of pathogenic bacteria, and their activity in inhibiting bacteria is influenced by factors, the most important of which are particle size, type of liquid, and electrostatic interactions between the nanoparticles and bacteria. These interactions affect the bacterial cell membrane's function, synthesizing of toxic free radicals that cause oxidative stress in the bacteria (John et al., 2018). This study aims to synthesize and characterize SnO2 NPs using non-thermal plasma, which is a fast, simple, and cost-effective technique to test SnO2 NPs' antibacterial capabilities against Staphylococcus aureus and E. coli.
2 Experimental part
2.1 Plasma generation mechanism and synthesis of tin oxide nanoparticles
The current investigation synthesized tin oxide nanoparticles using a non-thermal plasma system over water. Water was the liquid used in this study due to its large heat capacity, which functioned as an electrode and maintained the plasma at a relatively low temperature.
The cathodic plasma design that was used in our study involves placing the cathode above the water surface and the anode immersed in the water. SnO2 NPs were synthesized by argon gas. The thermal conductivity of the inert gas argon is relatively low, which reduces the possibility of the electrode overheating and reduces its oxidation.
Applying an electrical voltage between the electrodes creates a stable discharge plasma at atmospheric pressure between the cathode and the water surface (the anode). This causes the gas to breakdown at the interface. The interface region is of great importance because it is the area of interactions where nanoparticles are synthesized. The cathode emits energetic electrons in the interface region, which can excite and ionize particles in this area. A significant number of secondary electrons and positive ions are generated in the interface region. When water was used as an anode, the interface voltage remained constant, and secondary electrons were transferred from the plasma to the water. Water dissolved the secondary electrons, transforming them into hydrated electrons ( ). The positive hydrogen ions that result from the collision of electrons with water molecules move toward the cathode. Hydrogen ions bombard the cathode's negative surface, transferring kinetic energy to it. This causes momentum transfer and corrosion of the tin anode (Baharlounezhad et al., 2023).
In the cathodic plasma design, Fig. 1 shows the synthesis of tin oxide nanoparticles on the water surface after 3 min. Moreover, the plasma generation triggered oxidation and reduction reactions by introducing highly reactive species into the water. When plasma interacts with the water surface, it creates highly reactive free radicals like hydrogen radicals (strong reductants), hydroxyl radicals (strong oxidants), or steam. These radicals, which are made up of ions, free electrons or electronically stimulated atoms, separate the water molecules and provide the oxygen needed for the tin to oxidation.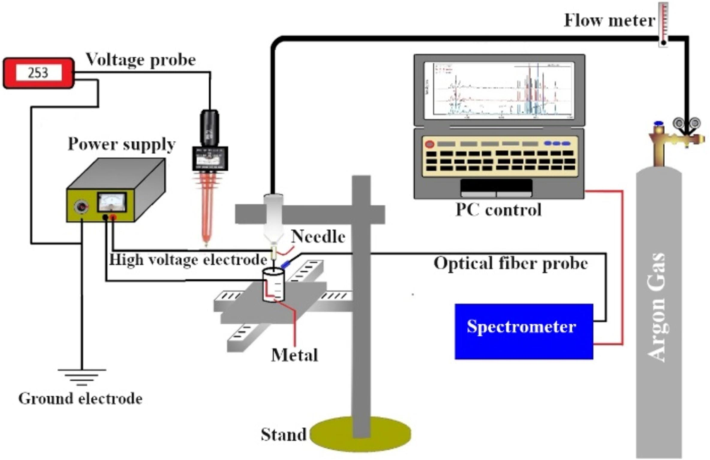
The experimental system.
2.2 Plasma jet setup to synthesis of SnO2 NPs
Figure 1. shows the non-thermal plasma jet device used in nanoparticle synthesis. It was placed 1 cm above deionized water containing a tin sheet purchased from Sigma-Aldrich in the USA (1 cm wide, 5 cm long) as an anode that was immersed in a liquid and sprayed with plasma through a stainless-steel needle serving as a cathode (inner circumference 2.5 mm, length 5 cm) at a distance of 3 cm from the anode by using a DC power source and a strong voltage of 13 kV at different times (3 and 5 min) to produce tin oxide nanoparticles. Argon was used as the drain gas and connected to the syringe through a glass flowmeter at a rate of 1, 2, and 3 L/min during diagnosis. On the other hand, the flowmeter was set at a 2 L/min rate to synthesize NPs, and as the preparation time progressed, the solution color remained clear with a little change to turbid. Consequently, this serves as an initial indicator of SnO2 NPs synthesis. the spectral emissions of the generated plasma were determined using a S3000-UV-NIR spectrometer device (Hangzhou Seeman Technology), which has wavelengths ranging between (190–1070 nm) and the spectral resolution is 1.8 nm. The spectrometer was connected to an optical fiber cable (SMA-905) to record spectral emissions and diagnose the operating parameters of argon plasma. The spectral lines were identified using the atomic spectra database (NIST). The electron temperature is the most important parameter that directly describes the average electron kinetic energy in a plasma. The most common method for calculating it is the double-line method, as shown in the formula below (Chen, 2019).
The density of electrons plays an important role in diagnosing plasma properties. The measured spectral lines show a significantly broadened line width compared to the natural line width. Plasma broadening occurs through three main processes: moving atoms (Doppler broadening), charged species collisions (Stark broadening), and neutral species collisions on strong resonance lines (resonance broadening) (Hafez et al., 2003).. Stark broadening, which happens when collisions, mostly with plasma electrons, disturb the oxygen atoms' excited states, is the broadening's primary cause. In this case, the effects of Doppler broadening and resonance broadening are not significant. Therefore, these two broadenings are neglected. There is a direct relationship in the quasi-static approximation between the density of the plasma and the FWHM of the Stark broadening line width (ΔλO I) (Bernhardt, 2008).
2.3 Antibacterial activity assay
The study used the agar-well diffusion method and the standard broth dilution method (CLSI M07-A8) to test how well SnO2 NPs inhibit the growth of Escherichia coli and Staphylococcus aureus. Each petri dish was filled with 25 ml of Mueller-Hinton agar in the well diffusion assay. 50 μl of both types of bacteria were cultured in Mueller-Hinton broth (MHB) medium for one night at 37 °C. Three wells were created on the agar with appropriate spacing between each well and injected with NPs solution at concentrations of 30, 60, and 90 μg/ml. The plates were incubated at 37 °C for 18 to 24 h. The zones of inhibition (ZOI) were measured after incubation. Agar-well diffusion is a common antibacterial test that assesses a substance's activity against bacteria, with the inhibition zone's diameter influenced by the material's solubility and infusibility. Meanwhile, the minimum inhibitory concentration (MIC) method, which uses tubes of diluted concentrations to detect the minimum concentration inhibiting bacteria growth, can demonstrate more efficacy than the agar-well diffusion method. On the other hand, the minimum inhibitory concentration (MIC) method works better than the agar-well diffusion method. It uses tubes of diluted concentrations to find the lowest concentration that inhibits bacteria from growing. The IMC method estimates the antibacterial efficacy of a substance by directly interacting nanoparticles with pathogenic microorganisms, irrespective of material and medium parameters. We used seven tubes for each type of bacteria and added 5 ml of MHB to each one. The tube on the right was used as a negative control and only contained MHB. On the other hand, the tube on the left side held MHB mixed with bacteria, serving as a positive control. After that, nanoparticles were added to each of the seven tubes at concentrations of 0.5, 2, 4, 8, 16, 32, and 64 µg/ml from a stock solution of 90 µg/ml SnO2 NPs. Following this, 500 μl of each type of bacteria that had been prepared was added, with a McFarland concentration of 0.5. The tubes were incubated at 37 °C for 18 to 24 h. To confirm the MIC for the tested bacteria. The study evaluated the optical turbidity of six groups of tubes before and after incubation.
3 Results and discussion
3.1 Emission spectra of the non-thermal plasma jet
Figure 2 shows that the argon plasma emission spectra were mostly focused after 690 nm, specifically between 690 and 950 nm, as previously reported in the literature (Jiang et al., 2014). Several excited argon atomic lines are detected at (696.54, 706.87, 727.29, 738.39, 751.46, 763.51, 772.42, 794.82, 801.48, 811.53, 826.45, 842.46, 852.14, 866.79, 912.30, 922.45, and 965.78 nm). Increasing the argon flow rate directly increases the intensity of these atomic lines. At the same time, several oxygen atomic lines are associated with OI, represented by wavelengths of 715.67, 777.54, and 822.18 nm. The results are consistent with those reported in references (Rezaei et al., 2018; Sarani et al., 2010). The plasma is formed in the atmosphere, with a portion of the surrounding air being drawn into the plasma jet. This results in the presence of various active particles that include nitrogen and oxygen. The emission bands and lines of molecular nitrogen have wavelengths ranging from 320 nm to 380 nm. Moreover, the emission lines of hydrogen (Hα) are at 656.3 nm and (Hβ) is at 486.13 nm, consistent with the previous study (Khanikar, xxxx). The emission bands of OḢ hydroxyl radical at 306 nm to 312 nm, which result from water molecules' dissociation, are present. The results are consistent with several previous studies (Jiang et al., 2014; Pan, 2015). In addition to that, the measurement of OH2nd at 603.45 nm aligns with (Khanikar, xxxx; Bruggeman and Leys, 2009). The emission spectra of plasma-activated water show reactive nitrogen, such as the N2 second positive system (SPS) at 335, 356, and 380 nm and the N2+ first negative system (FNS) at 391 nm. This suggests that discharge above the water surface may create reactive nitrogen and oxygen species. The energetic electrons collide with oxygen and nitrogen molecules in the surrounding air to form these species (Hong, 2012; Potočňáková et al., 2015). Table 1. shows a direct correlation between the gas flow rate and each of the plasma parameters.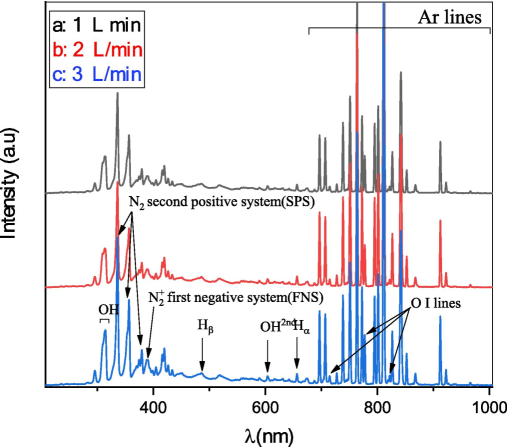
Plasma emission spectra at varying flow rates of argon gas, 1 to 3 L/min.
Gas Flow (L/min)
Te(eV)
HMFW
Ne × 1017(cm−3)
ωpe × 1012(Hz)
λD × 10-5(cm)
ND (cm3)
1
0.248
2.2225
6.69
7.344
0.452
258.648
2
0.255
2.2417
6.75
7.377
0.457
269.724
3
0.261
2.3399
7.05
7.539
0.452
272.566
3.2 Characterization of SnO2 NPs
Figure 3 shows the crystal structure analysis of the prepared nano-tin oxide samples using an XRD pattern. The obtained sharp diffraction peaks with high crystallinity correspond to the tetragonal rutile structures of SnO2 (JCPDS, 41–1445). Pure-phase SnO2 has been successfully formed, as no additional peaks or crystallographic phases have been observed in the sample. The positions of diffraction peaks (2θ) at values of 26.6°, 33.6°, 37.6°, 39.2°, 51.5°, 58°, 64.5°, and 65.9° are corresponding to the (110), (101), (200), (111), (211), (002), (112), and (301) planes, respectively. The well-crystallized SnO2 NPs can be observed by the sharp and strong diffraction peaks (Mani et al., 2018). A comparison of the relative intensities of diffraction peaks in our study showed that (211) is the preferred growth direction of the nanoparticles. Although the structure of SnO2 in a tetragonal rutile is characterized by (110) being the most thermodynamically stable surface, the other surfaces exhibit slightly less stability. It is possible that the surface relaxation process can lead to ionic displacements and lower the surface energy. As a result, the bonds between surface ions that don't coordinate well with those below them tighten. The synthesis method of NPs plays an important role in these possibilities (Oviedo and Gillan, 2000). The results are in line with the studies (Narsimulu et al., 2020; Kumar, 2022). Scherrer formula (Abdulhadi, 2022) indicates that SnO2 has an average crystallite size of 12.45 nm at a preparation time of 3 min.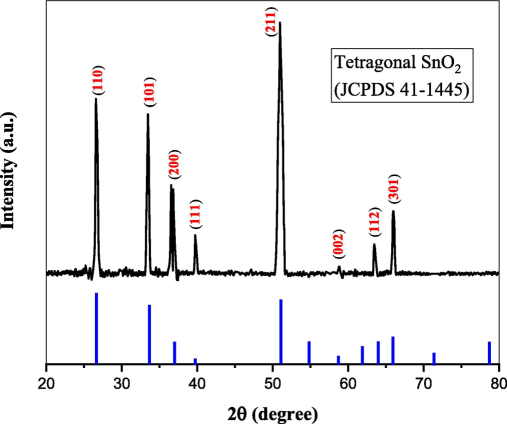
XRD pattern of the prepared sample.
Fig. 4. shows FE-SEM images of nanoparticles formed after the tin sheet was exposed to non-thermal plasma for 3 and 5 min and then deposited on glass using the drop-cast method. The images show the successful growth of SnO2 NPs. The non-thermal plasma exposure period is important to the shape of the formed SnO2 NPs. According to different exposure times of non-thermal plasma, spherical and homogenous nanoparticles were obtained. The average nanostructure diameters, approximately 22 nm in 3 min, increased as the plasma exposure duration reached 58 nm in 5 min. The increased period of plasma jet exposure has been shown to improve grain growth through smaller grains that merge to form larger ones. This is because the nanoparticles' high kinetic energy causes the atoms on their surfaces to become unstable and aggregate. (Abdulhadi, 2022).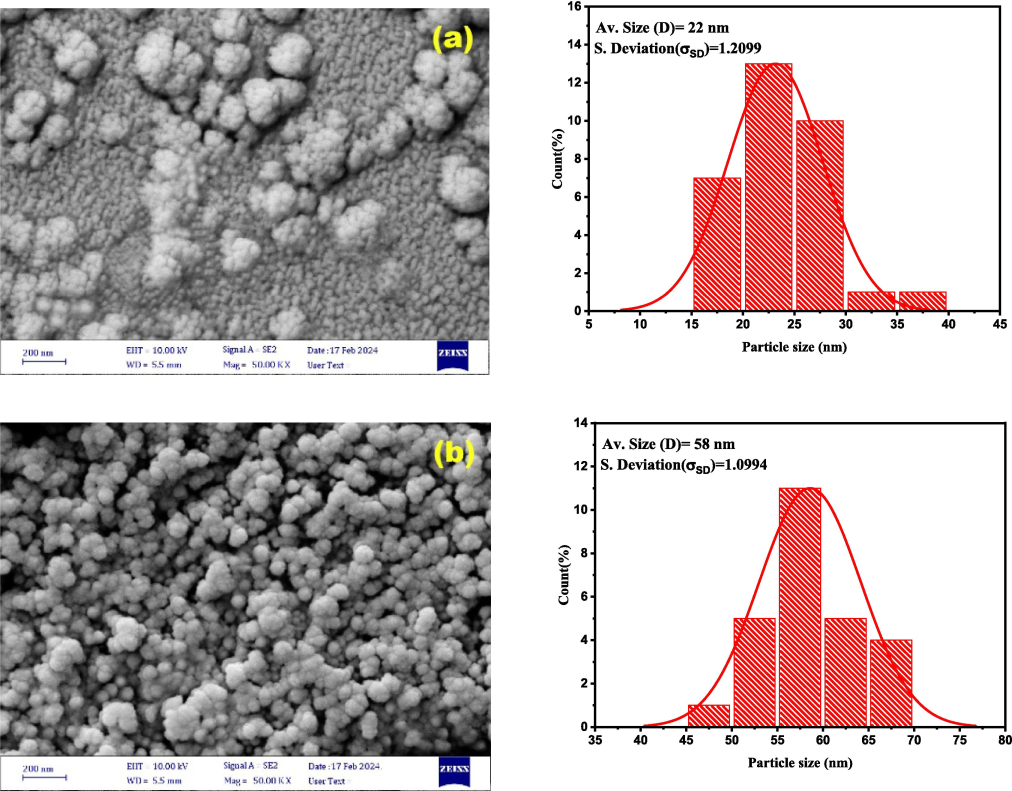
FESEM images and particle size distribution of SnO2NPs prepared by the drop-cast method as a function of the preparation time: (a) 3 min; (b) 5 min.
Therefore, changing the plasma exposure time can alter the particle aggregation phenomenon. Optimizing the nanoparticles' shape and other characteristics will enhance their inhibitory impact or interaction with pathogenic bacteria. This behavior aligns with studies (Abbas and Adim, 2023; Li, 2013).
UV–vis spectroscopy is a necessary technique for analyzing colloidal liquids. Fig. 5 shows the absorption spectra of synthesized nanoparticles at the wavelength range of 200–800 nm. The collective oscillation of free electrons, or surface plasmon resonance (SPR), affects nanomaterial properties. The height and width of SPR peaks are dependent on the size, shape, and surrounding media. In the UV region, SPR shows absorbance in the peak range (255–260 nm); previous literature has confirmed the formation of SnO2 NPs within this specific range (Thoker et al., 2020; Al-Enazi et al., 2023). The solution color shows a clear transition from a clear solution to a turbid white solution with an increase in the plasma's prepared time. There is a clear decrease in absorption spectra, which refers to the transparency of tin oxide to visible light (Jahnavi et al., 2019). The bathochromic shift in SPR signal from 255 nm to 260 nm was recorded at an increased preparation time of 3 to 5 min, indicating increased SnO2 particle sizes; this behavior is usually associated with possible aggregating. Furthermore, the strong peaks indicate the synthesized nanoparticles' low crystalline size, high purity, and perfect crystallinity, as reported in the literature (Abdulhadi, 2022; Abdulhadi et al., 2021).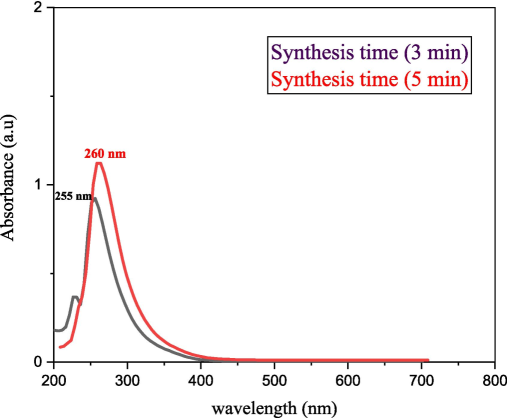
The absorption spectra of the synthesized samples.
Zeta potential (ZP) measurements were done using (Zetasizer Lab Blue Label, Malvern Instruments Limited, USA). Measurements were taken using two different exposure times of non-thermal plasma (3 and 5 min). ZP measurements may be used to evaluate the stability of colloidal particles in solution. The Z-potential of sample (a) was measured to be −11.2 mV at a synthesis time of 3 min and −5.95 mV for sample (b) at a synthesis time of 5 min (see Fig. 6). Generally, zeta values of (±0–10 mV) highly unstable, (±10–20 mV) relatively stable, (±20–30 mV) moderately stable, and finally values more than (±30 mV) highly stable, as reported in the literature (Bhattacharjee, 2016). Consequently, this outcome suggests that the particles in the synthesis time of 3 min are relatively stable colloids and can aggregate if left for a long time before solidifying into films on glass substrates or other surfaces, aligning with visual observations.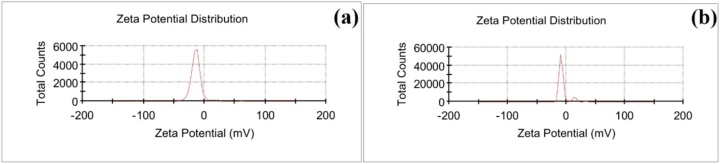
ZP results of the synthesized samples.
The present study used inductively coupled plasma mass spectrometry, or ICP-MS technology, to estimate the concentration of the synthesized nanoparticles in solution or liquid. The study found that the non-thermal plasma completely ablates or synthesize the nanoparticles from the metal tin sheet. The concentration of Sn NPs was 90 μg/ml at three minutes and 100 μg/ml at five minutes. However, determining whether impurities, like oxygen, bound to the tin to form SnO2 or if the tin metal Sn was free in solution proved challenging. This is due to the inability of ICP-MS technology to distinguish whether the metal is free or bound. Finally, the study found a direct correlation between plasma exposure duration and increased tin concentration in the solution.
3.3 Antibacterial activity
Fig. 7 shows that SnO2 NPs effectively inhibited both types of bacteria at a concentration of 90 μg/mL compared to other concentrations. The size and shape of SnO2 NPs significantly impact their ability to inhibit bacteria. The smaller NPs increase their antibacterial activity when they aggregate with bacterial effluent, as they expose more of their surface to the bacterial membrane. Having such a large contact surface will significantly improve microbe elimination. As a result, the nanoparticles bind to the bacteria's cell wall and dilapidate the membrane's permeability, causing cell death. However, achieving a small size is not the sole objective. The formulation of bactericidal materials is particularly concerned with synthesizing and characterizing nanoscale materials and their characteristics (Pal et al., 2007). The study found that SnO2 NPs had a higher inhibitory influence on the gram-positive bacteria than the gram-negative bacteria, as shown by the inhibition values in Table 2. This could be due to variations in the chemical structure and composition of the bacteria's cell wall. The cell walls of Gram-positive bacteria are thicker than those of Gram-negative bacteria. Gram-positive bacteria have a thick, porous peptidoglycan layer in their cell wall. This makes it easier for antibacterial agents to penetrate inside and/or interact with the peptidoglycan itself, causing cell death. This is in addition to their varying sensitivity to metal oxide nanoparticles. The charge on the outer wall of the Gram-positive bacterial cell is greater than that of the Gram-negative, which enhances their ability to attract nanoparticles. Nanoparticles' small size at lower temperatures allows them to penetrate and dilapidate the cell wall, causing cell death (Khan et al., 2021).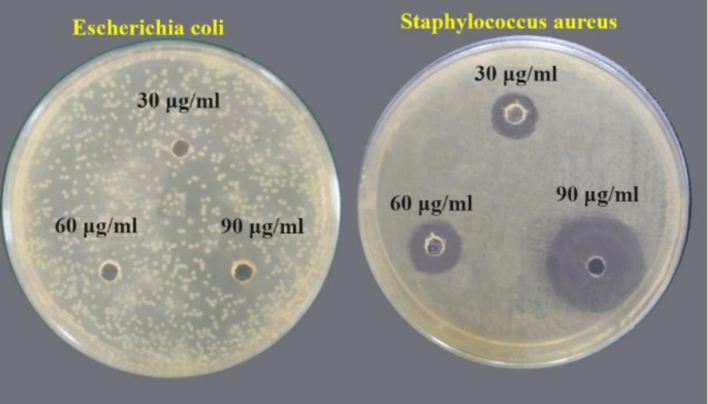
Images showing the antibacterial activity of SnO2 NPs on two types of bacteria.
Concentration of SnO2 NPs (μg/ml)
E. coli
Staphylococcus aureus
30
0
15.344
60
0
17.465
90
17.202
30.665
The standard broth dilution method (CLSI M07-A8) is used in determining the minimum inhibitory concentration (MIC) of nanoparticles that visually inhibit microorganism growth by 99 %. (Krishnan et al., 2015). Fig. 8 showed that SnO2 NPs effectively inhibited the growth of both types of bacteria, but there were variations due to the differences in cell walls and sensitivity to metal oxide nanoparticles. Nanoparticles can destroy microorganisms by causing intracellular material leakage through hole formation on cell walls, which is caused by the oxidation of cell liposaccharides (Ghasemizad et al., 2022). The MIC results for SnO2 NPs at different concentrations against Staphylococcus aureus significantly inhibited bacterial growth. After incubation, three tubes (16, 32, and 64 mg/ml) showed no bacterial growth after incubation. The optimal MIC for E. coli bacteria was only 64 μg/ml. These results confirm that Gram-positive bacteria respond more to SnO2 NPs compared to Gram-negative bacteria.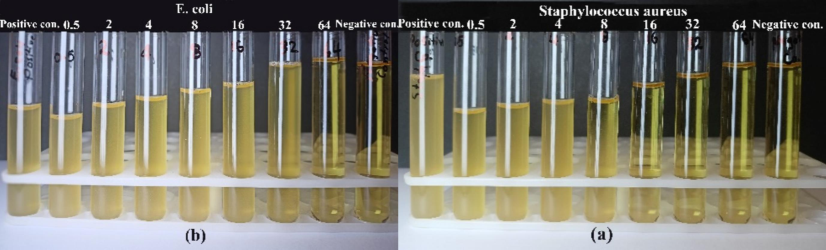
Experimental antibacterial activity test tubes of SnO2 NPs by the MIC method.
4 Conclusion
In conclusion, the non-thermal plasma jet technique is a rapid, simple, low-cost, and scalable technology that can synthesize a SnO2 NPs solution. The UV–vis analysis shows a transition in color from a clear solution to a turbid white solution during the applied plasma; the results confirm the production of a colloidal solution containing SnO2 NPs.
The SPR peak at around 255–260 nm also confirms the synthesis of highly crystalline SnO2 NPs. The XRD test shows the creation of pure-phase SnO2, which is shown as tetragonal rutile structures (JCPDS, 41–1445). The morphology analysis by FE-SEM shows that particles are spherical and homogenous nanoparticles whose size and distribution depend on the preparation time. ZP indicates that SnO2 NPs colloids have relative stability. The antibacterial activity of SnO2 NPs was studied using the agar-well diffusion method. As a result, the nanoparticles can inhibit both types of bacteria (E. coli and Staphylococcus aureus), so they can be used as an antibacterial agent. The MIC results from this study also show that SnO2 NPs have an effective antibacterial concentration of 16 μg/ml against Staphylococcus aureus bacteria and 64 μg/ml against E. coli.
CRediT authorship contribution statement
Omar O. Abdulhadi: Writing – review & editing, Writing – original draft, Investigation, Funding acquisition, Formal analysis, Data curation. Hamsa A. Ali: Writing – review & editing, Writing – original draft, Software, Methodology, Conceptualization. A.S. Obaid: Visualization, Validation, Supervision, Project administration, Investigation.
Declaration of competing interest
The authors declare that they have no known competing financial interests or personal relationships that could have appeared to influence the work reported in this paper.
References
- Synthesis and characterization of magnesium oxide nanoparticles by atmospheric non-thermal plasma jet. Kuwait J. Sci.. 2023;50(3):223-230.
- [CrossRef] [Google Scholar]
- Synthesis and characterization of nickel nanoparticles formed by solution cold plasma jet. J. Phys. Conf. Ser. IOP Publishing Ltd 2021:1-12.
- [CrossRef] [Google Scholar]
- Characterizing of chromium oxide nanoparticles formation from solution plasma synthesis by plasma jet. In: 4th International Conference on Materials Engineering & Science AIP Conf.. AIP Publishing; 2022. p. :20121-20129. 10.1063/5.0126414
- [Google Scholar]
- Tin oxide nanoparticles (SnO2-NPs) synthesis using Galaxaura elongata and its anti-microbial and cytotoxicity study: a greenery approach. Appl. Nanosci.. 2023;13(1):519-527.
- [CrossRef] [Google Scholar]
- Plasma-based one-step synthesis of tungsten oxide nanoparticles in short time. Sci. Rep.. 2023;13(1):7427.
- [CrossRef] [Google Scholar]
- Spectroscopic analysis of femtosecond laser plasma filament in air. Opt. Commun.. 2008;281(5):1268-1274.
- [CrossRef] [Google Scholar]
- DLS and Zeta Potential - What They Are And What They Are Not?. Elsevier B.V; 2016. 10.1016/j.jconrel.2016.06.017
- Non-thermal plasmas in and in contact with liquids. J. Phys. D Appl. Phys.. 2009;42(5):053001
- [CrossRef] [Google Scholar]
- Effects of working medium gases on emission spectral and temperature characteristics of a plasma igniter. J. Spectrosc... 2019;2019:1-10.
- [CrossRef] [Google Scholar]
- Nanostructured oxides in chemistry: Characterization and properties. Chem.. Rev.. 2004;104(9):4063-4104.
- [CrossRef] [Google Scholar]
- Optimization and characterization of bioactive biocomposite film based on orange peel incorporated with gum arabic reinforced by Cr2O3 nanoparticles. J. Polym. Environ.. 2022;30(6):2493-2506.
- [CrossRef] [Google Scholar]
- Characteristics of Cu plasma produced by a laser interaction with a solid target. Plasma Sources Sci. Technol... 2003;12(2):185-198.
- [CrossRef] [Google Scholar]
- Measurement of hydroxyl radical density generated from the atmospheric pressure bioplasma jet. J. Instrum.. 2012;7(03):C03046
- [CrossRef] [Google Scholar]
- Structural, optical, magnetic and dielectric studies of SnO2 nano particles in real time applications. Phys. B Condens. Matter.. 2019;565:61-72.
- [CrossRef] [Google Scholar]
- Characterization of argon direct-current glow discharge with a longitudinal electric field applied at ambient air. Sci. Rep.. 2014;4(6323):1-10.
- [CrossRef] [Google Scholar]
- Synthesis, characterization and anti – bacterial activities of SnO 2 nanoparticles using biological molecule. IOP Conf. Ser.: Mater. Sci. Eng... 2018;360(1):012007
- [CrossRef] [Google Scholar]
- Green synthesis of chromium oxide nanoparticles for antibacterial, antioxidant anticancer, and biocompatibility activities. Int. J. Mol. Sci... 2021;22(2):502.
- [CrossRef] [Google Scholar]
- R. R. Khanikar and H. Bailung. Cold Atmospheric Pressure Plasma Technology for Biomedical Application.” [Online]. Available: www.intechopen.com.
- Antibiotic selective pressure and development of bacterial resistance. Int. J. Antimicrob. Agents.. 2001;17(5):357-363.
- [CrossRef] [Google Scholar]
- The MIC and MBC of silver nanoparticles against Enterococcus faecalis - A facultative anaerobe. J. Nanomed. Nanotechnol.. 2015;06(03):1-4.
- [CrossRef] [Google Scholar]
- B-doped SnO2 nanoparticles: a new insight into the photocatalytic hydrogen generation by water splitting and degradation of dyes. Environ. Sci. Pollut. Res... 2022;29(31):47448-47461.
- [CrossRef] [Google Scholar]
- Preparation of photoluminescent single crystalline MgO nanobelts by DC arc plasma jet CVD. Appl. Surf. Sci... 2013;274:188-194.
- [CrossRef] [Google Scholar]
- High performance photocatalytic activity of pure and Ni doped SnO2 nanoparticles by a facile wet chemical route. J. Mater. Sci. Mater. Electron... 2018;29(8):6308-6315.
- [CrossRef] [Google Scholar]
- Rational design of SnO2 nanoflakes as a stable and high rate anode for lithium-ion batteries. J. Mater. Sci. Mater. Electron... 2020;31(11):8556-8563.
- [CrossRef] [Google Scholar]
- Energetics and structure of stoichiometric SnO2 surfaces studied by first-principles calculations. Surf. Sci... 2000;463(2):93-101.
- [CrossRef] [Google Scholar]
- Does the antibacterial activity of silver nanoparticles depend on the shape of the nanoparticle? A study of the gram-negative bacterium Escherichia coli. Appl. Environ. Microbiol.. 2007;73(6):1712-1720.
- [CrossRef] [Google Scholar]
- Cold plasma-induced surface modification of heat-polymerized acrylic resin and prevention of early adherence of Candida albicans. Dent. Mater. J... 2015;34(4):529-536.
- [CrossRef] [Google Scholar]
- Spatially resolved spectroscopy of an atmospheric pressure microwave plasma jet used for surface treatment. Open Chem.. 2015;13(1):541-548.
- [CrossRef] [Google Scholar]
- F. Rezaei, P. Vanraes, A. Nikiforov, R. Morent, and N. De Geyter. Applications of Plasma-Liquid Systems : A Review. 2019.
- Plasma modification of poly lactic acid solutions to generate high quality electrospun PLA nanofibers. Sci. Rep.. 2018;8(1):2241.
- [CrossRef] [Google Scholar]
- Atmospheric pressure plasma jet in Ar and Ar/H2O mixtures: Optical emission spectroscopy and temperature measurements. Phys. Plasmas.. 2010;17(6):635041-635048.
- [CrossRef] [Google Scholar]
- Preparation and characterization of SnO2 nanoparticles for antibacterial properties. Nanomater. Chem. Technol.. 2020;2(1):1-5.
- [CrossRef] [Google Scholar]


