

Association of FokI, Tru91, and ApaI vitamin D receptor gene polymorphisms with the development of polycystic ovarian syndrome: A molecular genetic study
⁎Corresponding author. ph.dr.mushtak_72@uoanbar.edu.iq (Mushtak T.S. Al-Ouqaili),
-
Received: ,
Accepted: ,
This article was originally published by Elsevier and was migrated to Scientific Scholar after the change of Publisher.
Abstract
Background and objective
Polycystic ovarian syndrome (PCOS) is an endocrine disorder in women of reproductive age. The study aims to identify the impact of vitamin D receptor encoding genes (FokI, Tru91, and ApaI) on the contribution and development of PCOS, in addition to their effect on AMH levels.
Methodology
The study included 80 patients and 25 healthy individuals. The concentrations of free testosterone, vitamin D, and AMH were determined. PCR-RFLP was applied to identify vitamin D receptors in the FokI, Tru91, and ApaI SNPs. Sanger sequencing was performed on each of these patients.
Results
Increase free testosterone and AMH levels 48 (60 %) and 65 (81.3 %), respectively and reduced vitamin D levels (56 (70 % were predictors of PCOS. Regarding FOKI polymorphisms, the frequency of the heterozygous genotype (CT) was significantly greater (OR = 2.96, P < 0.05) in the PCOS group than in the healthy group. There was a three-fold increase in the prevalence of the ApaI genotype in PCOS patients versus controls (the odds ratio for the CC homozygous genotype was 3.43 with P > 0.05). In Tru91 polymorphism, the AA and GG were associated with risk factors for PCOS susceptibility (OR = 2.78, P < 0.05) (OR = 3.04, P > 0.05), whilst AG was a protective factor (OR = 0.24, P < 0.05).
Conclusions
A relationship between high levels of free testosterone, AMH levels, and vitamin D deficiency was observed. Furthermore, all genetic models’ VDR FokI, ApaI, and VDR Tru91 polymorphisms are linked to PCOS susceptibility.
Keywords
− PCOs
Vitamin D receptors
PCR-RFLP
Sanger sequencing

1 Introduction
Polycystic ovary syndrome (PCOS) is prevalent as a condition among women of reproductive age and affects the reproductive, endocrine, and metabolic systems (Ganie et al. 2024). In addition to hyperandrogenism, a lack of ovulation, acne, hirsutism, irregular menstrual cycles, and alopecia (Raja et al.,2024) have a range of complications. The National Institute of Health (NIH) 1990 and Rotterdam 2003 definitions have been used to determine the global prevalence of PCOS (Jaswa et al. 2020). The combined influence of genetic and environmental factors is generally seen as vital to decide on the incidence and progression of PCOS (Mehdizadeh et al. 2017). There is a possible relationship between vitamin D concentrations, metabolism, and endocrine problems, according to research by (Tobias et al. 2023). Vitamin D is one of the main steroid hormones that helps maintain calcium levels and supports the progression of bone minerals (Skalny et al. 2024). Vitamin D is reformed into 1,25-dihydroxycholecalciferol in the liver and kidneys (Makris et al.,2020). Low vitamin D levels have previously been related to PCOS symptoms, clinical indications, and the consequences of the condition in many studies (Wehr et al., 2009; Krul-Poel et al., 2013). Vitamin D receptors (VDRs) exist in several regions of the female reproductive system (Lu et al. 2024). VDR controls the effect of the hormone 1,25(OH)2D3 on the body, which assembles a signal-transduction complex in conjunction with a heterodimer. This compound comprises a VDR coupled to 1α,25(OH)2D3 (Hendi 2023). SNPs, or single nucleotide polymorphisms, are the most frequent variations seen in nucleotides in human DNA, where the VDR gene is set at 12q13.11. The structure has eight exons that code for proteins and one untranslated exon (Baker et al. 1988). It has been found that the three most prevalent VDR variants are FokI (rs10735810 C > T), in exon 2, which are 265 bp in length. The length of the ApaI gene (rs7975232 G > T) in exon 8 is 740 bp, while that of the Tru9I gene (rs5757343 A > G), which is situated within intron 8 has a length of 331 bp. They are investigated in various studies regarding the associations between VDR and PCOS susceptibility (Shi et al. 2019). Thus, this research aims to observe the impact of the vitamin D3 together with the vitamin D receptor gene including Apa1, Fok1, and Tru9Ion, on the probability and vulnerability of PCOS. Additionally, a further goal of the present study is to look at the links relating to the impact of three genetically significant polymorphisms on anti-Mullerian hormone (AMH) levels in PCOS females.
2 Subject and Methods
2.1 Selection of the control individuals and study participants
Out of the 105 Iraqi women involved in the examination study group, 25 (23.8 %) were healthy individuals, while 80 (76.2 %) were study patients who had presented with PCOS. The participants had been admitted to the Department of Obstetrics and Gynecology for Maternity and Child Teaching Hospital in AL-Anbar province between March 2023 and September 2024. The study participants were divided into 1) a patient group represented by 80 individuals with PCO. All women who experienced gynaecologist diagnosis were selected for the study based on two out of the three PCOS Rotterdam criteria (2003). These criteria included ultrasound analysis of polycystic ovarian features, oligomenorrhea/anovulation, and clinical hyperandrogenism or biochemical hyperandrogenism before commencing treatment. 2) The control group represented 25 healthy subjects without disorders in their obstetric gynaecological and internal medical history, and who had no problems with conception. The exclusion criteria included women who had been using multivitamin/mineral supplements within the past two months or women who were utilizing hormonal intrauterine devices and oral contraception or had diseases related to the thyroid, kidneys, or liver in addition to diabetes mellitus, as well as pregnant and lactating women.
2.2 Ethics Approval Committee
After the current study's ethical standards for medical research involving individual participants were approved, the study itself was carried out according to the principles outlined in the Helsinki Proclamation. This research was approved on December 24, 2023, by the University of Anbar's Committee on Medical Ethics in Ramadi, Iraq (permission number 141).
2.3 Serological Assessment
Two mL of peripheral blood was collected via a sterile disposable syringe, which was then transferred into the gel tubes as a clot activator tube. The serum samples were separated by spinning in a centrifuge at 1500 rpm for 5 min. Serological tests to detect 25(OH) vitamin D and free testosterone which were purchased from Demeditec Diagnostics GmbH, Germany and anti-Mullerian hormones from Ansh Lab’s, Germany were conducted using fully automated enzyme-linked immunosorbent assay (ELISA) technology manufactured by Elisys, Germany. The normal range for free testosterone in women was 0.00–2.85 ng/mL, and in women with AMH was 0.00–4.00 ng/mL as represented in the above manufacturing kits.
2.4 Molecular Analysis
2.4.1 Extraction of DNA
Two mL of blood was collected and stored in tubes with EDTA. A total of 400 µL of drawn blood was used to extract genomic DNA using a SaMag Kit to separate the DNA from blood tests, whilst the SaMag-12TM automated nucleic acid extraction equipment was employed to extract genomic DNA (Samaga, Cepheid, Italy). A QuantusTM Fluorometer (Promega, USA) was used to measure the concentration of extracted nucleic acid to determine the quality of the sample for further applications (Kanaan et al., 2022).
2.4.2 Amplification by Polymerase Chain Reaction
Conventional PCR technology (Riverside, CA, USA) was used for DNA amplification. The initial step involved preparing a stock solution (1000 pmol/L) of the primers (Alpha DNA, Canada). In a reaction buffer solution with a pH of 8.5, the procedure involved the use of a 25 μL solution consisting mixture of 12.5 μL containing a GoTaq® G2 Green Masters Mix, Promega, USA, in addition to one milliliter of each of the forward and reverse primers, 3 μL of the target DNA, 7 μL of nuclease-free water, and 0.5 μL of MgCl2. PCR amplification of the genes was carried out using a program of 35 denaturation cycles at 95 °C for 5 min, followed by denaturation at 93 °C for 45 s and an annealing process at a temperature of 66 °C for 30 s, where the temperature for Fok1 and Apa1, and indeed Tru91, was set at 56 °C for 30 s. The extension phase was conducted at a temperature of 72 °C for 45 s, followed by a final extension at the same temperature for 5 min. Subsequently, a 5 µL quantity of the PCR product was introduced into wells formed in a 1.5 % agarose gel. The allelic and genotypic frequencies were determined using a UV transilluminator (Table 1).
| VDR Variation | The sequence of primer | Size of fragment in base pairs (bp) |
|---|---|---|
| Fok1 (rs10735810) |
Forward:5′AGCTGGCCCTGGCACTGACTCTGCTCT3′ Reverse: 5′ATGGAAACACCTTGCTTCTTCTCCCTC3 |
265 |
| Apa1 (rs7975232) |
Forward: 5′CAGAGCATGGACAGGGAGCAAG3′ Reverse:5′GCAACTCCTCATGGCTGAGGTCTCA3′ |
740 |
| Tru91 (rs757343) |
Forward: 5′AATACTCAGGCTCTGCTCTT3′ Reverse 5′CATCTCCATTCCTTGAGCCT3′ |
331 |
2.4.3 Detection of Fok1 (rs10735810), Apa1 (rs7975232) and Tru91 (rs757343) by PCR-RFLP
Restriction enzymes for FokI, Apa1 and Tru91 were manufactured by (Bio Labs-USA). The FokI, Apa1 and Tru91 digestion procedure was carried out for 3 h at a temperature of 37 °C. An inactivation step was performed at a temperature of 65 °C for 20 min. The PCR products were digested by the enzymes, and electrophoresis was conducted using ethidium bromide-loaded agarose gels with a concentration of 1.5 % in a buffer solution of 1X TBE. The mixture and the gels were subjected to 100 V.
2.5 DNA Sequencing
The sequencing technology for dideoxynucleoside was established by Sanger on the ABI 3730XL by the Macrogen Corporation platform which is located in Seoul in the Republic of Korea. Each sequence underwent examination using the Basic Local Alignment Search Tool (BLAST), which can be accessed through the National Centre for Biotechnology (NCBI) website at https://www.ncbi.nlm.nih.gov/. The purpose of the sequence provided is to compare the genotypes obtained through PCR-RFLP using those found in the sequencing results, to determine whether they match or are mismatched.
2.6 Statistical analysis
The analysis of variables was conducted using IBM’s SPSS v22 software (IBM Corporation, Armonk, NY, USA). To compare the investigated groups, independently conducted t-tests were applied; a P-value below 0.05 was considered the level of statistical significance using Fisher's test with a specific χ2 calculation while the odds ratio was calculated using WINPEPI version 11.63.
3 Results
The main demographic features of the participants and controls are reported in the following Table 2.
3.1 Serological part
Vitamin D deficiency was noted in 56 (70 %) (< 20 ng/mL) of the PCOS women. Additionally, the free testosterone level was increased in 48 (60 %), and the anti-Mullerian hormone levels increased in 65 (81.2 %). Statistical analysis of vitamin D, free testosterone, and AMH levels indicated the presence of statistically significant variations among the research volunteers and the control (P-value < 0.05) (Table 3).
| Parameters | Patients | Control | P-value | |
|---|---|---|---|---|
| Age (year) | 26.31 ± 3.46 | 31.12 ± 3.59 | P > 0.05 | |
| BMI (kg/m2) | 27.83 ± 5.73 | 22.92 ± 1.35 | P > 0.05 | |
| Acne | Yes | 50 (62.5 %) | 0 (0.00 %) | P < 0.05 |
| No | 30(37.5 %) | 25 (100 %) | ||
| Hirsutism | Yes | 58 (72.5 %) | 0 (0.00 %) | P < 0.05 |
| No | 22 (27.5 %) | 25 (100 %) | ||
| Menstruation |
Regular | 6 (7.5 %) | 25 (100 %) | P < 0.05 |
| Irregular | 74 (92.5 %) | 0 (0.00 %) | ||
| Marital status | Married | 44 (55 %) | 5 (20 %) | P < 0.05 |
| Single | 36 (45 %) | 20 (80 %) | ||
| Infertility | Yes | 35 (79.5 %) | 0 (0.00 %) | P < 0.05 |
| No | 9 (20.5 %) | 5 (100 %) | ||
| Parameter | PCOS cases (N = 80) | Control (N = 25) | P-value |
|---|---|---|---|
| VitD3 Deficient (<20 ng/ml) | 56 (70 %) | 0 (0.00 %) | P < 0.05 |
| VitD3 Normal (20–40 ng/ml) | 24 (30 %) | 25(100 %) | |
| High free T (> 2.85 pg/ml) | 48 (60 %) | 0 (0.00 %) | P < 0.05 |
| Normal free T (0.00–2.85 pg/ml) | 32 (40 %) | 25 (100 %) | |
| High AMH (> 4.0 ng/ml) | 65 (81.2 %) | 0 (0.00 %) | P < 0.05 |
| Normal AMH (0.0–––4.0 ng/ml) | 15 (18.8 %) | 25 (100 %) |
3.2 Molecular part of the study
3.2.1 Correlation between the VDR (FokI) gene polymorphism and PCOS
The results of the RFLP analysis for genotypes CC, CT, and TT are illustrated in Fig. 1.
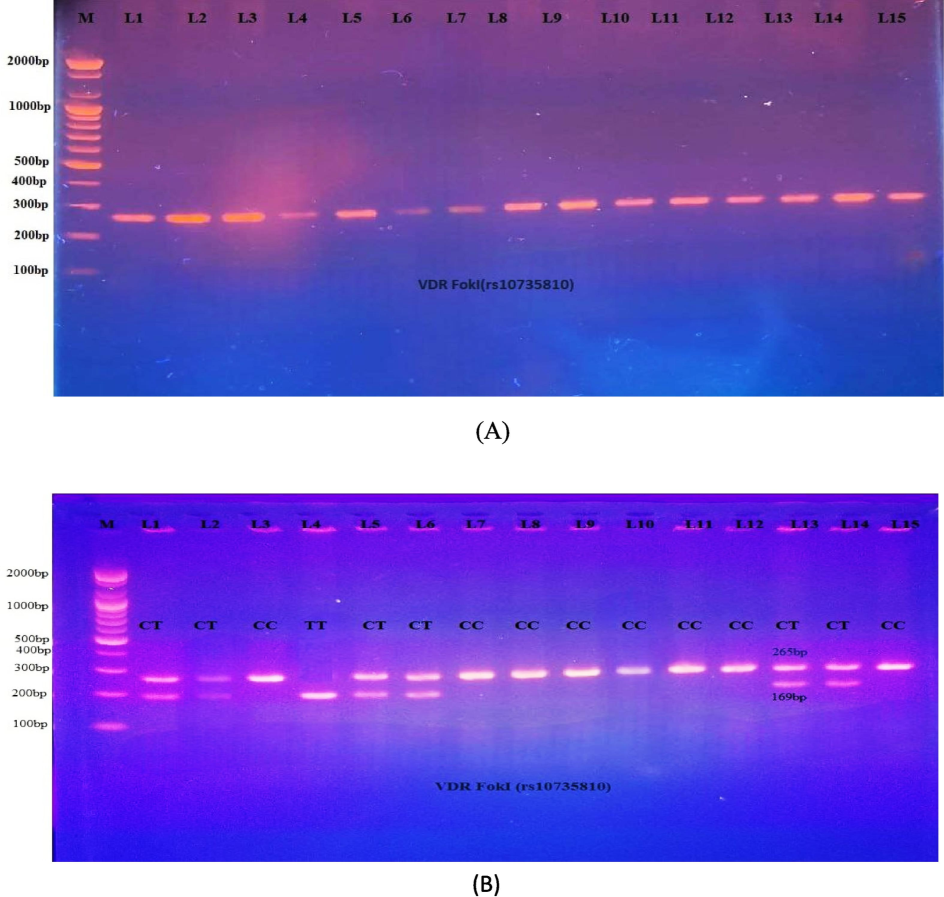
- A: PCR product for the VDR gene (FokI, 265 bp). Fig. 1-B: PCR-RFLP analysis of FokI polymorphisms following digestion with FokI restriction enzymes. The 265 bp bands showed wild homozygote C/C. Both the 96 and 169 bp bands showed mutant homozygote T/T. The 265, 96, and 169 bp bands indicated the presence of heterozygote C/T.
The FokI genotyping revealed that the homozygous CC genotype was less prevalent in PCOS women (32.5 %) than in the controls (60 %). However, this difference indicated a significant negative association with PCOS patients (OR 0.32, 95 % CI (0.13–0.02)), indicating that CC genotyping is a protective factor against this condition. The prevalence of the heterozygous CT genotype (62.5 %) was greater in PCOS patients than in the control (36 %), where this difference was significant in PCOS patients, according to an OR of 2.96 with a 95 % CI in the range of 1.16–––7.54. This suggests that the CT genotype is a strong risk factor for that condition. Moreover, the TT genotype was less prevalent in the control group (4 %) than in the PCOS group (10 %), but this difference was not significant (P-value = 0.84). Furthermore, according to the odds ratio, allele T is associated with disease (odds ratio = 2.02) among PCOS patients and controls, demonstrating that it may be associated with an increased susceptibility to PCOS (OR > 1.0). In addition, the CC-dominant model selected in this study had a protective factor, OR, of 0.32 (P = 0.01) (Table 4).
| Genotyping | Frequency, n (%) | H-WE | p-value | Odds ratio | CI95% | |
|---|---|---|---|---|---|---|
| PCOS | Control | |||||
| CC | 26 (32.5 %) | 15 (60 %) |
P = 0.81 X2 = 0.059 |
0.02 | 0.32 | 0.13–0.81 |
| CT | 50 (62.5 %) | 9 (36 %) | 0.02 | 2.96 | 1.16––7.54 | |
| TT | 4 (10 %) | 1 (4 %) | 0.27 | 1.26 | 0.13–11.85 | |
| Allele distribution | ||||||
| C | 102 (63.75 %) | 39 (78 %) | 0.06 | 0.49 | 0.24–1.04 | |
| T | 58 (36.25 %) | 11 (22 %) | 0.06 | 2.02 | 0.96–4.23 | |
| Genetic mode | ||||||
| CC | 26 (32.5 %) | 15 (60 %) | 0.01 | 0.32 | 0.13–0.81 | |
| C/T-T/T | 54 (67.5 %) | 10 (40 %) | ||||
| CT/CC | 76 (95 %) | 24 (96 %) | 0.84 | 0.8 | 0.08–7.42 | |
| TT | 4 (5 %) | 1 (4 %) | ||||
The significant difference is considered to be ≤ 0.05. OR: odds ratio, Cl: confidence interval.
3.2.2 Correlation between VDR (Apal) rs7975232 gene polymorphism and PCOS risk
The genotypic frequencies of the Apal SNPs in the control group conformed to HWE. The Apa1 genotypes were positively associated with disease based on the odds ratio (1.1247; 95 % confidence interval [CI] 0.4427–2.8573 for the AA genotype, and 3.4286; 95 % CI 0.4168–28.2034 for the CC genotype). The heterozygote genotype AC showed a negative association with disease because the frequency of the AC genotype in the control group was greater than that in the PCOS group; however, this relationship was not significant (0.6341 odds ratio: Cl between 0.2546 and 1.5792). Moreover, no significant association was detected between the two alleles and PCOS patients in contrast to the control group, implying that the C allele might be considered a risk factor (OR = 1.13, 95 % CI, 0.58–2.21). Depending on the odds ratio, the recessive model could potentially be a risk factor (OR = 3.43, 95 % CI, 0.42–28.20, P-value = 0.25), as reported in Table 5 and Fig. 2.
| Genotyping | Frequency, n (%) | H-WE | P-value | Odds ratio | CI95% | |
|---|---|---|---|---|---|---|
| PCOS | Control | |||||
| AA | 31 (38.75 %) | 9 (36 %) |
P = 0.09 X2 = 2.84 |
0.85 | 1.12 | 0.44–2.86 |
| AC | 39 (48.75 %) | 15 (60 %) | 0.33 | 0.63 | 0.44–2.86 | |
| CC | 10 (12.5 %) | 1 (4 %) | 0.25 | 3.43 | 0.42–28.20 | |
| Alleles distribution | ||||||
| A | 101 (63.13 %) | 33 (66 %) | 0.71 | 0.88 | 0.45–1.72 | |
| C | 59 (36.88 %) | 17 (34 %) | 0.71 | 1.13 | 0.58–2.21 | |
| Genetic model | ||||||
| A/A | 31(38.75 %) | 9 (36 %) | 0.80 | 1.12 | 0.44–2.86 | |
| A/C–C/C | 49 (61.25 %) | 16 (64 %) | ||||
| A/C- A/A | 70 (87.5 %) | 24 (96 %) | 0.25 | 3.43 | 0.42–28.20 | |
| C/C | 10 (12.5 %) | 1 (4 %) | ||||
Significant difference is at ≤ 0.05.
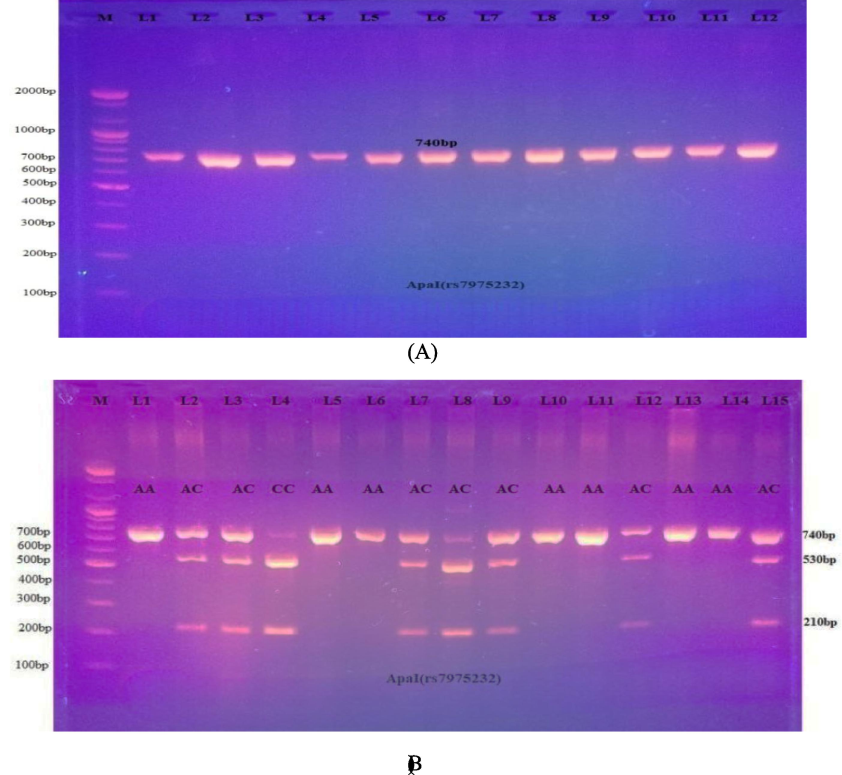
- A: PCR results for the VDR gene (Apa1, 740 bp). 2-B: Electrophoretogram of DNA fragments for ApaI variations after ApaI digestion. Homozygote A/A was indicated by the bands at 740 bp. The bands at 530 and 210 bp indicated homozygote C/C. Heterozygous A/C was indicated through the bands at 740, 530, and 210 bp.
3.2.3 Correlation between the VDR (Tru9I) rs757343 gene polymorphism and PCOS risk
The DNA obtained was analyzed via the PCR-RFLP technique. Three distinct genotypes (AA, AG, and GG), which are depicted in Fig. 3 (A, B).
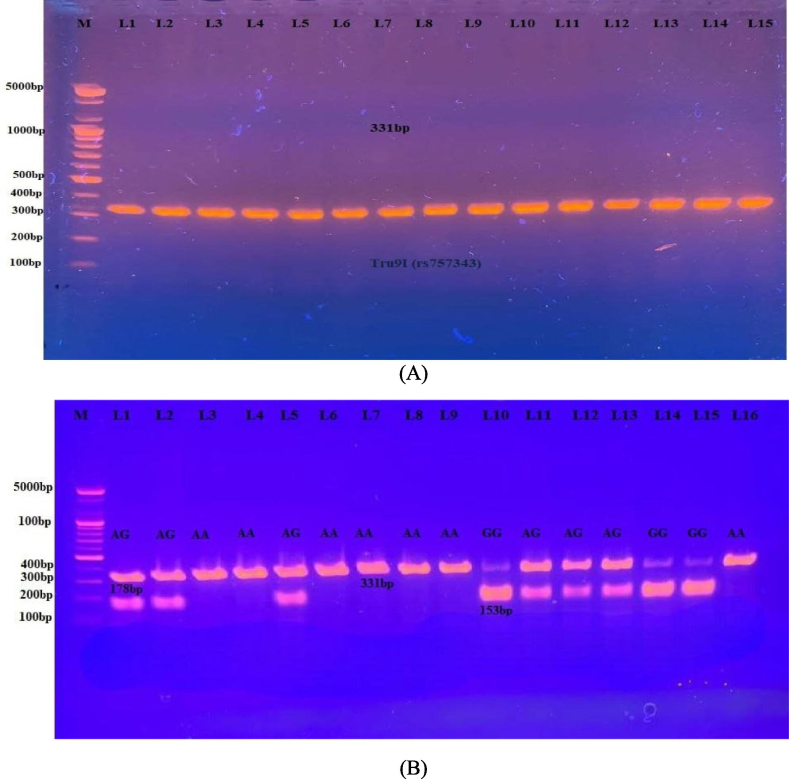
- A PCR results for the VDR gene (Tru9I, 331base pair). Fig. 3-B: Electrophoretogram of DNA segment for Tru9I variation after digestion with MesI. Homozygous wild A/A was present as a 331 bp. The homozygote mutant (G/G) was present at 178 and 153 bp. A heterozygous A/G was present as the 331, 178, and 153 bp.
There were significant differences in the distribution of genotypes and allele frequencies between the control group and the PCOS patients at which the prevalence of the homozygous AA genotype was 65 %, while in healthy women was 40 % (OR = 2.78; 95 % CI; 1.11–7.01), indicating a strong positive correlation. The significant genotype heterozygous AG was present in 23.75 % of PCOS patients and 56 % of the controls, showing a negative association with PCOS (OR = 0.2447; 95 % CI; 0.2447–7.0089). Furthermore, the frequency distributions of the homozygous GG genotyping in the PCOS patients and the control group were 11.25 % and 4 %, respectively with positive risk factors (OR = 3.0423; 95 % CI; 0.37–25.27). Moreover, the A allele demonstrated a positive correlation in PCOS women (OR = 1.56; 95 % CI; 0.78–3.15). Additionally, the distribution of Tru91 SNPs was significant under AA-dominant genetic models and high-risk factors among Iraqi women with PCOS (OR = 2.79; 95 % CI; 1.11–7.01) (Table 6).
| Genotypes | Frequency, n (%) | p-value | Odds ratio | CI95% | ||
|---|---|---|---|---|---|---|
| PCOS | Control | |||||
| AA | 52 (65 %) | 10(40 %) |
P = 0.15 X2 = 2.06 |
0.03 | 2.78 | 1.11–7.01 |
| AG | 19 (23.75 %) | 14(56 %) | 0.00 | 0.24 | 0.09––7.01 | |
| GG | 9(11.25 %) | 1(4 %) | 0.30 | 3.04 | 0.37–25.28 | |
| Alleles distribution | ||||||
| A | 123 (76.88 %) | 34 (68 %) | 0.21 | 1.57 | 0.78–3.15 | |
| G | 37 (23.13 %) | 16 (32 %) | 0.21 | 0.64 | 0.31–1.28 | |
| Genetic model | ||||||
| A/A | 52 (65 %) | 10 (40 %) | 0.03 | 2.78 | 1.11–7.01 | |
| A/G-G/G | 28 (35 %) | 15 (60 %) | ||||
| A/G- A/A | 71 (88.75 %) | 24 (30 %) | 0.30 | 0.33 | 0.04–2.73 | |
| G/G | 9 (11.3 %) | 1 (4 %) | ||||
The significant difference is at ≤ 0.05.
4 Discussion
The demographic data of the study patients and healthy individuals revealed that the age was not significantly different between the two study groups. These results were in agreement with the findings of a previous study conducted by (Ganie et al. 2020). The mean BMI ± SD of women with PCOS did not differ significantly from that of healthy controls. These results are consistent with those reported by (Dumesic et al. 2021), who suggested there were no significant differences in the mean BMI of PCOS women compared with that of the healthy control (P > 0.05). However, these results were in disagreement with another study that found a statistically significant difference in the BMIs of PCOS patients and their control group (P < 0.05) (Almukhtar and Almohaidi 2019). Additionally, this study found that those with PCOS had a notably higher occurrence of hirsutism (72.5 %) and acne (62.5 %). This is in comparison to a previous study by (Özdemir et al. 2010) Which reported that 53 % of patients with PCOS had acne and that hirsutism was prevalent in 73.9 % of patients. This could be attributed to hormonal abnormalities. In the current study, 92.5 % of women had irregular menstrual cycles, while 7.5 % had regular; however, all healthy individuals had regular menstrual cycles. Our study agreed with Iraqi research that revealed an obvious increase in irregular menstruation patterns in women with PCOS (78.8 %) compared with a control group (0.00 %) (Al-Quraishy et al. 2022). In addition, 44(55 %) were married and 36 (45 %) were single women in cases whereas 5(20 %) were married, 20(80 %) were single women in control. Out of 44 (55 %) married patients, 35 (79.5 %) had infertility disorders, whereas 9 (20.5 %) had normal fertility while the control group represented 5 (100 %) married women who had normal fertility (P < 0.05) as reflected in Table 2. Our study agreed with that of (Joham et al. 2015), who reported that women with PCOS were significantly more likely to be infertile (72 %, n = 224) than women without PCOS (16 %, n = 747) (p < 0.05) due to elevated ovarian androgen and LH to FSH ratios (Louwers and Laven 2020).
The results of vitamin D, free testosterone, and anti-Mullerian hormone analyses showed that PCOS patients had higher levels of free testosterone and anti-Mullerian hormone. Vitamin D deficiency (< 20 ng/mL) was significantly more common among PCOS patients. This result was in agreement with (Omran et al. 2020) while other studies in Iraq concluded that serum vitamin D3 levels in women who suffer from PCOS are significantly lower than those in the associated control groups (Quasi et al., 2022). On the other hand, other research revealed there is no link between low vitamin D levels and an increased risk of PCOS (Moini et al. 2015). A significantly low level of vitamin 25(OH)D3 in PCOS patients could potentially indicate that vitamin D plays a vital role in regulating estrogen production (Yang et al. 2023).
Our study revealed increased levels of free testosterone among women with PCOS. This finding was in agreement with the studies performed in Iraq (Abdalqader and Hussein 2020), who focused on the fact that increased free testosterone was significantly greater in PCOS patients than in the controls. In a cross-sectional study performed at Qatar University, 126 female students were subjected to hormonal analysis, demonstrating a significant increase in free testosterone (P-value < 0.0001) (Sharif et al. 2016). Our results revealed that women with PCOS had an AMH concentration > 4 ng/mL. A previous Iraqi study reported that serum AMH levels were elevated in PCOS patients compared with controls (P-value <0.05) (Alfatlawi 2017). A study in Saudi Arabia also demonstrated that the control and PCOS groups had significantly different AMH levels. The additional group revealed that AMH levels in the case group were twice as high as those in the healthy group (Moursi et al. 2023). When AMH production increases, follicles become less sensitive to FSH at the receptor level, which is crucial for their growth. This led to a subsequent rise in the number of antral follicles but a decrease in their size, leading to an increase in the number of small antral follicles (size 2–5 mm) (Kristensen et al. 2022). The PCR-RFLP study revealed that the most common genotype in PCOS women was the CT of Fok1 (rs2228510), which is heterozygous for the VDR gene. Furthermore, allele T has been identified as a risk factor in making women more likely to develop this condition, as based on the OR. Our results are in agreement with those of the Iraqi study in Karbala, demonstrating a statistically significant association between the Fok1 heterozygous genotype with a one-fold increase in the incidence of PCOS (OR = 2.04, 95 % CI; 2–4.2, P < 0.05) (Zahra and Altu’ma 2019). However, our results disagreed with those of a study in Poland that reported that there was no correlation between the distribution of FokI polymorphisms among PCOS patients and healthy individuals (Jedrzejuk et al. 2015). This suggests there may be other affecting factors such as genetic heterogeneity, environmental factors, or sample size. The PCR-RFLP of Apa1 (rs7975232) PCOS patients were more likely to have CC than the controls, and the OR was three-fold greater in PCOS patients than in the controls, whilst AC was more frequent in the controls than in the patients. Furthermore, the presence of allele C showed a positive correlation with PCOS according to the OR. In this research, we noted the impact of the homozygote CC genotype of the VDR gene SNP (rs7975232) in intron 8 on susceptibility to PCOS development amongst Iraqi women.
The genotyping according to the OR revealed that recessive CC homozygotes have greater risk factors for VDR gene polymorphisms as represented in Fig. 4. Our study was in agreement with an Iranian study (Mahmoudi 2009) which revealed that the VDR Apa-I AC genotype (Aa in the Iranian study) was linked to a lower risk of PCOS, while the CC genotype (aa in the Iranian study) was linked to a higher risk of PCOS. The ApaI polymorphisms are located in intron 8, specifically at the 3′ terminus of the VDR gene. The 3′ untranslated region (UTR) of genes plays a significant role in regulating gene expression, especially about mRNA stability (Fang et al. 2005). Among PCOS patients, the most prevalent genotype for the Tru91 variation in the VDR gene was AA GG. Additionally, allele A has been strongly implicated as a basic cause of the disease based on the observed OR. Regarding the OR, our study was somewhat in agreement with (Zadeh-Vakili et al. 2013), who found that the presence of the A allele is associated with a 74 % increase in risk of developing severe PCOS (OR, 1.74; 95 % CI; 1.07–2.82), whilst the combined genotype (GA + AA) was associated with the severity of clinical features of PCOS, including severe hirsutism and oligo-amenorrhea. However, our study disagreed with the literature about the association between the VDR Tru9I rs757343 (G > A) variant and susceptibility to PCOS. The study focused on populations of Asian descent, and indeed a further study conducted for Asian populations did not identify any significant association between the VDR Tru9I rs757343 (G > A) polymorphism and susceptibility to PCOS (Zadeh-Vakili et al. 2013).
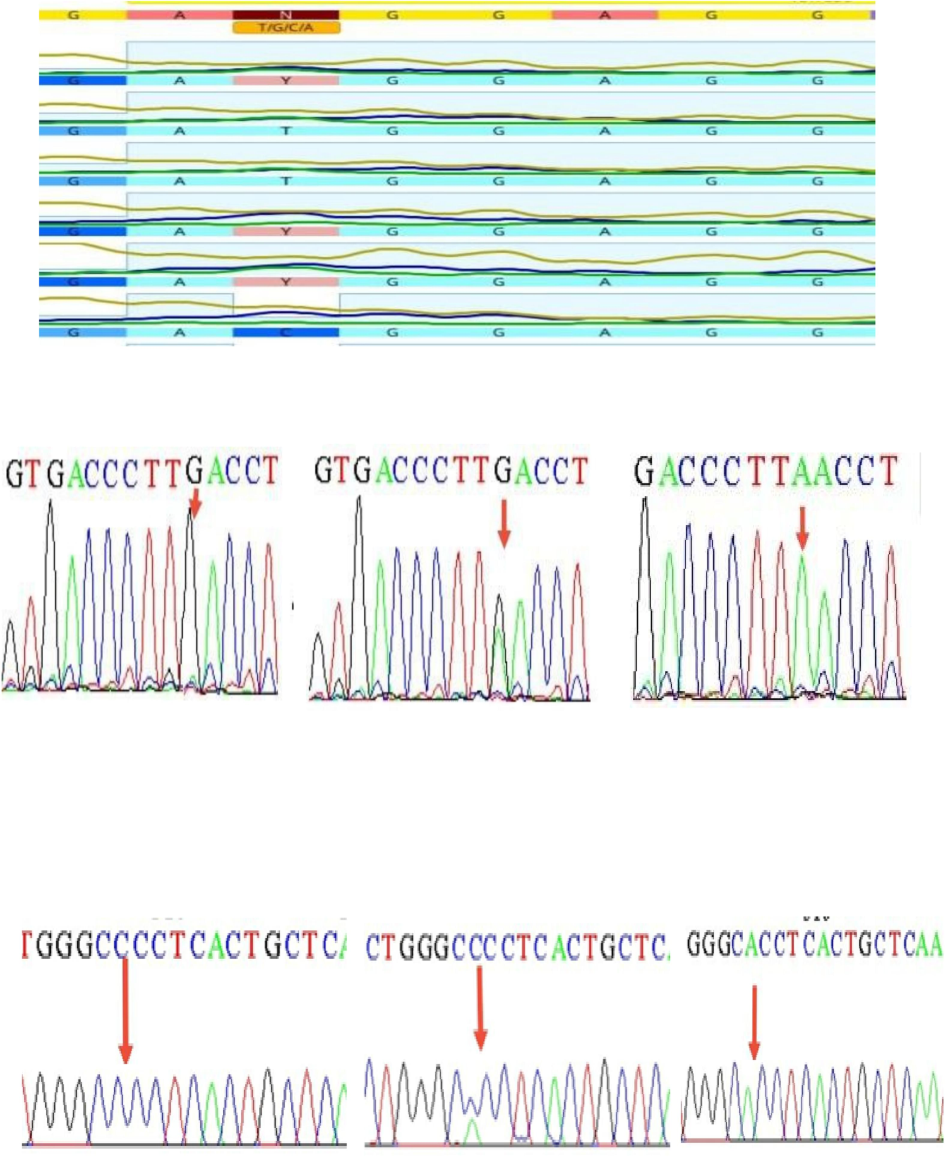
- DNA sequencing of Fok1 (CC, CT, and TT) in the upper section, Tru91 (GG, GA, and AA) in the middle, and Apa1 (CC, AC, and AA) in the lower portion.
The study concludes that increases in free testosterone and anti-Mullerian hormone levels, and decreases in vitamin D, are predictive of PCOS. Furthermore, this meta-analysis provides statistical evidence that VDR polymorphisms correlate with PCOS risk across all genetic models, including VDR FokI polymorphisms under the dominant model and VDR ApaI polymorphisms under the recessive model. VDR Tru91 is dominantly inherited. More research with a larger sample size and the examination of additional confounding variables is necessary to draw firm conclusions.
CRediT authorship contribution statement
Walaa Talal Abdul-Lateef: Writing – original draft, Methodology, Investigation, Formal analysis, Data curation. Mushtak T.S. Al-Ouqaili: Writing – review & editing, Supervision, Project administration, Investigation, Conceptualization. Rafal M. Murshid: Validation, Supervision, Project administration, Investigation.
Declaration of competing interest
The authors declare that they have no known competing financial interests or personal relationships that could have appeared to influence the work reported in this paper.
References
- Metastatin as a Marker for Hyperandrogenemia in Iraqi Women with Polycystic Ovary Syndrome. Obstet. Gynecol. Int.. 2020;2020:1-6.
- [Google Scholar]
- Study the Effect of Interleukin36 Gamma and AMH in Iraqi Women with PCOS. Al-Mustansiriyah Journal of Science. 2017;28(3):151-1116.
- [Google Scholar]
- Molecular Basis of Programmed Cell Death-1 Gene and Its Association with Encoding Protein Levels of Iraqi Women with Polycystic Ovarian Syndrome. HIV Nursing. 2022;22(2):653-669.
- [Google Scholar]
- Cloning and Expression of Full-Length CDNA Encoding Human Vitamin D Receptor. Proc. Natl. Acad. Sci.. 1988;85(10):3294-3328.
- [Google Scholar]
- Serum testosterone to androstenedione ratio predicts metabolic health in normal-weight polycystic ovary syndrome women. J. Endocr. Soc.. 2021;5(11):bvab158
- [Google Scholar]
- Promoter and 3′-untranslated-region haplotypes in the Vitamin D receptor gene predispose to osteoporotic fracture: The Rotterdam Study. Am. J. Hum. Genet.. 2005;77(5):807-823.
- [Google Scholar]
- Prevalence of polycystic ovary syndrome (PCOS) among reproductive age women from Kashmir Valley: A cross‐sectional study. Int. J. Gynecol. Obstet.. 2020;149(2):231-1226.
- [Google Scholar]
- Inter-Relationship between Polycystic Ovary Syndrome and Metabolic Syndrome. In: Metabolic Syndrome. Elsevier; 2024. p. :479-491.
- [Google Scholar]
- Hendi, N.N.A., 2023. Genome-Wide Association Study of Vitamin D Deficiency in the Middle East with a Relevant Characterization of the Novel SDR42E1 Gene.
- Increased body mass index is associated with a nondilutional reduction in antimüllerian hormone. J. Clin. Endocrinol. Metab.. 2020;105(10):3234-3242.
- [Google Scholar]
- Classic PCOS Phenotype Is Not Associated with Deficiency of Endogenous Vitamin D and VDR Gene Polymorphisms Rs731236 (TaqI), Rs7975232 (ApaI), Rs1544410 (BsmI), Rs10735810 (FokI): A Case-Control Study of Lower Silesian Women. Gynecol. Endocrinol.. 2015;31(12):976-999.
- [Google Scholar]
- Prevalence of infertility and use of fertility treatment in women with polycystic ovary syndrome: data from a large community-based cohort study. J. Women’s Health. 2015;24(4):299-307.
- [Google Scholar]
- In terms of the PCR-RFLP technique, genetic screening of Ala575Val inactivating mutation in patients with amenorrhea. Journal of Emergency Medicine, Trauma & Acute Care. 2022;2022(6):8.
- [Google Scholar]
- Intrafollicular concentrations of the oocyte-secreted factors GDF9 and BMP15 vary inversely in polycystic ovaries. J. Clin. Endocrinol. Metab.. 2022;107(8):e3374-e3383.
- [Google Scholar]
- The role of Vitamin D in metabolic disturbances in polycystic ovary syndrome: a systematic review. Eur. J. Endocrinol.. 2013;169(6):853-865.
- [Google Scholar]
- Characteristics of polycystic ovary syndrome throughout life. Therapeutic Advances in Reproductive Health. 2020;14:2633494120911038
- [Google Scholar]
- Vitamin D Status Alters Genes Involved in Ovarian Steroidogenesis in Muskrat Granulosa Cells. Biochimica et Biophysica Acta (BBA)-Molecular and Cell Biology of Lipids. 2024;159469
- [Google Scholar]
- Genetic variation in the Vitamin D receptor and polycystic ovary syndrome risk. Fertil. Steril.. 2009;92(4):1381-11133.
- [Google Scholar]
- The measurement of vitamin d metabolites: part I—metabolism of Vitamin D and the measurement of 25-Hydroxyvitamin D. Hormones. 2020;19(2):81-96.
- [Google Scholar]
- Association of SNP Rs. 2414096 CYP19 gene with polycystic ovarian syndrome in Iranian Women. International Journal of Reproductive BioMedicine. 2017;15(8):491.
- [Google Scholar]
- Comparison of 25-hydroxyvitamin D and calcium levels between polycystic ovarian syndrome and normal women. International Journal of Fertility & Sterility. 2015;9(1):1.
- [Google Scholar]
- The role of anti-mullerian hormone and other correlates in patients with polycystic ovary syndrome. Gynaecological Endocrinology. 2023;39(1):2247098
- [Google Scholar]
- Relation of Serum Vitamin D Level in Polycystic Ovarian Syndrome (PCOS) Patients to ICSI Outcome. Middle East Fertility Society Journal. 2020;25(1):1-8.
- [Google Scholar]
- Specific dermatologic features of the polycystic ovary syndrome and its association with biochemical markers of the metabolic syndrome and hyperandrogenism. Acta Obstet. Gynecol. Scand.. 2010;89(2):199-204.
- [Google Scholar]
- A review of animal models investigating the reproductive effects of gender-affirming hormone therapy. J. Clin. Med.. 2024;13(4):1183.
- [Google Scholar]
- The frequency of polycystic ovary syndrome in young reproductive females in Qatar. International journal of women’s health. 2016;1:1-10.
- [Google Scholar]
- Association of vitamin d receptor gene variants with polycystic ovary syndrome: a meta-analysis. BMC Med. Genet.. 2019;20:1-11.
- [Google Scholar]
- Role of Vitamins beyond Vitamin D 3 in bone health and osteoporosis. Int. J. Mol. Med.. 2024;53(1):1-21.
- [Google Scholar]
- Association of body weight with response to Vitamin D supplementation and metabolism. JAMA Netw. Open. 2023;6(1):e2250681-e.
- [Google Scholar]
- Association of Hypovitaminosis D with metabolic disturbances in polycystic ovary syndrome. Eur. J. Endocrinol.. 2009;161(4):575-582.
- [Google Scholar]
- Vitamin D3 promotes fish oocyte development by directly regulating gonadal steroid hormone synthesis. Biol. Reprod.. 2023;ioad176
- [Google Scholar]
- Genetic polymorphism of Vitamin D receptor gene affects the phenotype of PCOS. Gene. 2013;515(1):193-196.
- [Google Scholar]
Appendix A
Supplementary data
Supplementary data to this article can be found online at https://doi.org/10.1016/j.jksus.2024.103563.
Appendix A
Supplementary data
The following are the Supplementary data to this article:


