

Translate this page into:
Annealing effects on bio-fabricated nickel oxide nanoparticles for environmental remediation: Photocatalytic dye degradation and antimicrobial activity
⁎Corresponding author. rejojeice@gmail.com (Ambrose Rejo Jeice)
-
Received: ,
Accepted: ,
This article was originally published by Elsevier and was migrated to Scientific Scholar after the change of Publisher.
Abstract
Abstract
The work aims to generate highly active NiO nanoparticles (NPs) using a green method that uses Annona Reticulata leaf extract. This strategy affects the variance in annealing calefactions, hence mitigating the issue of aqua pollution. X-ray diffraction (XRD), UV–vis spectroscopy, Fourier transform infrared (FT-IR), Scanning electron microscopy (SEM), Energy dispersive X-ray (EDAX), TGDTA and adsorption–desorption isotherm are used to characterize produced NiO NPs. The phase structure as cubic of prepared specimens was observed to vary between 300 and 700 °C, according to the XRD pattern. From the UV–Vis absorbance spectra, bandgap determination of NiO NPs found in the 3.6–4 eV range. Nanoplatelets-shaped morphology with 43–47 nm particle size was determined using SEM snapshots. The destruction of organic contaminants, such as Crystal Violet (90.37 %) and Malachite green (93.33 %), was achieved in 120 min under UV light irradiation. To examine the zone of inhibition (ZOI) of the antimicrobial activity of green-produced NiO NPs against Serratia marcescens (19.2 mm), Bacillus cereus (19 mm), and Aspergillus niger (22.3 mm), experiments were conducted, and the efficiency was in the order of NiO(300 °C) > NiO(700 °C) > NiO(500 °C). There was strong photocatalytic degradation and antibacterial activity when the sample was calcined at 300 °C. Therefore, wastewater and biomedical treatment could potentially benefit from its use.
Keywords
Green precipitation
NiO NPs
Antimicrobial
Crystal violet
Photocatalytic activity

1 Introduction
Water treatment has been carried out by looking for the exclusion of dangerous organic dye molecules for the past few decades. Numerous processes have been started, including reverse osmosis, ozonolysis, ultrafiltration, generated charcoal adsorption, pre-chlorination, biodegradation, and photocatalytic deterioration. Subsequential photocatalysis has become more well-known in these studies as an eco-friendly means of combining different solar energy harvesting techniques to reduce the negative effects of textile wastewater on human health and the environment (Rajaram et al., 2023a; Ganesan et al., 2024). Today, one of the issues endangering the environment and public health is the manufacture of industrial, laboratory, and medicinal materials with potentially harmful chemicals and reagents. Therefore, the relevant scientific communities must introduce and expand synthesis methodologies based on green chemistry principles at factory and lab scales (Rajaram et al., 2023b; Athab et al., 2024; Vasan et al., 2024). Photoinduced activated radicals and contaminant molecules on the interface are known to engage in photocatalytic processes. The nanocomposites made of two or more semiconductors have advantages over monolithic photocatalysts in that their excellent light absorption, quick electron conductivity, reduced carrier recombination loss, and a shorter charge carrier diffusion path are characteristics of typical structures for photo-electrocatalytic applications (Sabouri et al., 2020; Suganthi et al., 2024). Researchers and scientists have been particularly interested in NiO among the several nanostructured metal oxides because of its basic technological uses. It is an antiferromagnetic (AFM) semiconductor with a wide band gap of 3.6–4.0 eV and a very high Néel temperature (523 K). AFM layers, gas sensors, lithium-ion batteries, and catalysis are only a few of its numerous uses (Al-Zaqri et al., 2022; Bhat et al., 2020; Divya et al., 2024;).
The emergence of new techniques to treat bacterial illnesses is due to the unfavorable side effects of multiple medication resistance. These days, nanoscale antibacterial substances and nanoscale transporters have been used since their development, antibiotics are useful in treating infectious infections in both animal and in vitro models. Since Endocrine-disrupting chemicals (EDCs) must be eliminated from sewage at water treatment plants prior to their final release into the environment, research attempts to counteract their harmful effects have increased dramatically in the last few decades. Serious research is required for the development of effective antimicrobial agents due to newly developing infections and the development of resistance against antibacterial therapy (Liang et al., 2019; Ghazal et al., 2021; Ali et al., 2022). For instance, it appears that plants are the most likely candidates to successfully implement this tactic when synthesizing NPs on a sufficiently large scale. Several methods have been established for the biological or biogenic synthesis of nanomaterials from the salts of various metal ions. The process of creating NPs under purely “green” principles can be accomplished by employing solvent systems that are compatible with the environment and that have stabilizing and reducing variables that are also ecologically beneficial. Compared to physicochemical approaches for synthesizing NPs, biological methods have garnered a lot of interest recently because they are essentially non-toxic, economical, and ecologically benign (Indumathi et al., 2023).
In this work, first time we synthesized the effect of annealing calefactions on NiO NPs using Annona reticulata (A. reticulata) leaf extract for photocatalytic anionic and cationic dye degradation and antimicrobial properties. Here, we discuss the influence of annealing temperature on structural, optical, and morphological changes in NiO NPs, and we examine how these changes affect the application of photocatalytic dye degradation [crystal violet (CV) and malachite green (MG)] and the antimicrobial activity of the gram-negative pathogen Serratia marcescens, the gram-positive microbe Bacillus cereus, and the fungus Aspergillus niger.
2 Experimental section
2.1 Materials
The precursor utilized was nickel (II) nitrate hexahydrate [(NiNO3)2·6H2O) 99 %] (AR Grade) from LOBA Chemie. The bio-reductants used in the process were A. reticulata leaves that were collected from the nearby area at Painkulam, India. Whatman filter paper (Grade No.1) was used for filtration, CV (C25N3H30Cl) and MG (C27H34N2O4S) are used as model pollutants. All of the chemicals utilized here, without the need for additional processing.
2.2 Preparation of A. reticulata leaf extract
The 25 g fresh A. reticulata leaves were properly cleaned, multiple times washed with tap water to eliminate any remaining moisture from their surface. After that, distilled water was used to wash it three times. Next, 100 mL of distilled water and chopped leaves were added to a borosil beaker. The combination was agitated at 80 °C for 60 min. The resultant product was allowed to cool naturally before being strained using Whatman No. 1 filter paper to get rid of any remaining contaminants.
2.3 Synthesis process
NiO NPs were produced by the co-precipitating method using 20 mL of filtered aliquot plant extract with a 0.1 M nickel (II) nitrate hexahydrate solution. For three hours, the blended mixture was circulated at 1000 rpm and 80 °C. The greenish precipitate that emerged during the formation of NiO provides indication of its formation. Then Whatman No.1 filter paper was used to filter the resulting green slurry, and following their collection and drying at 100 °C for 2 h, the obtained product was calcined at various temperatures like 300 °C, 500 °C and 700 °C then the precipitated NPs were employed for analysis.
2.4 Characterization of NPs
The produced NiO NPs were evaluated using surface, optical, and physical analysis. An X-ray diffractometer (XRD PANalytical X-ray diffractometer) was used to detect the structural property of NiO NPs. A Perkin Elmer Lambda − 35 spectrophotometer was used to examine the optical property. The NiO NPs Ni-O and OH bonding, as well as the involvement of biomolecules, were confirmed using FT-IR (8000 series, Shimadzu). Scanning electron microscopy (SEM- Carl Zeiss, Germany) was used in conjunction with material identification energy-dispersive X-ray spectroscopy (EDAX) to capture the surface properties. The Perkin Elmer Pyris Diamond TG/DTA was used to perform thermogravimetric analyses. Brunauer-Emmett-Teller (BET) (Bel, Japan, Inc., Microtec BELSORP MINI-II) was used to calculate the surface area, total pore volume, and mean pore diameter.
2.5 Antimicrobial activity
Using Serratia marcescens (ATCC 13880) and Bacillus cereus (ATCC 14579), the antibacterial activity of NiO NPs was examined using the disc diffusion method. After being introduced into the nutrient broth, the culture of bacteria (106 CFU/mL) was incubated for 12 h. Sterilized petri plates loaded with Muller-Hinton agar were wiped clean of the incubated culture. The well's 5 mm size was produced by the gel piercing technique. Synthetic NiO NPs at a concentration of 50 µg/mL were added to the well. Ultimately, the loaded dishes were allowed to incubate for an entire night, allowing them to show how each zone inhibits the development of bacteria. The zones developed during the incubation period, and their measurements are expressed in millimeters. The antifungal activity of Aspergillus niger (ATCC 16888) against NiO NPs was assessed using the same protocol.
3 Results and discussion
3.1 Phase structure
Fig. 1a displays the XRD spectra of the as-synthesised NiO NPs. The XRD examination indicates that the materials are crystalline as evidenced by the sharp and strong peaks. The hkl planes of the (2 2 2), (4 0 0), (4 4 0), (6 2 2), and (4 4 4) are related with the 2θ peaks of 36.9, 42, 62.5, 75.1 and 79.1° on the XRD spectra of NiO NPs. NiO NPs (JCPDS Card No. 89–5881) can be associated with these three samples. They have a cubic crystal structure with lattice parameters of a = 8.353 Å. The Debye-Scherer formula,
yields the average crystallite sizes of NiO (300 °C) NPs at 19.94 nm, NiO (500 °C) NPs at 21.73 nm and NiO (700 °C) NPs at 25.59 nm. Here, λ is the wavelength (i.e.,1.54 Å), β is the full width half maxima (FWHM), and θ is the Bragg's angle of diffraction (Yadav et al., 2022; Ahmad and Kaur ,2023).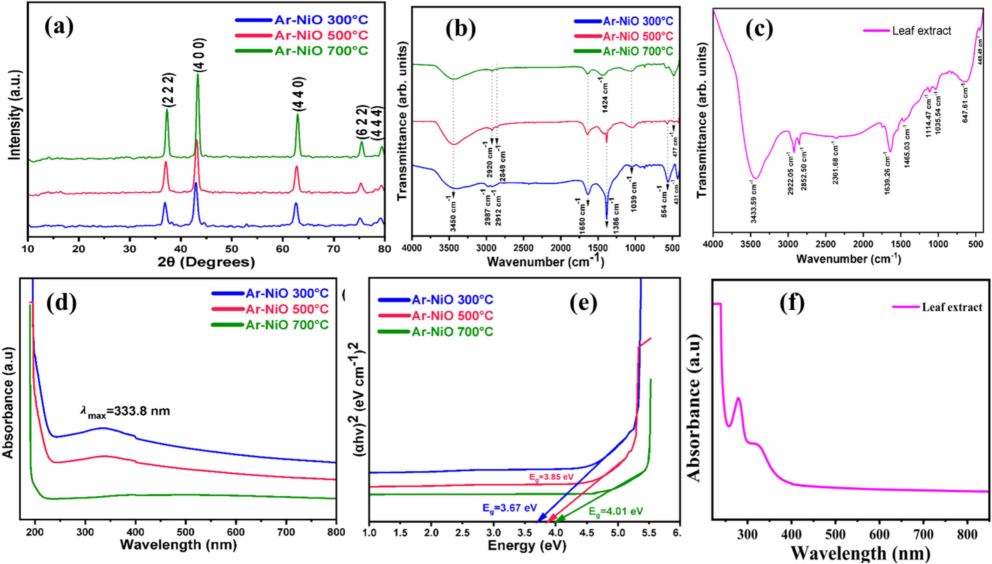
(a) XRD pattern, (b) FTIR spectra, (c) FTIR spectra of leaf extract, (d) UV–Visible absorbance spectra, (e) Tauc plot, (f) absorbance spectra of leaf extract.
The NiO NPs that were annealed at 700 °C show the greatest intensity and superior crystallographic orientations in contrast to the other annealed NPs. The FWHM was steadily declining as the annealing temperature rose. The drop in FWHM could perhaps be attributed to a rise in grain size caused by a growth mechanism driven by heat. Perhaps there is stress on the crystallographic plane causing this. Peak positions shift as the calcination temperature rises from 300 to 700 °C, indicating increased lattice deformation. This is distinctly observed in the red shift from peak locations 42° at 300 °C to 43.4° at 700 °C during the annealing process.
3.2 Functional group analysis
Fig. 1(b) displays the FTIR spectra of NiO NPs and Fig. 1(c) exhibits the leaf extract of A. reticulata. The identified primary peaks are shown to lie within the following ranges, in that order: 431–554 cm−1, 1039 cm−1, 1386–1650 cm−1, 2849–2987 cm−1, and 3450 cm−1. The hydroxyl group O–H stretching vibration at 3450 cm−1 and the asymmetric and symmetric stretching vibrations of the C–H bond is responsible for values of and 2853, 2912, 2920, and 2987 cm−1 (Barzinjy et al., 2020). A. reticulata was discovered to have a distinctive peak at 1039 cm−1, which represents the C–O stretching vibration. The fingerprint region exhibits a broad, dense band presence between 431, 477, and 554 cm−1, the appearance of the stretching modes for Ni–O bridging (Sabouri et al., 2020). The broad band from 3433.59 cm−1 corresponds to the stretching of the O–H (hydroxyl) group of the absorbed water in the case of A. reticulata leaf extract, while another peak at 2922.05 cm−1 is caused by the CH stretching for methyl or methylene groups in the group of strong peaks. The bending vibrations of the hydroxide (–OH) groups are shown by the peak at 1639.26 cm-1and the C-O stretching vibration appeared at 1114.47 cm−1.
3.3 Optical properties
The absorption spectra of the produced nanostructures NiO (300 °C, 500 °C and 700 °C) are shown in Fig. 1d. About NiO (700 °C), the lengthy tail was seen in the longer wavelength area, and the low-intensity peak was found at 268 nm. There are prominent absorption peaks in the sample NiO (300 °C and 500 °C), located at 333.8 nm. A prominent absorption peak in the region has been verified, indicating that the produced samples have formed NiO NPs. In the Fig. 1f the maximum absorption peak in the leaf extract was obtained at 281 nm. The optical direct band gap (Eg) of the produced NPs was calculated using a Tauc-plot. The equation for the Tauc-plot is, In this formula, hν represents the photon's energy, m = 1/2 for the direct transitions, α stands for the absorbance coefficient, and A is the energy-independent constant (Jeice, 2023). To determine the optical characteristics Eg of nanostructures, Fig. 1e plots the relationship between (αhν)2 and photon energy hν. The energy band gaps (Eg) for the produced samples NiO (300 °C, 500 °C and 700 °C) are 3.67, 3.85, and 4.01 eV, respectively. Due to the phase change and lack of inadequacies in all cubic NiO, the Eg value found in NiO (700 °C) is substantially higher than that of others.
3.4 SEM with EDAX
SEM images of samples NiO (300 °C, 500 °C and 700 °C) are depicted in Fig. 2(a–c). The SEM images of the NiO NPs synthesized using A. reticulata, have an irregular platelet-like shape as a result of “Ostwald ripening” and “intraparticle ripening” (Aminuzzaman et al., 2021). It depicts the imperfect platelet growth brought on by extreme fluctuations in the lattice parameter. The average particle size was estimated in the range of 43 nm, 47 nm, and 56 nm for NiO (300 °C, 500 °C and 700 °C), respectively. EDAX (Fig. 2g–i) was used to determine the elemental composition of NiO nanostructures. The elements oxygen (O) and nickel (Ni) are present in the produced samples, as these spectra demonstrate. In the range between “0.9″ and ”0.5″ keV, Ni and O prominent peaks were visible in the spectra. Here, the absence of unknown components in the spectrum is confirmed, indicating the purity of the processed samples. The atomic and weight percentage ratios of Ni and O in the as-synthesized specimens were provided in Table 1. This illustrates the stoichiometry ratio that is rich in oxygen and the dominance of oxygen over nickel. High crystallinity in the synthesized NiO nanoparticles was seen in the HR-TEM image Fig. 2(d-f). Here, the NiO particles are dispersed evenly and exhibit minimal aggregation. The HR-TEM investigation validated the platelet-like structure with the estimated average particle sizes were 46 nm, 52 nm, and 67 nm, respectively.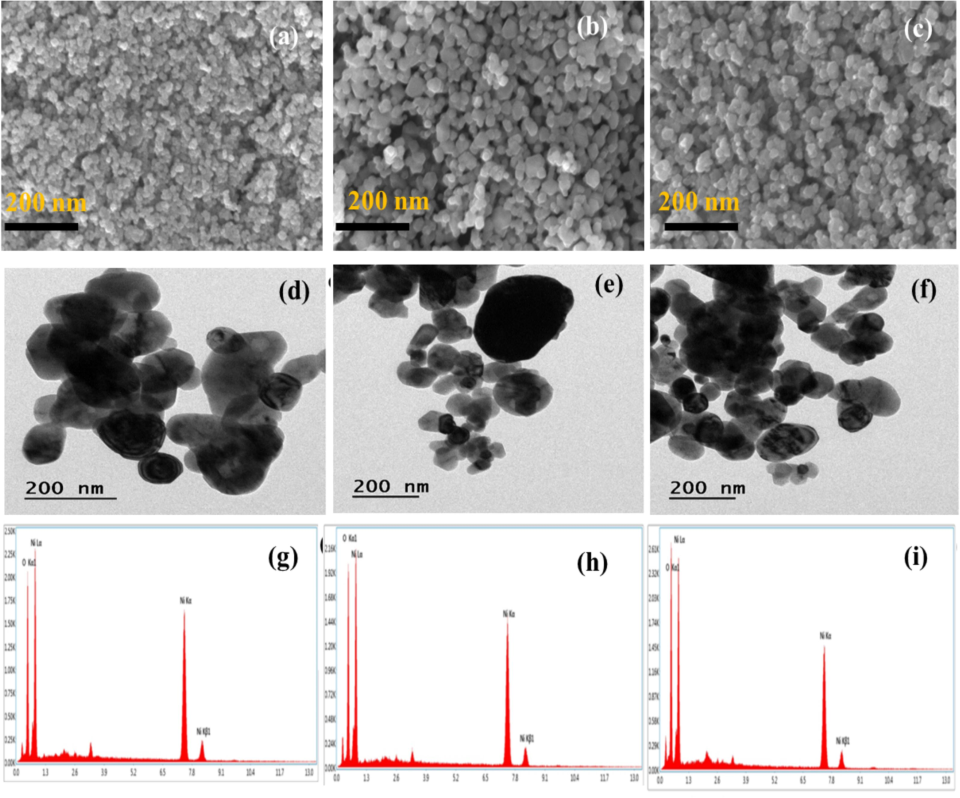
(a-c) SEM images, (d-f) HR-TEM images, (g-i) EDAX spectrum of NiO NPs.
Element
NiO (300 °C)
NiO (500 °C)
NiO (700 °C)
Weight (%)
Atomic (%)
Weight (%)
Atomic (%)
Weight (%)
Atomic (%)
O
28
58.8
21.6
50.2
23
52.3
Ni
72
41.2
78.4
49.8
77
47.7
3.5 BET surface area and BJH pore size
To verify the nanostructural properties and specific surface area of the produced Ar-NiO (300 °C) NPs, additional measurements of the adsorption–desorption isotherms were made. Fig. 3a illustrates the typical hysteresis loop caused by N2 capillary condensation. A typical type-IV curve for mesoporous materials was displayed by the prepared NPs. The existence of mesopores in the initial stage of the isotherm indicates multilayer adsorption, and capillary condensation is the cause of the hysteresis. 14.0812 m2/g was determined to be the appropriate BET specific surface area. With a typical pore radius of 12.2838 nm and a pore volume of 0.078546 cc/g, the Ar-NiO (300 °C) NPs were shown to be nanoporous using the BJH method. The capacity to absorb dye gets better as the consequence. Fig. 3b displays the equivalent pore size distribution curve of prepared Ar-NiO (300 °C) NPs.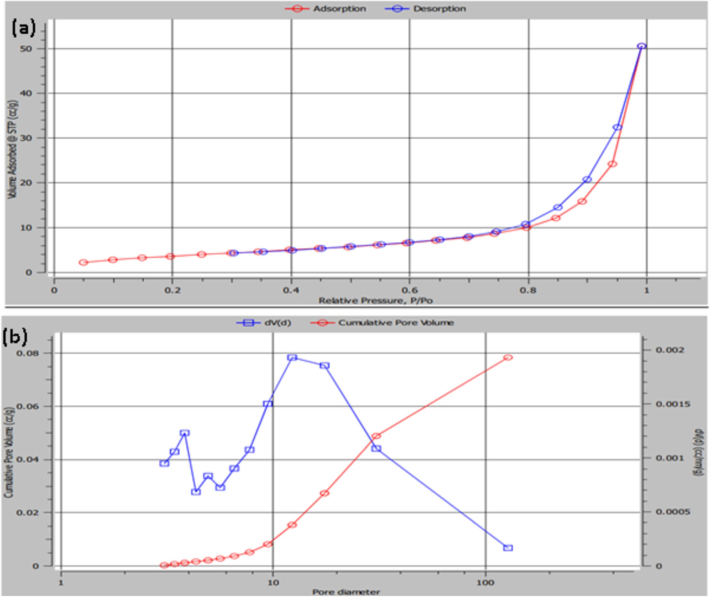
BET isotherm plot; (a) N2 adsorption desorption of Ar-NiO NPs prepared 300 °C and (b) BJH pore size distribution curve of Ar-NiO NPs (300 °C) calculated from desorption branch.
3.6 TGA-DTA analysis
Fig. 4 exhibits the TGA and DTA curves for the nickel oxide (300 °C). The TGA curve (a) at 50 °C (1), 650 °C (2), and 750 °C (3) shows three weight losses. A distinct DTA peak (b) coincides with the weight loss 650 °C and 750 °C. Water is absorbed, where for the small weight loss (1) at 50 °C and adsorbents or impurities of NiO are thought to be responsible for the second weight loss phase (2) at 650 °C. it was linked to the formation of flaws in the NiO powder that the weight loss occurs at 750 °C (3, broad peak at DTA). The loss of oxygen linked to these faults promotes the production of oxygen vacancies. The thermal breakdown of Ni(OH)2 to produce NiO particles is the cause of the weight loss.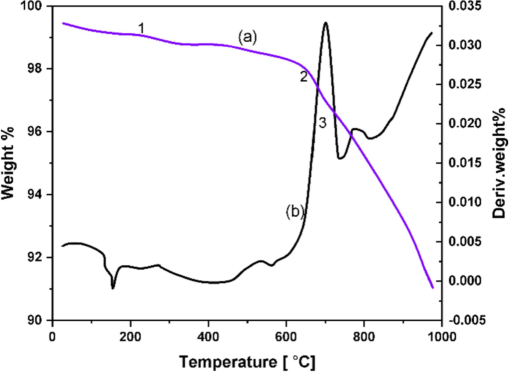
TG-DTA curves of NiO NPs (300 °C).
3.7 Antimicrobial assay
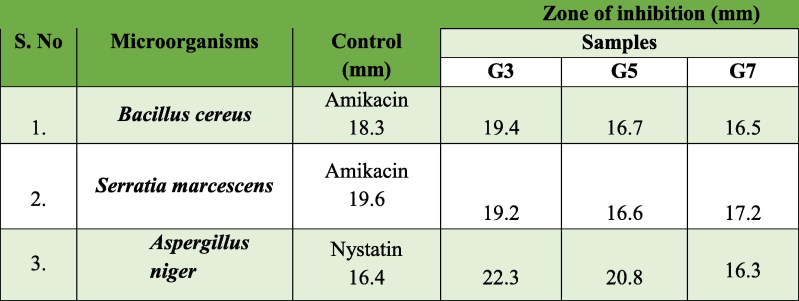
The Kirby-Bauer disc diffusion method was used to assess the antimicrobial activity of NiO NPs. The aforementioned approach was used for the microbe Serratia marcescens, Bacillus cereus, and Aspergillus niger. These microbiological pathogens produce bacteremia, sepsis, urinary tract infections, bone infections, and black mold because they are poisonous to living things. We therefore choose to assess these three microbes. Fig. 5(a–c) shows the antibacterial activity of the produced samples NiO NPs. Due to the existence of NiO NPs, their arrangement within the cell walls of the pathogens, and the disagreement in their chemical structure, the ZOI was raised for NiO (300 °C) > NiO (700 °C) > NiO (500 °C) with an efficacy higher than that of common antibiotic Amikacin and anti-fungal Nystatin. This shows that the growth of specific microbiological strains can be inhibited by produced NiO NPs, and the resultant ZOI is noted in Table 2. NiO resistance or susceptibility can vary throughout fungal and bacterial strains, as can the pathways of metabolism and enzyme systems. NiO's higher activity in fungi as opposed to bacterial strains can be explained by variations in the two species' metabolic capacities, surface contacts, preferred environments, genetic makeup, and experimental techniques. The capacity to produce large amounts of reactive oxygen species (ROS), such as hydrogen peroxide (H2O2), superoxide radicals (
, and hydroxyl radicals (ȮH), on the surface of the produced NPs. Insufficient oxygen vacancies cause (H2O2) to develop. The ROS produced by the pathogen caused the cell damage. The process of interconnection leads to the membrane damage (or restraint) of the strain's augmentation because it breaks the protein's molecular structure, depletes ATP, and damages the cell membrane (Rajaram et al., 2023c). Compared to spherical NPs, their flat surface could allow for stronger interactions and closer contact with microbial cell membranes. Through more effective disruption of the cell membrane caused by this tight connection, the antibacterial activity is increased. The bar diagram of the antimicrobial activity is depicted in Fig. 5d.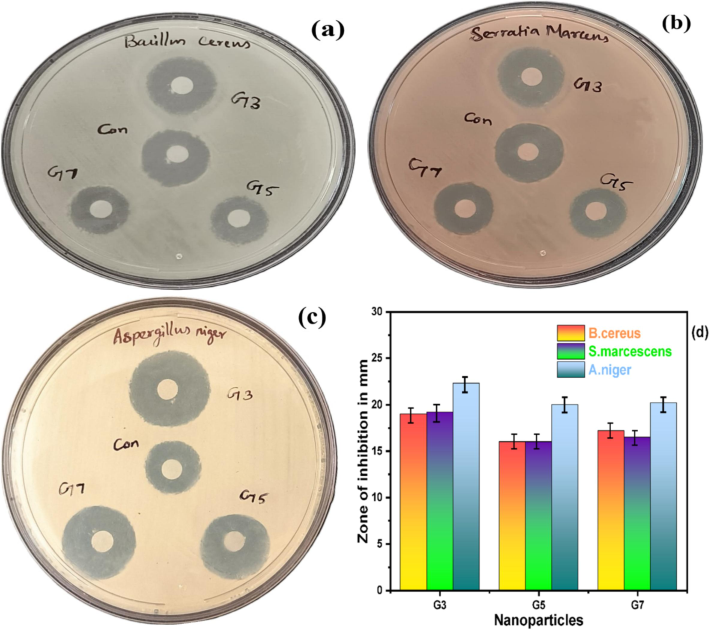
(a-c) Antimicrobial activity of Bacillus cereus, Serratia marcescens, and Aspergillus niger (d)Antimicrobial efficiency bar graph of NiO NPs.
3.8 Process of photocatalytic activity
The photocatalysis experiment was then carried out in a UV–vis light-irradiated environment. To investigate the photocatalytic dye degradation of prepared NiO NPs in fresh A. reticulata aqueous media, 30 ppm of CV and MG solution was made separately, to which 10 mg of NiO NPs was added. The mixture was then spun for 30 min while the solution was left in the dark. The spectra were used to track absorption for CV and MG dyes at 0 min at the maximum wavelengths (λ) of 586 nm and 495 nm Fig. 6 (g-h). The breakdown of the dye happened in 120 min after the catalyst was added and exposed to light irradiation. The dye degradation percentage
, where
and
represents initial absorption radiation and absorption radiation of dyes at time t after dye degradation at significant period (Jana and Chatterjee, 2023). It compares the concentration of the suspension at various intervals of illumination to its concentration prior to illumination at time 0. This graph indicates that the process has pseudo-first-order kinetics
, where Ct is the absorbance of dyes after decomposition at time t, C0 is the initial absorbance of dyes and Kapp is the apparent first-order rate constant (Wehbi et al., 2023). Absorption spectra [Fig. 6(a-f)] show that the degradation efficiencies of CV for NiO (300 °C, 500 °C and 700 °C) are 90.37 %, 87.41 %, and 85.19 %, respectively and MG for NiO (300 °C, 500 °C and 700 °C) are 93.33 %, 91.11 %, and 87.41 %, respectively. Sample 300 °C as synthesized, shows highly eliminated dye molecules. Because the reduced average crystalline size of 300 ℃ NPs leads to superior results compared to other samples. The smaller crystalline NPs have a larger surface area, they can easily penetrate pathogen cell walls and produce more ROS species, also degrading dye molecules quickly. A smaller NPs's stability and long-term performance may be affected by surface oxidation or aggregation, even though smaller NPs typically possess greater surface energy and reactivity. The effective surface area of the particles and the way that NPs form are important factors that can enhance photocatalytic activity. Larger effective surface areas result in increased photocatalytic efficiencies and can enhance reactant absorption (Sabouri et al., 2021). Furthermore, less energy is likely required for the excitation of electrons from the valance band (VB) to the conduction band (CB) in the semiconductor band gap when UV–Vis light collides with photocatalyst NPs. To further excite the electrons in the valence band, it has the capacity to produce more photons. Induced electrons can either directly or indirectly form radical hydroxides, and this electron excitation results in an identical number of holes in the valance band. This occurs as a result of hydroxide ions (OH–) being absorbed into Ni2+ surfaces. Consequently, the loss of an electron causes the hydroxide ions to change into hydroxyl radicals (ȮH). Radicals have the potential to change organic materials into minerals, thus in order to attain more sustainability, radical organic compounds must be destroyed, which is why the anionic CV and cationic MG dyes must be destroyed by this procedure. When electrons are lost from these organic compounds, they break down into CO2 and H2O, which then return to the atmosphere. Results show that the anionic (CV) dye degradation kinetics (Kapp) of NiO (300 °C, 500 °C and 700 °C) were found to be 0.0196 min−1, 0.0176 min−1and 0.0165 min−1 and the relative values 0.0234 min−1 NiO (300 °C), 0.0209 min−1 NiO (500 °C), and 0.0187 min−1 NiO (700 °C) were determined to represent the (Kapp) of the cationic (MG) photocatalytic process.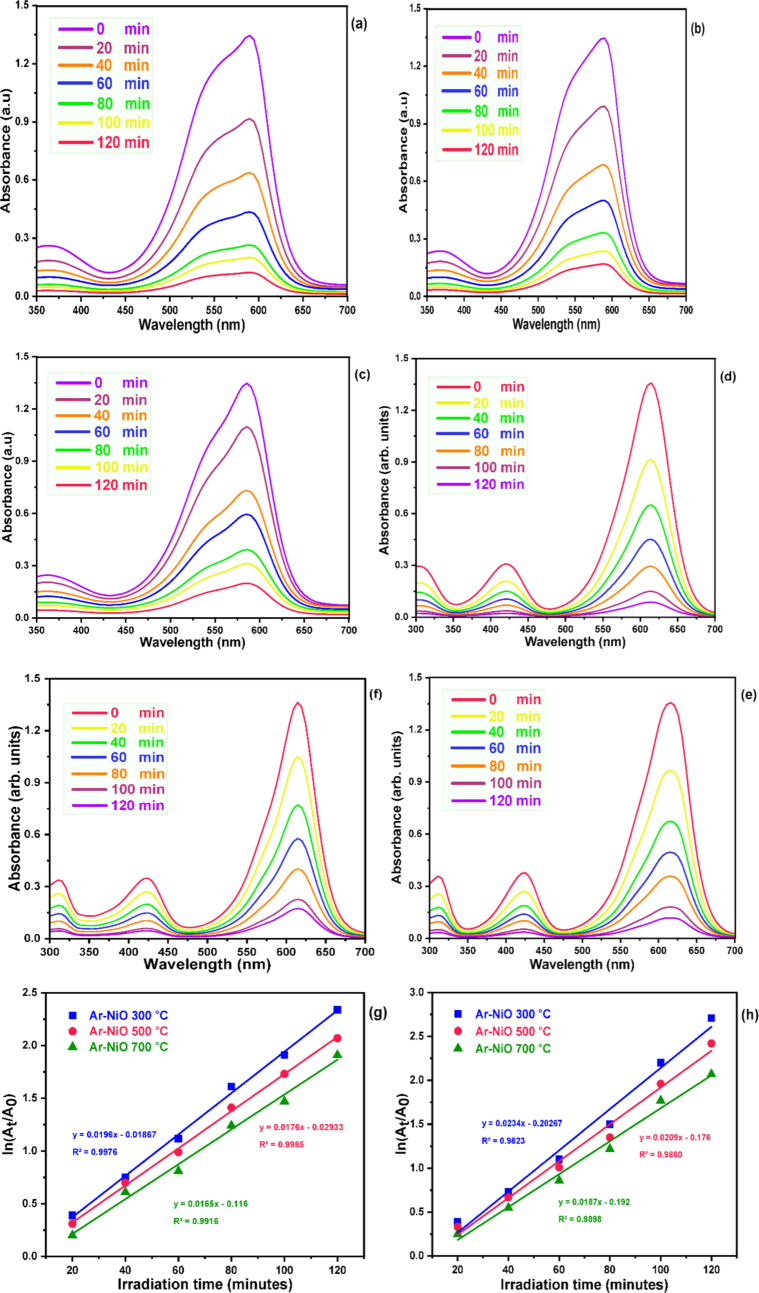
Photocatalytic degradation curves and linear plots of (a-c, g) CV and (d-f, h) MG dyes of NiO NPs as photocatalysts.
3.9 Mechanism of dye degradation
The different production conditions, crystallite size, and morphological characteristics of NiO NPs are primarily linked to their photocatalytic behavior. Imperfections, vacancies, and edges on the surface can act as catalysts for catalytic reactions. These flaws can aid in the adsorption of dye molecules and encourage the production of reactive species (such as hydroxyl radicals) when exposed to light in the setting of photocatalysis for dye degradation. By speeding up the breakdown of dye, this increases the photocatalytic process' efficiency. The concentration of surface imperfections in this mechanism also modifies the reunite rate of photo-engendered electron/hole pairs by catching electrons. The oxidation and reduction of organic micropollutants, or pollutants made more potent by the hydroxyl and superoxide radicals produced when light enters a space (Priya and Jeyajothi 2019). The mechanism of photocatalytic degradation over the NiO nanocatalysts is shown in Fig. 7 Consequently, it has been demonstrated that oxygen vacancies support the photocatalytic capability and follow a plausible mechanism: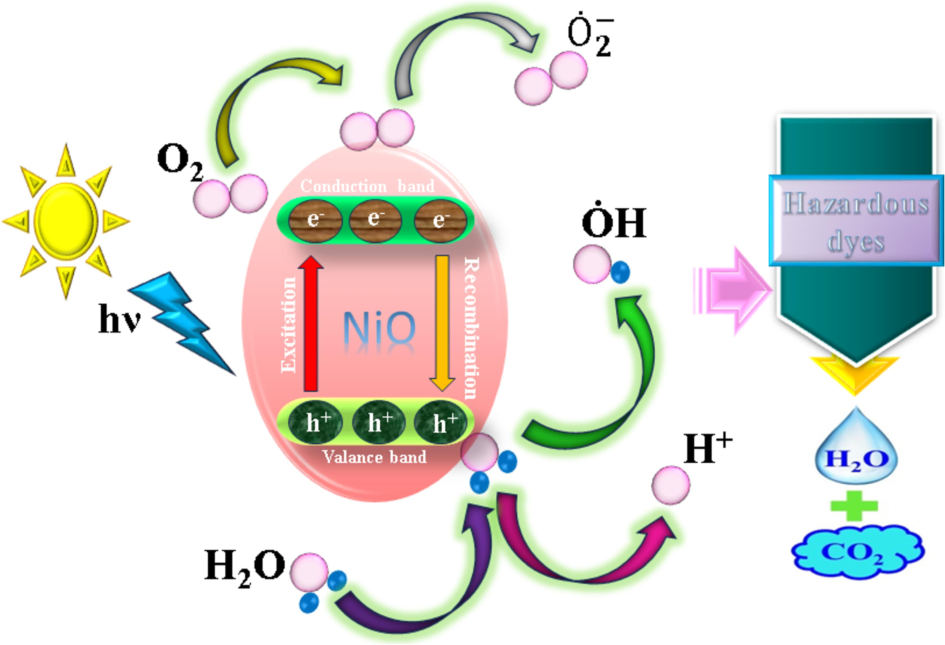
Schematic diagram of the plausible mechanism of dye degradation over the NiO nano-catalyst.
hν (vis) + NiO → NiO (e- CB) + NiO (h+ VB
Organic molecules (dye) + h+ VB → products of oxidation
Organic molecules (dye) + e- CB → products of reduction
+ O2 →.
+ H2O2 → ȮH + + O2
O2 + 2 (NiO. CB) + 2H2O → 2 + H2O2
h+ (NiO. VB) + H2O → H+ + ȮH
or ȮH (Radicals) + hazardous dyes → products of degradation (CO2 + H2O)
3.10 Photocatalyst recyclability
Recyclability and reusability are two extremely essential characteristics of dealing with photocatalytic and imperishable energy (Rajaram et al., 2023d). It is always essential that the photocatalyst be cyclically stable and reusable. Following the completion of the initial photocatalytic evaluation, the sample was separated from the previous CV and MG solutions using centrifugation at 10,000 rpm for 15 min. It was then repeatedly squeezed in deionized water to be washed, then dried for two hours in an oven set to 100 °C and stored for the subsequent cycle (Rajaram et al., 2024). Fig. 8 illustrates the stability of NiO nano-photocatalyst for a period of five cycles. After every cycle, the nano-photocatalyst was distributed, cleaned, and reused in the subsequent cycle after being removed from the dye solution by centrifugation. Every cycle had a 120-minute light exposure period, while all other experimental settings showed no significant changes following these cycles. After five cycles NiO nano-photocatalyst demonstrated, high stability.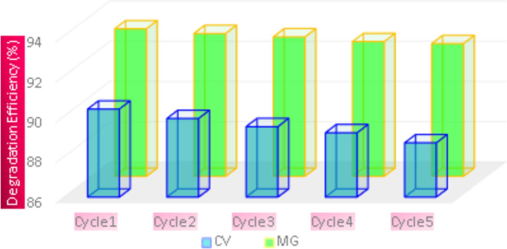
CV and MG dyes photocatalytic reduction for five cycles with cyclic stability of photocatalyst under UV–vis radiation.
4 Conclusion
Tuning annealing parameters to enhance NiO NPs successfully synthesized with A. reticulata leaf extract. XRD and SEM studies indicated cubic structure and morphology in nanoplatelets. FT-IR spectra exhibited evidence of the efficient interaction between metal and oxygen bonding in plant biomolecules. Optical flaws and electron accumulation of NiO NPs were determined using UV–vis spectra with the optical band gap energy (3.6 to 4 eV). The value of the relevant BET specific surface area was found to be 14.0812 m2/g. The Ar-NiO (300 °C) NPs had a pore volume of 0.078546 cc/g and a typical pore radius of 12.2838 nm. When the produced NiO NPs were tested against Aspergillus niger, Bacillus cereus, and Serratia marcescens, the results indicated that 300 °C had the highest antibacterial activity. Additionally, the sample demonstrated a notable improvement in the removal effectiveness 90.37 % and 93.33 % for CV and MG. The photocatalysts were efficient reusable for up to five cycles and easily separable, making them effective adsorbents as well. The synthetic NiO NPs are suited for wastewater and biomedical applications.
CRediT authorship contribution statement
Monisha Ganesan: Methodology, Investigation, Writing – original draft. Ambrose Rejo Jeice: Writing – review & editing, Writing – original draft, Supervision, Conceptualization. Prammitha Rajaram: Writing – original draft, Writing – review & editing, Formal analysis, Data curation.
Acknowledgements
One of the author Monisha Ganesan (Research Scholar Reg No. 20213012132017) like to thank Research Department of Physics, Annai Velankanni College, Tholayavattam, Kanyakumari District, Tamil Nadu, India for providing Research Facilities.
Declaration of competing interest
The authors declare that they have no known competing financial interests or personal relationships that could have appeared to influence the work reported in this paper.
References
- Microwave-assisted single step green synthesis of NiO nanoparticles using Coleus scutellariodes leaf extract for the photocatalytic degradation of rufloxacin. MRS Adv.. 2023;8:835-842.
- [CrossRef] [Google Scholar]
- Green nickel/nickel oxide nanoparticles for prospective antibacterial and environmental remediation applications. Ceram. Int.. 2022;48:8331-8340.
- [CrossRef] [Google Scholar]
- Green synthesis of nickel oxide nanoparticles and its photocatalytic degradation and antibacterial activity. J. Mater. Sci.: Mater. Electron.. 2022;33:11864-11880.
- [CrossRef] [Google Scholar]
- Biosynthesis of NiO nanoparticles using soursop (Annona muricata L.) fruit peel green waste and their photocatalytic performance on crystal violet dye. J. Clust. Sci.. 2021;32:949-958.
- [CrossRef] [Google Scholar]
- Comparison activity of pure and chromium-doped nickel oxide nanoparticles for the selective removal of dyes from water. Sci. Rep. 2024;14:4032-4047.
- [CrossRef] [Google Scholar]
- Green and eco-friendly synthesis of Nickel oxide nanoparticles and its photocatalytic activity for methyl orange degradation. J. Mater. Sci.: Mater. Electron.. 2020;31:11303-11316.
- [CrossRef] [Google Scholar]
- Photocatalytic degradation of carcinogenic Congo red dye in aqueous solution, antioxidant activity and bactericidal effect of NiO nanoparticles. J. Iran. Chem. Soc.. 2020;17:215-227.
- [CrossRef] [Google Scholar]
- Biosynthesis of La/NiO Nanoparticles: Study of Photocatalytic Degradation of Anionic and Cationic Dye, and Their Antibacterial Activity. Iran. J. Med. Sci.. 2024;48:553-574.
- [CrossRef] [Google Scholar]
- Biosynthesis of NiO nanoparticles using Senna occidentalis leaves extract: Effects of annealing temperature and antibacterial activity. Measurement: Energy; 2024. p. :100023-100030.
- Green synthesis of copper-doped nickel oxide nanoparticles using okra plant extract for the evaluation of their cytotoxicity and photocatalytic properties. Ceram. Int.. 2021;47:27165-27176.
- [CrossRef] [Google Scholar]
- Phytoextract-mediated synthesis of Cu doped NiO nanoparticle using cullon tomentosum plant extract with efficient antibacterial and anticancer property. Ceram. Int.. 2023;49:31829-31838.
- [CrossRef] [Google Scholar]
- Hybrid nanostructures exhibiting both photocatalytic and antibacterial activity—a review. Environ. Sci. Pollut. Res.. 2023;30:95215-95249.
- [CrossRef] [Google Scholar]
- Photocatalytic activity of green fabricated CuO bionanoparticles using Tridax procumbens leaves extracted in divergent medium with antimicrobial facets. Biomass Convers. Biorefin.. 2023;1–17
- [CrossRef] [Google Scholar]
- Fabrication of p-NiO nanoparticles/n-TiO2 nanospheres photocatalysts and their photocatalytic performance for degradation of Rh B. J. Nanoparticle Res.. 2019;21:1-12.
- [CrossRef] [Google Scholar]
- In vitro cytotoxic effect of spikenard herbal immobilized polymer nano‐biocomposites: Toward bioinspired antimicrobial agent. Polym. Compos.. 2019;40:2301-2310.
- [CrossRef] [Google Scholar]
- Review of green synthesized TiO2 NPs for diverse applications. Surf. Interfaces.. 2023;39:102912-102928.
- [CrossRef] [Google Scholar]
- Influences of calcination temperature on titanium dioxide nanoparticles synthesized using Averrhoa carambola leaf extract: in vitro antimicrobial activity and UV-light catalyzed degradation of textile wastewater. Biomass Convers. Biorefin.. 2023;1–14
- [CrossRef] [Google Scholar]
- Green synthesis of orthorhombic Mn2O3 nanoparticles; influence of the oxygen vacancies on antimicrobial activity and cationic dye degradation. New J Chem.. 2023;47:17734-17745.
- [CrossRef] [Google Scholar]
- Synthesis of Cd(OH)2-CdO nanoparticles using veldt grape leaf extract: enhanced dye degradation and microbial resistance. BioNanoScience. 2023;13:1289-1307.
- [CrossRef] [Google Scholar]
- Comparative analysis of the antimicrobial activity and dye degradation of metal oxides (TiO2, CdO, Mn2O3, and ZnO) nanoparticles using a green approach. Environmental Geochemistry and Health. 2024;46(12):498-521.
- [Google Scholar]
- Egg white-mediated green synthesis of NiO nanoparticles and study of their cytotoxicity and photocatalytic activity. Polyhedron. 2020;178:114351
- [CrossRef] [Google Scholar]
- Green synthesis of nickel oxide nanoparticles using Salvia hispanica L.(chia) seeds extract and studies of their photocatalytic activity and cytotoxicity effects. Bioproc. Biosyst. Eng.. 2021;44:2407-2415.
- [CrossRef] [Google Scholar]
- Construction of efficient MoS2 decorated g-C3N4 nanocomposite for synergistic effect towards enhanced photocatalytic degradation of hazardous dye-based emerging pollutants. Mater. Sci. Eng. b.. 2024;307:117535-117548.
- [CrossRef] [Google Scholar]
- Photocatalytic investigations of biogenic α-MoO3 nanorods influences of the leaves extracted in a divergent medium of Rhinacanthus nasutus against triple count of cationic dyes and antimicrobial activity. J. Mol. Struct.. 2024;1306:137800-137812.
- [CrossRef] [Google Scholar]
- Investigation of the structural and the physical properties of ZnO–NiO–Mn2O3 nanocomposites for photocatalytic applications. Appl. Phys. A. 2023;129:390.
- [CrossRef] [Google Scholar]
- Nontoxic in vivo clearable nanoparticle clusters for theranostic applications. ACS Biomater Sci Eng. 2022;8:2053-2065.
- [CrossRef] [Google Scholar]


