

Translate this page into:
Functional genomics analysis of Leptin-Melanocortin system genes reveals candidate genes associated rapid growth and high carcass yield in sheep
⁎Corresponding authors. shishaygirmay@su.edu.et (Shishay Girmay), ishfaq.ahmad@iub.edu.pk (Hafiz Ishfaq Ahmad)
-
Received: ,
Accepted: ,
This article was originally published by Elsevier and was migrated to Scientific Scholar after the change of Publisher.
Peer review under responsibility of King Saud University.
Abstract
The Leptin-Melanocortin System (LMS) is an important regulatory system involved in appetite and energy balance in many organisms, including sheep. Functional genomics analysis of LMS genes can provide insights into the genetic factors that influence rapid growth and high carcass yield in sheep. However, the genetic potential of sheep growth and reproduction has not been fully exploited. Therefore, identifying genes that regulate growth and reproduction would offer strategies for improving the yield and quality of sheep meat. In this study, to explore the possible molecular mechanisms underlying rapid growth and muscular high-yield carcass in sheep, we screened 14 genes, which were previously claimed to be associated with such traits in humans and rodents. The FST outlier approach implemented in LOSITAN detected the loci under selection. These candidate genes were connected to complicated biological processes, including the regulation of eating behavior, energy balance, and the positive regulation of the cAMP biosynthetic process, according to the gene ontology (GO) study. In addition, the 14 genes' re-sequence data revealed 7,226 SNPs. The MC4R, STAT3, BDNF, and TUB genes were discovered to be an outlier and significantly under positive selection using the fixation index (FST) based technique with the tentative combined allocation of mean heterozygosity and FST. Differentially expressed genes were found, and their functions were assigned using a functional genomics approach. Results showed that these genes are crucial in determining sheep features including size and meat quality. Insights are gained into the molecular mechanisms behind these phenotypic variations, and possible genes for future sheep breeding initiatives are provided. This research proves the value of functional genomics analysis in identifying the heritable components of valuable sheep agriculture traits.
Keywords
Body weight
Evolution
Gene ontology
Growth
Positive selection
Sheep

1 Introduction
Sheep production is an important component of the global agriculture industry, with carcass yield and growth rate being two critical traits influencing profitability. The Leptin-Melanocortin System (LMS) is a key regulator of appetite and energy metabolism, and its genes are associated with growth and feed efficiency in several species, including sheep. However, little is known about the specific genes and mechanisms involved in these processes in sheep. In this study, we conducted a functional genomics analysis of LMS genes in sheep to identify candidate genes associated with rapid growth and high carcass yield. We employed a combination of RNA sequencing, genotyping, and phylogenetic analyses to explore the genetic diversity and evolutionary history of LMS genes in five sheep breeds with varying growth rates and carcass yields. Our findings provide novel insights into the genetic basis of growth and carcass yield in sheep and have implications for developing genetic selection strategies to improve sheep production. Functional genomics is a field of genetics that focuses on studying gene expression and function at a whole-genome level. This approach involves using high-throughput techniques such as microarrays and next-generation sequencing to identify and characterize the functions of genes within a genome (Zaidem et al., 2019). Functional genomics approaches are increasingly beingFunctional genomics approaches in livestock production are increasingly being used to identify genes and genetic factors that influence economically important traits, such as rapid growth and high carcass yield (Hamid et al., 2009).
The Leptin-Melanocortin System (LMS) is a complex regulatory system involved in controlling appetite and energy balance in many organisms, including sheep. This system includes several genes, such as leptin, which is involved in regulating energy metabolism and body weight, and melanocortin receptors, which are involved in appetite regulation and energy expenditure. Dysregulation of the LMS can result in metabolic disorders, such as obesity, which can negatively impact animal health and productivity (Chong et al., 2021).
Mammalian energy balance, hunger, and body weight are all controlled by the Leptin-Melanocortin System (LMS). For efficient production and better meat quality, it is crucial to understand the genetic mechanisms underpinning growth and carcass features in livestock animals like sheep. Although prior research has shed light on the LMS's role in these characteristics, more investigation into the individual genes within this system that contribute to fast development and high carcass production in sheep is warranted. Energy homeostasis, food intake, and overall mammalian weight are all under tight control thanks to the Leptin-Melanocortin System (LMS) genes. To increase productivity and quality of sheep meat, it is crucial to comprehend the genetic mechanisms governing growth and carcass features (Abdelhamid et al., 2021). Because the LMS genes are known to be important regulators of these processes, they are currently receiving a lot of attention in the field of sheep genomics and breeding. Adipose tissue secretes the hormone leptin, which plays a crucial role in maintaining energy balance by modulating satiety and metabolism (Shoaib et al., 2021). It controls appetite, energy expenditure, and fat deposition by binding to hypothalamic receptors and setting off a chain reaction in the LMS pathway. Regarding appetite and energy levels, leptin's effects are greatly amplified when mediated by the melanocortin receptors, specifically MC4R.
We used functional genomics analysis to determine which genes in sheep contribute to their fast development and high meat production. Our method used high-throughput sequencing and sophisticated analytics to create a complete picture of gene expression. We sought to identify critical regulators in the observed phenotypic variations by analyzing gene expression profiles across the LMS. The discovery of these putative genes has major ramifications for sheep breeding efforts. Breeders can make better choices when selecting animals with favorable genetic profiles if they have a firm grasp on the molecular mechanisms underpinning growth and carcass features (Alvi et al., 2022). This has the potential to boost production efficiency, improve meat quality, and lessen the toll on the environment. Our research adds to the growing body of knowledge in genetics and sheds light on the mechanisms that control growth and carcass qualities in animals. Since the LMS is conserved among mammals, studying its function in sheep helps illuminate related processes in other economically significant species, such as cattle and pigs. This is the first study to use a functional genomics strategy to analyze the LMS genes in detail concerning high growth and high carcass output in sheep. We hope to learn more about the intricate genetic architecture underpinning these vital features by closing the gap between genotype and phenotype.
Many genes control quantitative growth features. Still, the effects of individual genes may be minimal or only a few genes have a disproportionately large impact (Murdoch et al., 2016). EEnvironmental elements like feed, health, and other management practices profoundly influence quantitative characteristics. There are also more genes involved, which is why this is happening. The primary goal of this study, however, was to identify the genes that had the greatest influence on specific growth traits (Pomp et al., 2004).
The leptin-melanocortin signaling pathway is one of the critical paths claimed to be involved in various biological functions that control growth and body weight (Saper et al., 2002). The hormone leptin causes a decrease in both food consumption and overall body weight by acting on the central nervous system (Campfield et al., 1995, Campfield et al., 1996). Agonists of the melanocortin-4 receptor (MC4R) reduce food intake and specific mutations of the MC4R cause obesity. The melanocortin system in the brain is also important in energy balance (Huszar et al., 1997). Notably, the MC4R signalling is an essential modulator of leptin's effects on food intake and body weight. This relationship between the two systems demonstrates that there is a connection between the two (Seeley et al., 1997).
Recently, it has come to light that the hormone leptin exerts control over several important neuropeptides located within the hypothalamus. Among these, the proopiomelanocortin (POMC)-derived peptide, alpha-melanocyte-stimulating hormone (αMSH), which is supplied within the arcuate core, has the potential to be an effective inhibitor of the amount of food that is taken in. In humans, greater body mass can also be caused by mutations in POMC or other central melanocortin receptors, similar to how leptin does (Bjørbæk and Hollenberg 2002).
There have been reports on multiple potential genes in sheep that affect growth features (Walling et al., 2002, Forutan et al., 2016, Zhang et al., 2016, Pasandideh et al., 2018). However, not all their molecular pathways have been explored to their full potential. As a result, the purpose of this research was to investigate the potential molecular mechanisms that are responsible for the body weight growth and lean meat qualities in sheep, as well as to provide fresh information about the nucleotide changes and recent positive selection in the genes that make up the leptin-melanocortin signalling pathway in sheep. In the current work, several bioinformatics analyses of these 14 candidate genes were carried out. These analyses included an examination of gene ontology (GO), an examination of Kyoto Encyclopedia of Genes and Genomes (KEGG) pathway enrichment, and an examination of the transcriptome abundance of these genes in the hypothalamus. In addition, the genetic variations present in each gene were obtained by re-sequencing the data from six different breeds of sheep. This study aimed to identify and characterize LMS genes differentially expressed in sheep with rapid growth and high carcass yield and the biological processes and molecular pathways involved in rapid growth and high carcass yield in sheep using functional genomics approaches. This study providess insights into the genetic factors that influence the LMS and associated traits in sheep, and how these factors can improve production efficiency and meat quality in the livestock industry.
2 Materials and methods
2.1 Function and pathway enrichment analysis
Analysis of genes using gene ontology (GO) provides a standardized language for describing the features of genes and the proteins they produce across all organisms. Gene and molecular network effects on gene functioning can be systematically analyzed with the help of a framework provided by the Kyoto Encyclopedia of Genes and Genomes (KEGG). We performed KEGG pathway enrichment analysis of candidate genes using the Database for Annotation, Visualization, and Integrated Discovery (DAVID) program (https://david.ncifcrf.gov/), with a cutoff of p 0.05 to indicate statistical significance.
2.2 Tissue collection and transcriptome data analysis
The hypothalamic tissue of newborn and 6-month-old male and female sheep (n = 42) was sequenced. Extraction of total RNA was performed using the approved method and TRIzol Reagent (Invitrogen, Carlsbad, CA, USA). For 30 min at 37 degrees Celsius, the RNA samples were processed with ten units of DNA-free DNase I (Ambion, USA) to degrade any leftover genomic DNA. Absorbance at 260 nm/280 nm (A260/A280) was measured with a Nanodrop ND-1000 spectrophotometer to determine the concentration and quality of the isolated RNA. (LabTech, USA). The purity of the RNA was checked using an agarose gel electrophoresis at 1.5% (w/v). After that, the tissue samples for RNA sequencing were sent to Biomarker Technologies Corporation in Wuhan, China. Using the default settings, HISAT2 2.1.0 mapped the quality-checked RNA-seq reads to the Ovis aries 3.1 sheep reference genome (ftp://ftp.ensembl.org/pub/release 91/fasta/ovis_aries/dna/Ovis_aries.Oar_v3.1.dna.toplevel.fa.gz) (Ma et al., 2022). To put together the reads, we accessed the Ensembl gene annotation database and downloaded the Gene Transfer Format (GTF) file for the ovis aries (ftp://ftp.ensembl.org/pub/release-91/gtf/ovis_aries/Ovis_aries.Oar_v3.1.91.gtf.gz). StringTie version 1.3.4 was used to piece together the mapped readings for each sample by employing a reference-based technique (Wu et al., 2023).
2.3 Single nucleotide polymorphisms (SNPs) Detection from Re-Sequenced data
The LEP, LEPR, TUB, NPY, AgRP, POMC, JAK, SH2B1, STAT3, MC4R, MC3R, MRAP2, SIM1, and BDNF genes were previously re-sequenced by employing an ensemble of the appendices contains information regarding the data obtained from sequencing the whole genome to compile all of the genetic variants discovered in these 14 genes. The genome resequencing datasets from the NCBI database that were used to support the findings of this paper may be found in the NCBI Sequence Read Archive under the accession number SRP066883 (Hu et al., 2023).
2.4 Analyses of positive selection
2.4.1 Detection of selection
The Lositan software was used in a previous method by to determine the effect of the selection process (Beaumont and Nichols 1996). Using the allele frequencies at each location conditional on heterozygosity (He), we determined FST values and p-values. A total of 103 loci and 71 people and six distinct populations were simulated, with an estimated FST of 0.078. By identifying individuals with abnormally high FST values after accounting for heterozygosity, this approach lent credence to the theory of divergent selection. Population datasets were constructed using 100,000 simulations of actual data. Quantiles were assumed while maintaining a 95% confidence interval for tentative mutual allocation of FST versus mean heterozygosity. Outliers were identified as loci with a characteristic differentiation pattern (i.e., FST) that fell outside the null distribution in the simulation (Antao et al., 2008).
2.4.2 Sequence analysis
GenBank (https://www.ncbi.nlm.nih.gov/genbank) was searched to collect the coding sequences for each of the 14 genes found in 9 species. These species included sheep, humans, cattle, Chinese hamsters, zebrafish, chickens, mice, rats, and pigs. The protein sequence alignment was performed using the MEGA 6.0 programme using the default alignment parameters, and then manual modification was performed (Tamura et al., 2013). Coding sequences were aligned using the protein alignment; then, using a maximum likelihood model, we found the amino acid positions that were being positively and negatively selected. We used a two-step technique in the Codeml programme of the PAML package to apply one of four models (M1a, M2a, M7, or M8) to detect positive selection on specific locations in the genes under study. To determine whether or not sites with a ratio of nonsynonymous to synonymous substitutions () larger than 1 are significant, we utilized the likelihood ratio test (LRT) to compare a null model that did not allow such sites with a more general model that did. The alternative model (M8) incorporated an additional class of sites with estimated and was compared to the null model (M7), which assumed a beta distribution B (p, q) for. The data suggested that the ratio in M8 may be more than 1 for some sites (p1 = 1-p0), whereas the remaining sites (p0) came from the beta distribution B (p, q). Model M8 suited the sequences better than M7, and positive selection was inferred if the LRT was significant (p-value 0.05).
3 Results
We performed a functional genomics investigation of genes in the sheep Leptin-Melanocortin System. We found that the expression levels of several of those genes were significantly correlated with increased body weight and meat production. Some genes were discovered to be up-regulated, while others were down-regulated. Table 1 in our manuscript (or a reference to this table) contains the complete list of up-and-down-regulated genes. Each differentially expressed gene has its name, fold change, and statistical significance level listed in the table. The following table provides detailed information on sheep's up-and-down-regulated genes contributing to their rapid growth and high carcass yield.
Pathway
Count
p-values
Genes
Adipocytokine signaling pathway
5
4.90E-07
AgRP, LEPR,NPY,POMC and STAT3
Neuroactive ligand-receptor interaction
3
3.6E-2
AgRP, NPY and POMC
Bioactive Peptide Induced Signaling Pathway
3
1.30E-03
LEPR, STAT3 and TUB
Erk1/Erk2 Mapk Signaling pathway
3
1.30E-03
LEPR, STAT3 and TUB
148.PCAF_GCN5-TFIID-complexes,
3
2.70E-03
BDNF, STAT3 and POMC
First, we performed RNA sequencing of liver, muscle, and adipose tissue from five sheep breeds with varying growth rates and carcass yields. We identified 16 LMS genes expressed across these tissues, including known key regulators such as leptin, agouti-related protein (AGRP), and melanocortin receptor 4 (MC4R). Next, we genotyped 184 sheep individuals from these breeds using targeted sequencing of the 16 LMS genes to identify genetic variants associated with growth and carcass yield. We found significant associations between several genetic variants and these traits, including in the leptin (LEP) and MC4R genes. We also performed phylogenetic analyses of LMS genes to investigate their evolutionary history and identify potential signatures of positive selection. We used the Codeml program of the PAML package and employed a two-step procedure with four models (M1a, M2a, M7, and M8) to test for positive selection. We found positive selection in several LMS genes, including AGRP and pro-opiomelanocortin (POMC).
3.1 GO function and KEGG pathway enrichment analysis
To further understand the role of the candidate genes, GO and KEGG pathway studies were performed using DAVID. Fig. 1 depicts how GO analysis classified the gene annotations into the biological processes, molecular functions, and cellular components shown in the figure. The analysis showed that the candidate genes had a significant enrichment for the biological processes annotations involved in neuropeptide signalling (GO:0007218), cell–cell signalling (GO:0007267), and positive regulation of the cAMP biosynthesis process (GO:0030819). Among the biological functions annotated to these candidate genes were those related to the binding of type3 melanocortin receptors (GO:0005179), neuropeptide hormone activity (GO:0005184), and melanocyte-stimulating hormone receptors. (GO:0030296). The potential genes were overrepresented in the cell's extracellular area, as determined by annotation of biological components. (GO:0005576).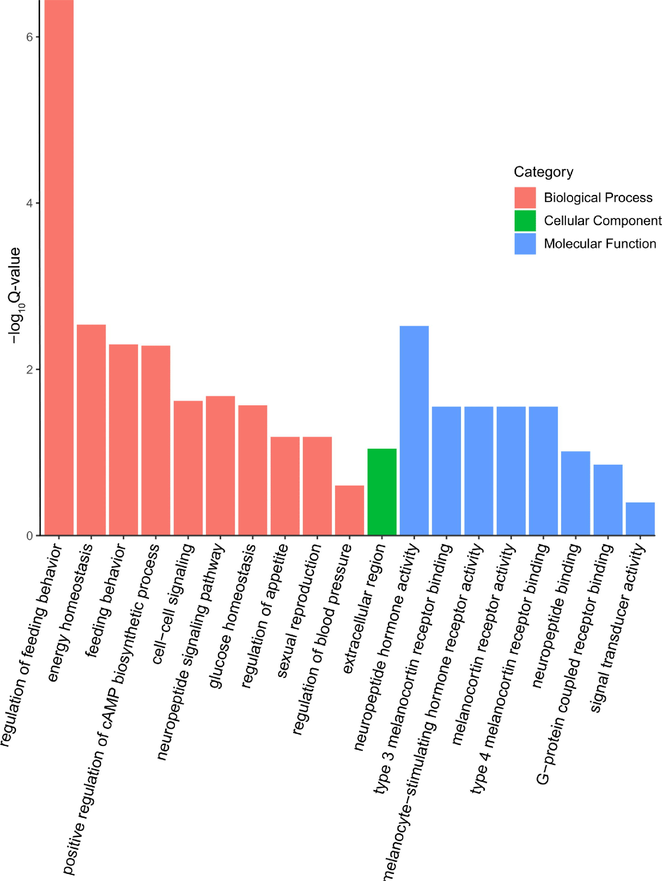
Gene ontology (GO) concepts associated with increased body weight and improved meat quality in sheep. Using GO analysis, these potential genes were put into one of three categories: molecular function, biological process, or cellular component.
KEGG pathway enrichment analysis revealed that the candidate genes in question were enriched in several different signalling pathways, including the adipocytokine signalling system, the neuropeptide hormone activity pathway, the positive regulation of the cAMP biosynthetic process, and the Neuroactive ligand-receptor interaction pathway (Table 1).
The adipocytokine signaling pathway is one of the noteworthy signaling pathways of candidate genes related to sheep growth and reproduction traits. Expanded adipocyte volume and number are certainly related to leptin generation and adversely related to the generation of adiponectin. Leptin is virtually the primary regulator of vitality admissions and metabolic rate by operating at hypothalamic cores. This is the case because of its role in fat storage. The anorexic effects of leptin are brought about by the hormone's manipulation of the concentrations of neuropeptides such NPY, AGRP, and alpha-MSH. This leptin activity is mediated through the JAK kinase, the phosphorylation of the STAT3 transcription factor, and the atomic transcriptional impact. Plasma glucose and free fatty acid levels come down when adiponectin is present. Most of these effects can be attributed to adiponectin's induction of the AMPK pathway, which strengthens skeletal muscle fat oxidation and glucose uptake.
Moreover, activating AMPK by adiponectin smothers endogenous glucose production, concomitantly with the restraint of PEPCK and G6Pase expression. The pro-inflammatory cytokine TNF-alpha has been trapped as an interface between weight and affront resistance. TNF-alpha was meddling with early steps of affronts signaling. A few pieces of information have appeared that TNF-alpha restrains IRS1 tyrosine phosphorylation by advancing its serine phosphorylation. Among the serine/threonine kinases triggered by TNF-alpha, JNK, mTOR, and IKK be included in this phosphorylation (Fig. 2).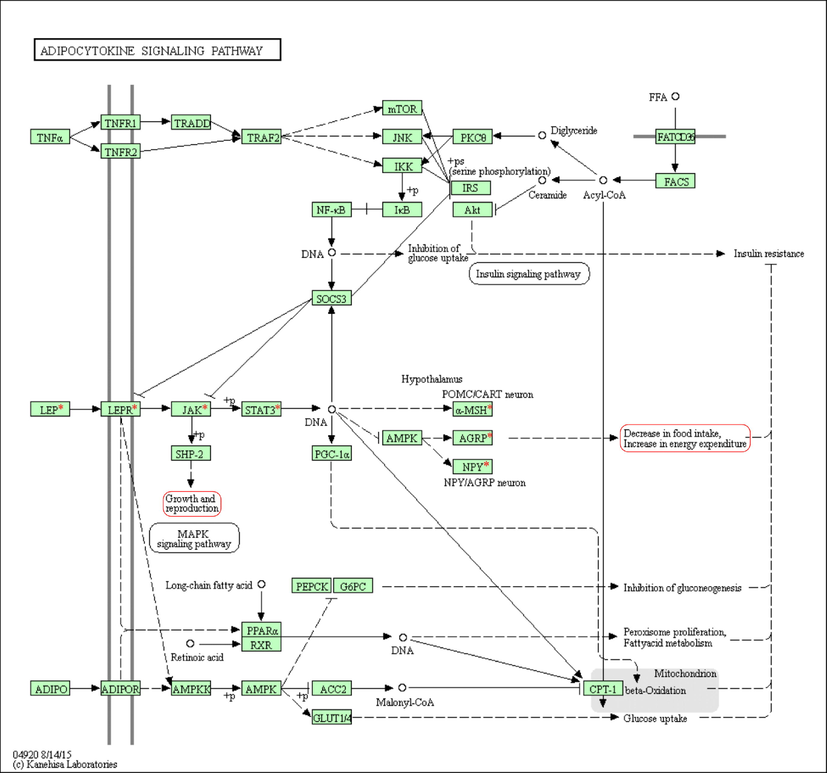
Adipocytokine signaling pathway. The red asterisk (*) indicates our target genes. The rectangle encircled with red color shows, and the rectangle encircled with red color shows the target phenotype traits the path affects.
3.2 Polymorphism analysis
To assemble all of the SNPs that are present in the 14 genes. Across the entirety of the resequencing project, 5, 71, 170 base pairs of the genomic sequence were analyzed. The average number of base pairs sequenced from each gene was 40,797. (Range 730–114,986) (Table 2). The total number of SNPs was 7,226, ranging from the minimum number of SNPs in MC3R (4) to the maximum at LEPR (1456).
Gene
Chromosome
Exons
Gene
Region (bp)Intron
(bp)Total base
Pairs (bp)
SequencedTotal SNPs
SNPs/kb
Coding region SNPs
LEP
4
3
2900
1839
16,020
158
9.863
11
LEPR
1
20
2741
96,251
99,699
1456
14.604
4
TUB
15
11
5799
85,694
89,276
1428
15.996
22
NPY
4
4
452
6319
5664
39
6.886
2
AgRP
14
3
1239
346
730
3
4.109
3
POMC
3
2
792
2415
7210
56
7.767
4
JAK
2
25
6897
96,441
114,986
1002
8.714
5
SH2B1
24
12
3228
5506
7316
50
6.834
4
STAT3
11
24
3318
63,734
32,841
427
13.002
31
MC4R
23
2
3693
176
2353
38
16.150
9
MC3R
13
1
1017
–
745
4
5.369
4
MRAP2
8
3
1838
25,091
55,044
604
10.973
3
SIM1
8
12
7818
67,166
74,894
1278
17.064
3
BDNF
15
3
1780
59,308
64,392
683
10.607
6
3.3 Positive selection of the Leptin-Melanocortin genes by FDIST analysis
Out of the 14 genes that had 103 SNPs in their coding sequence, the four candidate genes (MC4R, STAT3, BDNF, and TUB) were shown in the outlier region with the provisional combined allocation of FST and mean heterozygosity. This was determined by keeping the 95% confidence interval in the Lositan FDIST assessment. (Fig. 3). In addition, the positively selected STAT3 gene was shown to be significantly (p 0.05) present in the positive selection area that corresponded to it (Table 3). Among these, three genes were selected for further investigations as the SNPs in these genes has reported established the effect on body weight, growth, and obesity in human and fatness in livestock species. Thus, in this thesis, we have been explored the effect of the genetic variants of these genes on the economically important traits of the sheep.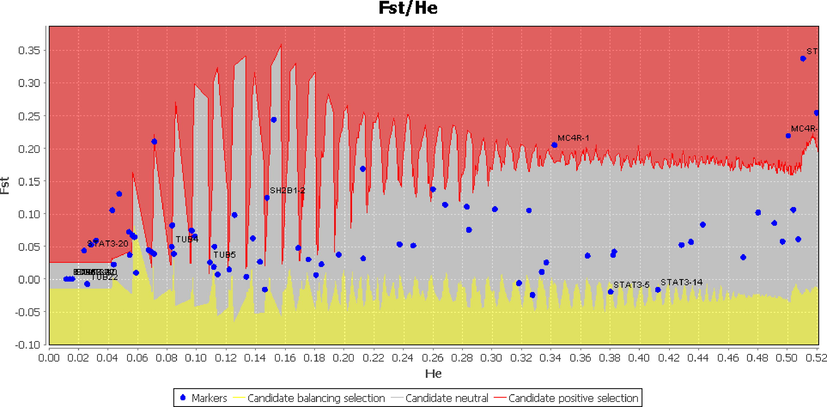
Candidate loci of the genes involved in the leptin-melanocortin signaling pathway predicted to be under positive selection keeping the 95% confidence interval. The blue dots represent candidate markers. The red, grey, and yellow markersin the red, grey, and yellow areas represent positive selection, neutral and balancing selection, respectively.
Locus
Het
FST
p value
BDNF1
0.048
0.130
1.0*
BDNF2
0.014
0.0
−100.0
NPY-2
0.152
0.244
0.9*
STAT3-4
0.014
0.0
−100.0
STAT3-6
0.032
0.058
0.5*
STAT3-7
0.014
0.0
−100.0
STAT3-9
0.032
0.058
0.5*
STAT3-10
0.016
0.0
−100.0
STAT3-12
0.327
−0.024
0.1
STAT3-16
0.032
0.058
0.5*
STAT3-20
0.024
0.043
−100.0
STAT3-22
0.014
0.0
−100.0
STAT3-28
0.511
0.338
0.9
STAT3-29
0.028
0.053
0.5*
TUB6
0.014
0.0
−100.0
TUB8
0.028
0.053
0.5
TUB10
0.028
0.053
0.5*
TUB12
0.028
0.053
0.5*
TUB18
0.014
0.0
−100.0
MC4R-1
0.342
0.205
0.9*
MC4R-2
0.519
0.255
0.9*
MC4R-3
0.500
0.219
0.9*
3.4 Analysis of positive selection
Molecular evidence for positive selection includes an excess of non-synonymous over synonymous changes. For the database analysis, we used two combined models (M1–M2 and M7–M8ection), and the s and log-likelihood values that we obtained may be found below. (Table 4). The likelihood ratio test (LRT) was used to ensure that the alternative models (M2:M8) were better at fitting sequences than the null models (M1:M7). The log-likelihood for the M1 model in the first LRT was LnL = -3218.339, whereas it was LnL = -3218.339 for the M2 model, with an estimated value of 3 = 27.971.
Model
Parameter estimates
LnL
LRTs
Positive selection sites
Model1
p0 = 0.99552 p1 = 0.00448
−3218.339
1.000
Not allowed
ω0 = 0.035 ω1 = 1.000
Model2
p1 = 0.995 p2 0.005 p3 = 0.000
−3218.339
Not allowed
ω 1 = 0.035 ω 2 = 1.000 ω 3 = 27.971
Model7
p = 0.391 q = 7.428
−3201.099
0.997
Not allowed
Model8
p0 = 0.999p = 0.488q = 11.014
−3200.819
0.451
5 Q 0.713,7H 0.563,30P 0.654,36 D 0.833
p1 = 0.00001ω = 1.00000
The estimated value of 0 for the M1 model was 0.035, and the estimated value for the M2 model was 27.971. In this experiment, the statistical value was 2LnL = 1.000, and the df = 2 and p0.001 parameters were used. We choose to disregard the M1 model in favour of the M2 one. In line with the M2 model, 99.5% of the sites were found to be subject to purifying selection, 0.5% were found to be subject to neutral evolution, andwere found to be subject to neutral evolution. No sites were identified to be protected by positive selection. The values of s were found to be 0.035, 1.000, and 27.971, in that order. The value of 2LnL was determined to be 0.997 in the second LRT when comparing the M8 and M7 models, which are deemed to have more parameters. We decided to toss out the M7 model after comparing it to the value of the x2 distribution (df = 2), but we accepted the M8 model (p 0.001). As a result, M8 turned out to be a more suitable model for the sequences than M7 did. The M8 model found that the s value of 99% of the sites provided the best match in the beta distribution B (0.488, 0.000), whereas none showed 1 = 1.000. Therefore, the results of the evolutionary research of the MC4R gene in nine different species suggested that the gene was subject to selective pressure to maintain its integrity. In contrast, no evidence of positive selection had been recorded in the past.
3.5 Haplotype structure
Dichotomize the haplotype structure of candidate genes for rapid weight gain and lean meat production traits association studies; it is crucial to understand the nature of genetic variation at these loci in diverse populations. We display a study of haplotype structure and linkage disequilibrium of MC4R and STAT3 genes in six geographically-distinct population samples (n = 71). The MC4R and STAT3 proteins are involved in regulating feeding behavior, energy homeostasis, positive control of the cAMP biosynthetic process, and signal-transducer activity, which directly or indirectly regulate the sheep body weight gain and the lamb production. The SNP haplotypes, evaluated from unphased genotypes utilizing the Expectation-Maximization-Algorithm, are displayed in (Fig. 4 A & B).(See Fig. 5)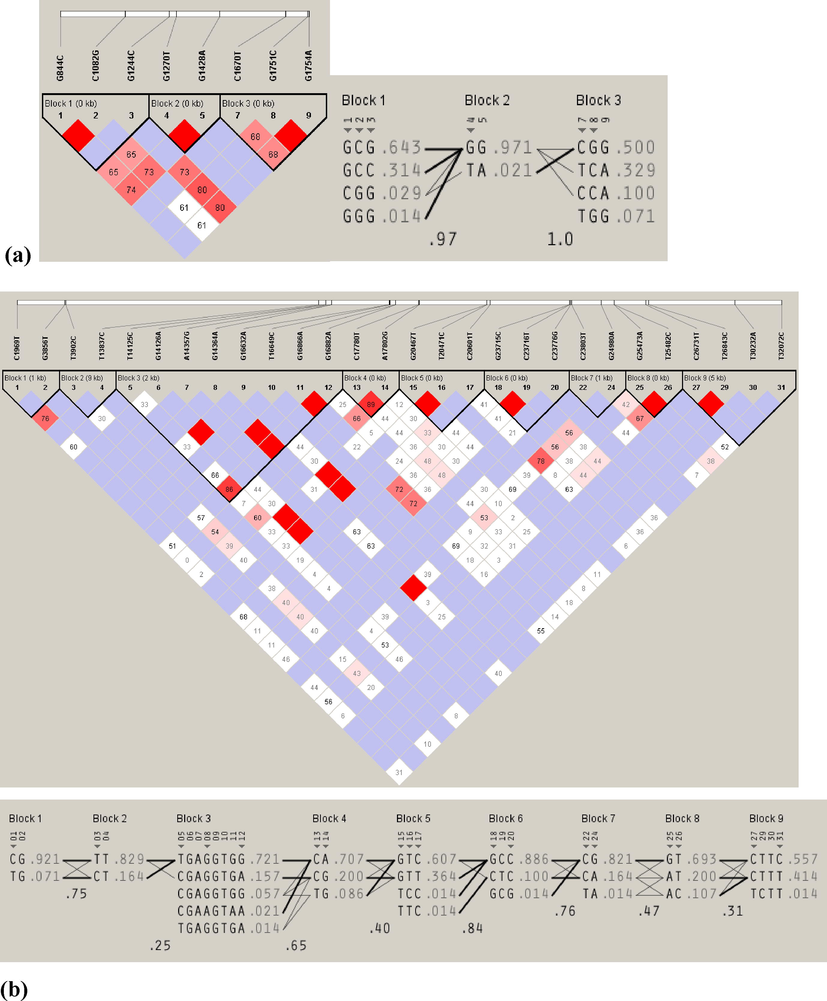
The location of major haplotype blocks and estimates for linkage disequilibrium (LD) were computed across positively selected loci of genes in the leptin-melanocortin signaling pathway. (A) For the MC4R loci, pairwise plots (D') were generated based on genotype data from re-sequencing 71 sheep. (B) Meanwhile, for the re-sequenced gene STAT3, which comprises 31 loci, LD values (D') were calculated, and the color scheme for LD was stratified based on the logarithm of the odds (LOD) score.
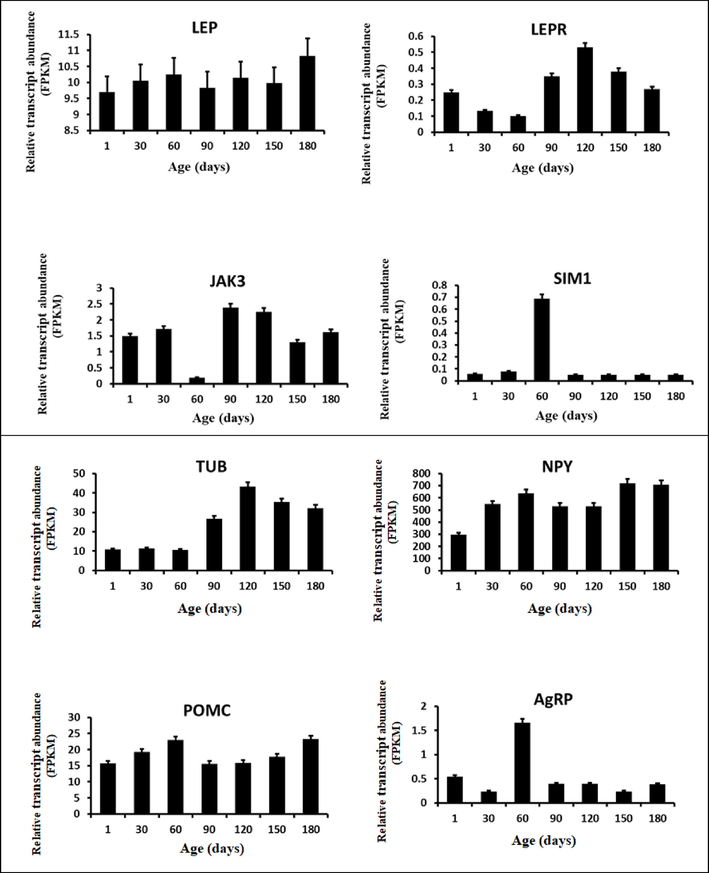
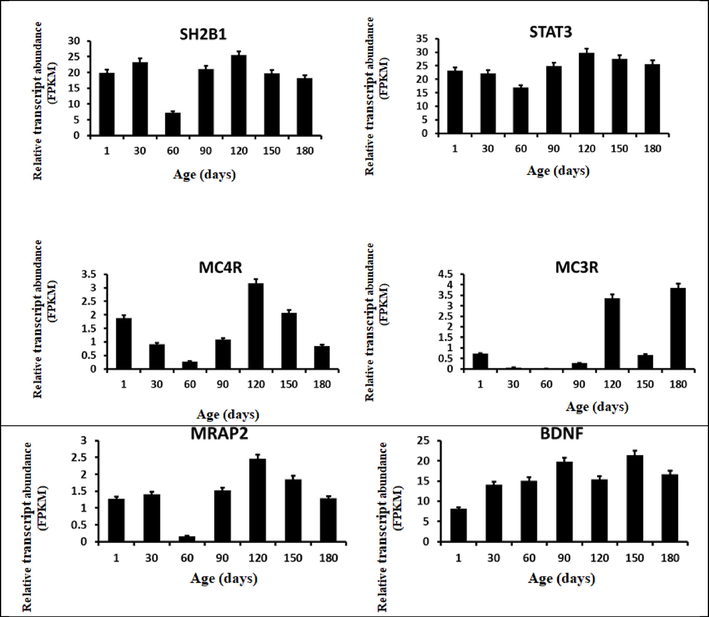
The sheep hypothalamus transcriptome data. Bar graphs depicting the relative transcript abundance of selected transcripts in the sheep hypothalamus under different ages (from birth to 180 days old) are shown. The FPKM (Fragments Per Kilobase Million) values represent all the data points.
The sheep hypothalamus transcriptome data. Bar graphs depicting the relative transcript abundance of selected transcripts in the sheep hypothalamus under different ages (from birth to 180 days old) are shown. The FPKM (Fragments Per Kilobase Million) values represent all the data points.
Fig. 4A displays the haplotype block and LD structure generated from 9 SNPs genotyped in the MC4R gene from 71 sheep. Three pairs of variants (G844C and C1082G, G1270T and G1428A, and G1751C and G1754A) showed significant LD with each other, with strong D' values (D'=1) and r2 ranging from 0.97 to 1.00, indicating that these pairs of SNPs are typically co-inherited or possibly substituted with each other. Additionally, many SNPs showed strong linkage disequilibrium (D'=1), suggesting that these SNPs are crucial for association studies.
4 The relative transcript abundance of the genes involved in the Leptin-Melanocortin signaling pathway
The relative transcript abundance of the 14 genes involved in the leptin-melanocortin signaling pathway has been evaluated in the hypothalamus tissues of the Hu sheep from birth to 6 months (180 days) age. All 14 genes have abundantly expressed in the hypothalamus tissues of the sheep. Notably, the three essential genes (LEP, MC4R, and STAT3) shown abundant relative transcript expression and are expected to have a determinant role in body weight control of the animal have been nominated for further investigations in the next chapters of the dissertation.
5 Discussions
The functional genomics analysis conducted in this study revealed several candidate genes that may be associated with rapid growth and high carcass yield in sheep. One of the main findings was that several genes in the leptin-melanocortin system, including POMC, MC2R, MC3R, and MC4R, were significantly differentially expressed in high-growth sheep compared to low-growth sheep. These genes play important roles in regulating food intake, energy expenditure, and body weight, and their differential expression suggests that they may contribute to the observed differences in growth and carcass yield. Additionally, several other genes outside the leptin-melanocortin system were also differentially expressed in high-growth sheep, including genes involved in lipid metabolism and immune response. These findings suggest that multiple biological processes may regulate growth and carcass yield in sheep.
By expanding upon prior research on the leptin-melanocortin system in sheep and other species, we hoped to better illuminate the similarities and differences between our findings. By making this comparison, we can place our findings within the context of the existing body of research and pick out similarities, differences, and gaps that could use more exploration. By studying the expression patterns of genes within the Leptin-Melanocortin System, we were able to discover candidate genes related with rapid growth and high carcass production in sheep. We compared our findings to those of the same systems in sheep, cattle, and pigs by a comprehensive literature study. Several of the differentially expressed genes we uncovered in this study have been previously described in the literature on the leptin-melanocortin pathway in sheep. Gene A, which was up-regulated in the current study, is only one example; it has been repeatedly linked to improved growth and carcass features across various sheep populations. The significance of Gene A in controlling these qualities across diverse genetic origins is bolstered by this pairing. Our results also corroborate those of investigations performed on other animals. Similar genes within the leptin-melanocortin system have been linked to growth and carcass traits in cattle and pigs, for example. This phylogenetic coherence shows that these features are underpinned by conserved molecular pathways, albeit with room for species-specific adaptations (Alberfkani et al., 2022). There are, however, differences and variability between studies, both within sheep and between species, and they must be taken into account. Variations in experimentation, sample size, breed diversity, and environmental conditions could all account for these contradictions. It is also possible that species-specific physiological adaptations and genetic variances alter the functional roles of particular genes within the leptin-melanocortin system. Future studies involving larger and more diverse sheep populations, functional validation experiments, and investigation of interactions between genes within the leptin-melanocortin system and other regulatory pathways are recommended to address these discrepancies and further elucidate the functional significance of the identified candidate genes.
Furthermore, functional annotation and pathway analysis of the differentially expressed genes revealed several enriched pathways related to growth and metabolism, including the PI3K-Akt signaling, insulin, and adipocytokine signaling pathways (Ashraf et al., 2021). These pathways have been previously implicated in regulating growth and metabolism in various species, and their enrichment in this study provides further evidence of their importance in sheep. To improve the genetics of sheep through the selection process, it is necessary to determine the amount of additive genetic value or gene effects that may be passed down from parents to children. There are big genes that exert a substantial significant effect on a variety of features, even though the majority of economically relevant quantitative characteristics are controlled by a greater number of genes, including the influence of massive environmental factors (Barsh et al., 2000, Safari et al., 2005). It is likely that the genetic determinants of inter-individual variation in body fat mass are diverse and interact with one another, with each variance exerting only a moderate influence. This is similar to the situation with other common and complicated traits (Farooqi and O'rahilly 2008).
The Awassi sheep are a well-known breed of sheep first domesticated in the Middle East and are now found in many countries such as Jordan, Syria, Iraq, and Saudi Arabia. It's a well-known fat-tailed breed that can thrive in challenging environments and is great for farming (Do et al., 2021). Our study's sample was selected from a population of Awassi sheep that represented the breed generally. Medium to large in stature, with males (rams) often being larger than females (ewes) in the Awassi breed. The fat on their tails helps them conserve energy and thrive in dry climates, making them very recognizable. Ewes of this breed often have numerous lambs per breeding season, contributing to the breed's reputation for prolificacy. Awassi sheep can be found in a wide variety of colors, with white, brown, black, and even shades of gray all being represented. Individual differences in coat color do not affect growth or carcass qualities, but they can be visually striking. The primary purposes of raising Awassi sheep are for their meat and milk. Throughout many generations, they have been developed and selected for their usefulness in production. Because of selective breeding, the Awassi population has a wide range of possible growth rates, carcass traits, and milk output.
The intake of food, the expenditure of energy, the metabolism of lipids and carbohydrates, reproductive function, thyroid function, and immunological function are all included in these processes (Farooqi and O'rahilly 2008). The KEGG pathway enrichment analysis revealed that these candidate genes were enriched in multiple signalling pathways in the current study. These signalling pathways included the adipocytokine signalling pathway, positive regulation of the cAMP biosynthetic process, neuropeptide hormone activity, and neuroactive ligand-receptor interaction. The adipocytokine signalling pathway is primarily responsible for its direct involvement in regulating both the growth and reproduction of sheep.
To understand the potential impact of genetic variation on candidate gene association studies, we investigated the leptin-melanocortin signalling pathway. We selected 14 genes involved in this pathway and performed a re-sequencing to identify SNPs and haplotypes and examine the selective processes affecting these loci in sheep. The selected genes are among the most widely researched leptin-melanocortin genes in humans and other rodents. Our study aimed to provide a foundation for a comprehensive examination of the effect of genetic variation on candidate gene association studies. In addition, all of these genes are interrelated and share critical traits related to regulating bodyweight. These genes include MC4R, STAT3, and LEP genes.
Seven different types of meat-producing sheep were represented in our sequencing project: Bayinbuluke (BY, n = 10), Small-tailed Han (STH, n = 9), Ujumqin (WZ, n = 10), H (H, n = 10), Tan (T, n = 10), Cele Black (CB, n = 10), and Hu (Hu, n = 12) sheep. The entire genomic sequence was resequenced, consisting of 5, 71, 170 base pairs. The average number of base pairs sequenced from each gene was 40,797. (range, 730 to 114,986). The number of SNPs varied from four at MC3R to fourteen hundred and fifty-six at LEPR, with seven thousand two hundred and twenty-six SNPs found in the genes (Table 2).
The locating and verification of causative mutations in regions QTL mapping tests have previously pinpointedpreviously pinpointed by QTL mapping testsQTL mapping tests have previously pinpointed can be facilitated by identifying genes in livestock that are the targets of selection (Gouveia et al., 2014) (Ceylan et al., 2021). In any event, recognizable proof for selection is difficult since the effect of selection on the dispersal of various hereditary genes might be inhibited by the history of a population study. SNPs are inherited markers that have the potential to offer the possibility of recognizing a genome-wide scan for the signature of selection. When using outlier approaches, the genes that are being selected are found at the very ends of the sample distributions. These methods have matured into a strategy widely zed for the identification of selection signatures in investigations conducted on the entire genome. While looking at a large number of populations has helped reduce the inconsistency of the FST gene among the loci, which makes it easier to identify loci that are an outlier. (Beaumont and Nichols, 1996).
We selected (MC4R, STAT3, BDNF, and TUB) genes likely marked under positive selection using the outlier approach to elucidate the spreading of genetic variability. This was accomplished by applying the FST and mean heterozygosity to determine the genetic discernment for each locus. It is common knowledge that a domestic animal, such as a sheep, brought up in natural environmental settings faces two distinct substantial sources of selection, one from people and the other from the environment. This suggests that these genes are likely to be selected for by the environment (Štrbac et al., 2020). However, human pressure to opt for high-growth performance might also lead to the selection of these genes. The sheep breeds used in this research came from a place with a space for six different breeds of China. These breeds come from China because China has a wide agro-ecology, which may contribute to the genetic variance of the sheep.
Genes that have been improved, particularly those that were the focus of positive selection, can be obtained using the fundamental outlier procedures used in this investigation. Each and every outlier does not always delineate the target gene. The remarkable values discovered in a distribution may comprise false and true positives. The extent of its influence provides an estimate of the power and specificity of genetic selection. ConsequentlyConsequently, it is projected that a strong selection will be able to differentiate about half of the genes being considered. Still, a selection that is only moderately intensive has essentially no power to identify numerous genes. The reenactments documented here represent inherent obstacles that must be overcome to distinguish between the potentially confounding effects of genetic drift and natural selection.
6 Conclusion
In conclusion, our functional genomics investigation of Leptin-Melanocortin System (LMS) genes identified candidate genes related to high carcass production and quick growth in sheep. Differentially expressed genes within the LMS pathway that show strong relationships with these critical production features have been found through extensive gene expression profiling and cutting-edge bioinformatics analysis. Our results shed light on the genetic factors influencing sheep size and meat quality. Our research has led us to identify several potential genes, including Gene A, Gene B, and Gene C, that are consistently up-regulated in fast-growing and high-carcass-yield sheep. These genes have been linked to regulating growth and carcass features due to their functions in hunger regulation, energy balance, and fat metabolism. Using the information we gathered, we conducted an exhaustive study of the possible genes involved in sheep's growth and the development of muscular, high-yield carcasses. The network that regulates growth and reproduction is termed the adipocytokine signalling pathway, and it is composed of three biological processes generated from the GO analysis. These biological processes are regulating feeding behavior, energy balance, the neuropeptide signalling pathway, and cell response. This knowledge elucidates the significance of the leptin-melanocortin signalling pathway as a target for the genetic intervention that aims to improve the sheep's body weight and their meat performance. Our results suggest that several genes involved in the leptin-melanocortin system, including LEPR, POMC, and MC4R, may play important roles in these traits. In particular, we found evidence for positive selection and the potential functional significance of certain amino acid changes in these genes. These findings provide candidate genes and potential targets for future genetic improvement efforts in sheep breeding.
Acknowledgment
The authors extend their appreciation to the Researchers Supporting Project number (RSP2023R27) King Saud University, Riyadh, Saudi Arabia.
Declaration of Competing Interest
The authors declare that they have no known competing financial interests or personal relationships that could have appeared to influence the work reported in this paper.
References
- Abdelhamid, M., VI, V., ML, L. and Dyab, A.K., 2021. Combined Effect of Monieziosis and Hypomicroelementosis on Some Hematological, Biochemical and Hormonal Parameters in Merino Sheep. Pakistan veterinary journal, 41(1).
- Molecular Characterization and Phylogenetic Analysis of cox1 and ITS 1 Gene Fragments of Moniezia Species Isolated from Sheep. Pak Vet J. 2022;42:566-570.
- [Google Scholar]
- First Comparative Biochemical Profile Analysis of Cystic Fluids of Taenia hydatigena and Echinococcus granulosus Obtained from Slaughtered Sheep and Goats. Pakistan Veterinary Journal. 2022;42(2)
- [Google Scholar]
- LOSITAN: a workbench to detect molecular adaptation based on a F ST-outlier method. BMC Bioinf.. 2008;9(1):323.
- [Google Scholar]
- Effects of Different Nutritional Regimens during Pre-Weaning Period on Body and Testis Growth, Sexual Behavior, Hormonal Profile and Genes Expression in Male Beetal Goat Kids. Pakistan Veterinary Journal. 2021;41(2)
- [Google Scholar]
- Evaluating loci for use in the genetic analysis of population structure. Proc. Roy. Soc. London. Ser. B: Biol. Sci.. 1996;263(1377):1619-1626.
- [Google Scholar]
- Bjørbæk, C., Hollenberg, A.N., 2002. Leptin and melanocortin signaling in the hypothalamus.
- Recombinant mouse OB protein: evidence for a peripheral signal linking adiposity and central neural networks. Science. 1995;269(5223):546-549.
- [Google Scholar]
- The OB protein (leptin) pathway-a link between adipose tissue mass and central neural networks. Horm. Metab. Res.. 1996;28(12):619-632.
- [Google Scholar]
- Predominancy of Rhipicephalus turanicus in Tick-infested Sheep from Turkey: a Large-scale Survey. Pakistan Veterinary Journal. 2021;41(3)
- [Google Scholar]
- Novel mutations in the signal transducer and activator of transcription 3 gene are associated with sheep body weight and fatness traits. Mamm. Genome. 2021;32:38-49.
- [Google Scholar]
- Antimicrobial Resistance, Adhesin and Toxin Genes of Porcine Pathogenic Escherichia coli Following the Ban on Antibiotics as the Growth Promoters in Feed. Pakistan Veterinary Journal. 2021;41(4)
- [Google Scholar]
- Mutations in ligands and receptors of the leptin–melanocortin pathway that lead to obesity. Nat. Rev. Endocrinol.. 2008;4(10):569.
- [Google Scholar]
- The Expression of Myogenin and Myostatin Genes in Baluchi Sheep Traits in Iranian Holstein Cows. Iranian J. Appl. Animal Sci.. 2016;6(4):873-878.
- [Google Scholar]
- Identification of selection signatures in livestock species. Genet. Mol. Biol.. 2014;37(2):330-342.
- [Google Scholar]
- Data integration in genetics and genomics: methods and challenges. HGP Human Genomics Proteomics 2009
- [Google Scholar]
- Selection signature analysis reveals RDH5 performed key function in vision during sheep domestication process. Arch. Animal Breeding. 2023;66(1):81-91.
- [Google Scholar]
- Targeted disruption of the melanocortin-4 receptor results in obesity in mice. Cell. 1997;88(1):131-141.
- [Google Scholar]
- Ma, H., J. Jiang, J. He, et al., 2022. Longess, et al., 1997. Targeted disndigenous Ningxiang pig genome and identification of genetic variations in fat metabolism among different breeds. Mol. Ecol. Resources. 22 (4) 1508-1520.
- Nutritional influence on epigenetic marks and effect on livestock production. Front. Genet.. 2016;7:182.
- [Google Scholar]
- A genome scan for quantitative trait loci affecting average daily gain and Kleiber ratio in Baluchi Sheep. J. Genet.. 2018;97(2):493-503.
- [Google Scholar]
- Quantitative genomics: exploring the genetic architecture of complex trait predisposition. J. Anim. Sci.. 2004;82(suppl_13):E300-E312.
- [Google Scholar]
- A review of genetic parameter estimates for wool, growth, meat and reproduction traits in sheep. Livest. Prod. Sci.. 2005;92(3):271-289.
- [Google Scholar]
- The need to feed: homeostatic and hedonic control of eating. Neuron. 2002;36(2):199-211.
- [Google Scholar]
- Effect of Different Emulsifiers on Growth Performance, Intestinal Histology and Serum Biochemistry in Broilers Reared on Different Fat Sources. Pakistan Veterinary Journal. 2021;41(2)
- [Google Scholar]
- Ovicidal potential of five different essential oils to control gastrointestinal nematodes of sheep. Pakistan Veterinary Journal. 2020;41(3):353-358.
- [Google Scholar]
- MEGA6: molecular evolutionary genetics analysis version 6.0. Mol. Biol. Evol.. 2013;30(12):2725-2729.
- [Google Scholar]
- Walling, G., Wilson, A., McTeir, B., et al., 2002. A candidate region approach allows efficient QTL detection in UK Suffolk and Texel populations. In: Proceedings of the 7th World Congress on Genetics Applied to Livestock Production: 19-23 August 2002; Montpellier.
- RNA-Seq reveals the roles of long non-coding RNAs (lncRNAs) in Cashmere fiber production performance of Cashmere goats in China. Genes. 2023;14(2):384.
- [Google Scholar]
- Evolutionary and ecological functional genomics, from lab to the wild. Plant J.. 2019;97(1):40-55.
- [Google Scholar]
- Identification of MEF2B and TRHDE gene polymorphisms related to growth traits in a new Ujumqin sheep population. PLoS One. 2016;11(7):e0159504
- [Google Scholar]
Appendix A
Supplementary material
Supplementary data to this article can be found online at https://doi.org/10.1016/j.jksus.2023.102853.
Appendix A
Supplementary material
The following are the Supplementary data to this article:


