

Translate this page into:
Multivariate and machine learning approaches for prediction of antioxidant potential in Bertholletia excelsa barks
⁎Corresponding author. carpes@utfpr.edu.br (Solange Teresinha Carpes)
-
Received: ,
Accepted: ,
This article was originally published by Elsevier and was migrated to Scientific Scholar after the change of Publisher.
Peer review under responsibility of King Saud University.
Abstract
Objectives
Specialised metabolites in plants are essential in developing new products since these compounds with antioxidant activity can be incorporated into pharmaceutical and food matrices. However, optimising the extraction processes of these bioactive compounds is necessary for a practical application. The current study aims to obtain optimal models to predict the total phenolic content (TPC) and antioxidant activity (AA) of Bertholletia excelsa barks by the ABTS, DPPH and FRAP methods.
Methods
Different algorithms were applied by Machine-Learning (ML), such as Random Forest (RF) and Partial Least-Square Regression (PLSR). Central composite rotational design (CCRD) and response surface methodology (RSM) were used to analyse the ethanol concentration, time and temperature effect on the extraction. This research used five levels for each factor to evaluate the assays. These response variables were used to generate second-order predictive models, and the best conditions for the extraction of bioactive compounds were established. A matrix correlated with the TPC and AA responses was used to generate predictive models by machine learning.
Results
The best performance to extract phenolic compounds with antioxidant activity by the ABTS method was achieved when ethanol (50%) at a temperature of 60 °C was used for 30 min of extraction. The coefficient of determination of the generated models using RF varied from 85% to 99%, while for the PLSR, the variation was from 85% to 96%. The composition of RGB (red, green, blue) images can be used to determine the TPC and AA in extracts of B. excelsa.
Conclusion
The results indicated that the current method was a powerful and effective tool for determining the AA and TPC on B. excelsa barks. In addition, this study permitted to development of a low operational cost method that can help determine the antioxidant activity of plant extracts by digital images.
Keywords
Digital images
Antioxidant
Computer vision

1 Introduction
Several plant species have been researched because they have compounds with antioxidant activities in their composition. Among these species, Bertholletia excelsa Bonpl., known as Brazil nut or Pará nut, has been much studied (Welna et al., 2008). This species is a typical plant from Brazil (John and Shahidi, 2010), belonging to the family Lecythidecaceae (Surek et al., 2022) found in the Amazon rainforest. The production of its fruit, almonds, occurs exclusively in natural forests (Ferreira et al., 2021).
There are a large number of researches on almonds in the literature. B. excelsa has edible almonds of the great economic and nutritional value as a source of macro and micronutrients (Bouvie et al., 2016). Almonds have compounds with antioxidant potential, and their consumption is associated with health benefits (Yang et al., 2009; Campos et al., 2005). However, the stem of the chestnut tree is poorly studied, despite being popularly used to treat liver diseases and as an antimalarial by indigenous and riverine peoples of the Amazon Forest (Campos et al., 2005).
Several statistical tools have been developed to help in the optimisation of extraction processes of bioactive compounds in plant extracts (Perin et al., 2020; Sari et al., 2020). These include the complete experimental design that investigates the influence of all factors involved in the processes that affect an answer (Andrade et al., 2015; Waszkowiak and Gliszczyńska-Świgło, 2016). The central composite rotational experimental design (CCRD) is a second-order model with repetitions at the centre point, making it possible to estimate the model's accuracy and systematic errors (Xiong et al., 2014; Taşpinar et al., 2021). In addition to more traditional approaches such as experimental designs, other methods have been used currently to generate classification or prediction models. Such methods use different algorithms and can classify matrices through computer vision and machine learning (ML) or generate predictive models of different responses.
ML is a data analysis tool where computational algorithms create models by training part of the data given to the algorithms (Kumbhar et al., 2021). Each data set can be adjusted differently to several existing algorithms. Among them, Random Forest (RF) has been widely used today. The RF is an algorithm based on the development of decision trees for classification or regression, built through random subsets of observed data, creating rules for constructing training and validation models. RF can improve the predictive accuracy of data through cross-validation between the predicted and observed data of the training and validation model (Speiser et al., 2019; Lovatti et al., 2019).
In addition to ML's models, can be highlighted, chemometric models. Chemometrics has gained more and more space in agriculture and the food industry due to its low operating cost and ease of sample preparation. Often, chemometrics can be combined with spectroscopic techniques making the method even more accessible (Qin et al., 2015).
The partial least squares regression (PLSR) method is a chemometric method. It has been used in food research to estimate micronutrients (Hu et al., 2021), bioactive compounds, antioxidant activity (Qiu et al., 2022) and sensory characteristics (Li et al., 2021). PLSR is a multivariate calibration method that seeks to obtain a mathematical function that relates chemical and spectral results (He et al., 2014).
Chemometric models have also been used to optimise processes in the search for bioactive compounds, an important tool for predicting the levels of phenolic compounds with antioxidant potential (Tahir et al., 2017). Phenolic compounds with antioxidant potential are produced by the specialised metabolism of plants and are essential organic compounds for their survival (Da Hora et al., 2021). In humans, these compounds may have nutritional value (Albuquerque et al., 2021), therapeutic effects and disease prevention actions (Chiocchio et al., 2021), as well as presenting pharmacological properties (Santos et al., 2019) and antioxidants (John and Shahidi, 2010; Perin et al., 2020).
However, there are few or non-existent studies on optimising the extraction of total phenolic content and antioxidant potential from B. excelsa barks which are determined by chemometric methods, such as computer vision and machine learning (ML). In this context, the present study contemplates two main objectives, presenting two approaches; the first was to optimise the conditions for extracting phenolic compounds with antioxidant potential from B. excelsa barks through a CCRD experimental design. The second approach was to develop a low operational cost method to predict the total phenolic content and antioxidant potential from B. excelsa barks using the PLSR method by digital images.
2 Material and methods
2.1 Chemicals
Folin-Ciocalteu reagent, Gallic acid, 2,4,6-tris(2-pyridyl)-s-triazine (TPTZ), 2-2′-azino-di-(3-ethylbenzthiazoline sulfonic acid) (ABTS) and Trolox were obtained from Sigma-Aldrich Chemical Co. (St. Louis, MO, USA). Ethanol was obtained by Êxodo Cientifica Ltda (Sumaré, SP, Brazil). All Reagents used were of analytical grade.
2.2 Material and preparation of extracts
Bertholletia excelsa (Brazil nut or Pará nut) barks were collected in the rural area of Alto Paraíso (Rondônia State, Brazil). The stem barks were dried in an oven at 37 °C for 24 h and then ground (30 mesh) in a knife mill (Tecnal R-TE-650/1 model, Piracicaba, SP, Brazil). The samples were placed in plastic packages in a freezer at −12 °C until the analysis was performed.
The extracts were prepared with 0.5 g of B. excelsa bark and 30 mL of ethanol in a water bath under the conditions determined by the experimental design (Table 1). The extracts were vortexed at 15 min intervals and then centrifuged at 12,000 RPM in a centrifuge (Hermle Z 200 A, Wehingen, Germany) for 15 min at 20 °C. The supernatant was then collected and stored in a freezer at −12 °C. Values followed by different letters in the same column are significantly different (p ≤ 0.05). GAE: Gallic acid equivalent, TE: Trolox equivalent. The results are expressed as mean ± standard error (n = 3).
Run
Ethanol
(%)Temperature
(°C)Time
(min)TPC
(g 100 g−1)ABTS
(mM TE g−1)DPPH
(mM TE g−1)FRAP
(mM Fe2+ g−1)
1
−1 (20)
−1 (50)
−1 (50)
14.83 ± 0.18* h
57.50 ± 2.48 k
665.14 ± 3.28 h
1623.61 ± 15.92 k
2
−1 (20)
−1 (50)
1 (100)
15.87 ± 0.03 g**
146.53 ± 2.23 i
622.00 ± 15.89 hi
2099.05 ± 7.98 h
3
−1 (20)
1 (70)
−1 (50)
16.41 ± 0.13 f
146.43 ± 5.32 h
569.45 ± 10.56 i
2130.21 ± 16.63 g
4
−1 (20)
1 (70)
1 (100)
14.54 ± 0.14 h
234.00 ± 7.33 e
957.66 ± 2.40 g
1996.99 ± 13.95 i
5
1 (80)
−1 (50)
−1 (50)
17.38 ± 0.21 e
227.09 ± 0.36 e
1477.41 ± 10.61 d
2481.18 ± 13.14 f
6
1 (80)
−1 (50)
1 (100)
19.27 ± 0.14 b
193.84 ± 4.26 g
1456.96 ± 39.44 d
2647.28 ± 6.79 c
7
1 (80)
1 (70)
−1 (50)
18.00 ± 0.08 cd
211.51 ± 5.07 f
1459.01 ± 13.88 d
2583.14 ± 2.46 d
8
1 (80)
1 (70)
1 (100)
15.81 ± 0.04 g
194.16 ± 5.74 g
1173.42 ± 15.80 f
2501.28 ± 1.98 f
9
−1.68 (0)
0 (60)
0 (75)
10.86 ± 0.07 i
149.62 ± 5.40 hi
327.22 ± 0.48 j
1635.70 ± 2.44 k
10
1.68 (100)
0 (60)
0 (75)
16.07 ± 0.22 fg
121.33 ± 4.52 j
1200.98 ± 10.10 f
1819.50 ± 7.48 j
11
0 (50)
−1.68 (40)
0 (75)
17.83 ± 0.02 d
312.12 ± 6.62 c
1370.70 ± 30.51 e
2546.73 ± 12.03 e
12
0 (50)
1.68 (80)
0 (75)
20.38 ± 0.08 a
325.80 ± 2.33 c
1661.67 ± 51.54 c
2783.03 ± 4.12 a
13
0 (50)
0 (60)
−1.68 (30)
20.44 ± 0.12 a
423.14 ± 1.72 a
1317.30 ± 34.57 e
2727.94 ± 13.41 b
14
0 (50)
0 (60)
1.68 (120)
19.27 ± 0.15 b
353.31 ± 9.48 b
2010.83 ± 7.94 a
2765.78 ± 4.29 a
15
0 (50)
0 (60)
0 (75)
18.34 ± 0.07 c
283.35 ± 1.23 d
1843.25 ± 2.69 b
2624.23 ± 12.71 c
2.3 Experimental design
A central composite rotational design (CCRD) was used to determine the best extraction condition of the bioactive compounds in B. excelsa barks. Three factors were used in the experimental design: solvent concentration, temperature and extraction time. Five levels for each factor were used in this CCRD and with triplicate at the centre point. This study was conducted with 15 runs in triplicate, totalling 45 trials. Table 1 shows the independent variables with their coded and real values, as well as the average responses and their respective standard deviations TPC (g GAE 100 g−1, GAE: gallic acid equivalent) and antioxidant activity (AA) by the ABTS, DPPH and FRAP methods.
2.4 Total phenolic content (TPC) and antioxidant activity (AA)
TPC was determined by the Folin-Ciocalteu spectrophotometric method, and the absorbance was measured at 740 nm, using gallic acid as a reference standard. The results were expressed in g GAE 100 g−1 (GAE: gallic acid equivalent, 0 to 250 µL mL−1), according to the methodology described by Singleton et al. (1999).
Antioxidant activity was performed by the ABTS radical scavenging method (2–2′-azino-di-(3-ethylbenzthiazoline sulfonic acid)) as described by Re et al. (1999). Initially, 7 mmol L−1 of ABTS solution reacted with 140 mmol L−1 of potassium persulfate and incubated in the dark at 25 °C for 16 h. After this time, 1 mL ABTS solution was diluted with 60 mL ethanol to obtain an absorbance of 0.70 ± 0.02 at a wavelength of 734 nm. The reaction consisted of 30 μL of the extract with 3 mL of the ABTS solution, and the results were expressed in mM TE g−1 (TE: Trolox equivalent, 10 to 1500 µM).
The scavenging of the DPPH (1,1-Diphenyl-2-picrylhydrazyl) radical was carried out according to the methodology described by Perin et al. (2020). An aliquot of 0.5 mL of the extract and 0.3 mL of the 0.5 mM DPPH ethanolic solution was used in this reaction. The absorbances were read in a spectrophotometer at 517 nm, and the results were expressed in mM TE g−1 (10 to 200 µM).
Finally, the ferric reducing antioxidant power (FRAP) assay was determined, and the FRAP reagent was prepared by mixing 25 mL of 300 mM acetate buffer (pH 3.6), 2.5 mL of 10 mM TPTZ in 40 mM HCl, and 2.5 mL of 20 mM FeCl3 in aqueous solution. An aliquot of 100 mL of the extract was added to 3 mL of the FRAP reagent and maintained in bath water at 37 °C for 30 min. The reducing power of Fe+3 to Fe+2 in the presence of TPTZ was determined according to the methodology proposed by Singleton et al. (1999). The results were obtained in a spectrophotometer at a wavelength of 595 nm and expressed as mM Fe+2 g−1 (100 to 2000 µM).
2.5 Statistical analysis
Statistical analysis was conducted using the statistic software (STATISTICA 8.0). All determinations were carried out in triplicate, and the data was recorded as mean and standard deviation. The data were analysed using a one-way analysis of variance (ANOVA) with a 95% confidence level followed by the Tukey test. The effects were estimated and analysed by the Pareto chart (Supplementary material – Fig. SI 1). Each analysed response generated second-order models, which in turn generated response surface plots (Fig. 1). The quadratic equations are expressed in Supplementary material – Table SI.1. Finally, the global response (GR) was calculated using Eq. (1). The optimal conditions for the evaluated factors were calculated using the partial derivative method.
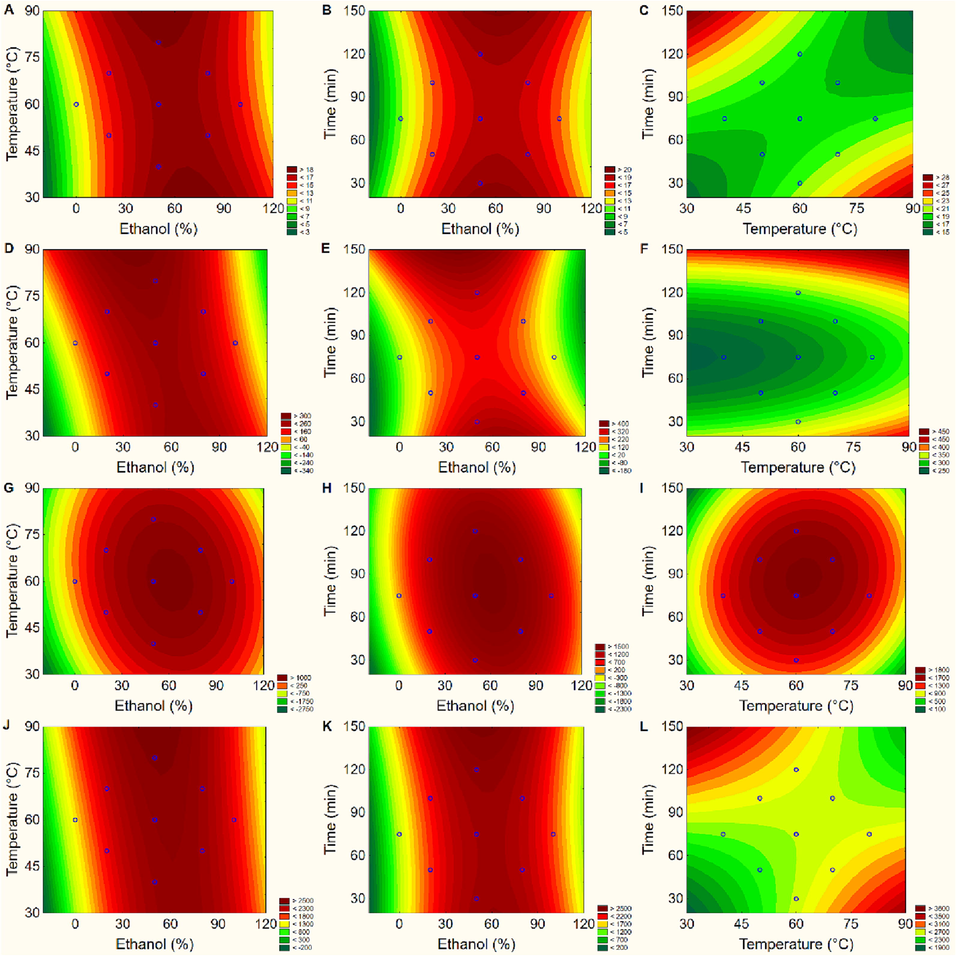
Fitted surface plot obtained from interactions of conditions: ethanol (%), temperature (°C) and time (min) for each variable. A, B and C: Total phenolic content (TPC); D, E and F: Antioxidant activity by ABTS method; G, H and I: Antioxidant activity by DPPH method and J, K and L to FRAP method by Central Composite Rotational Design (CCRD) on Bertholletia excelsa barks.
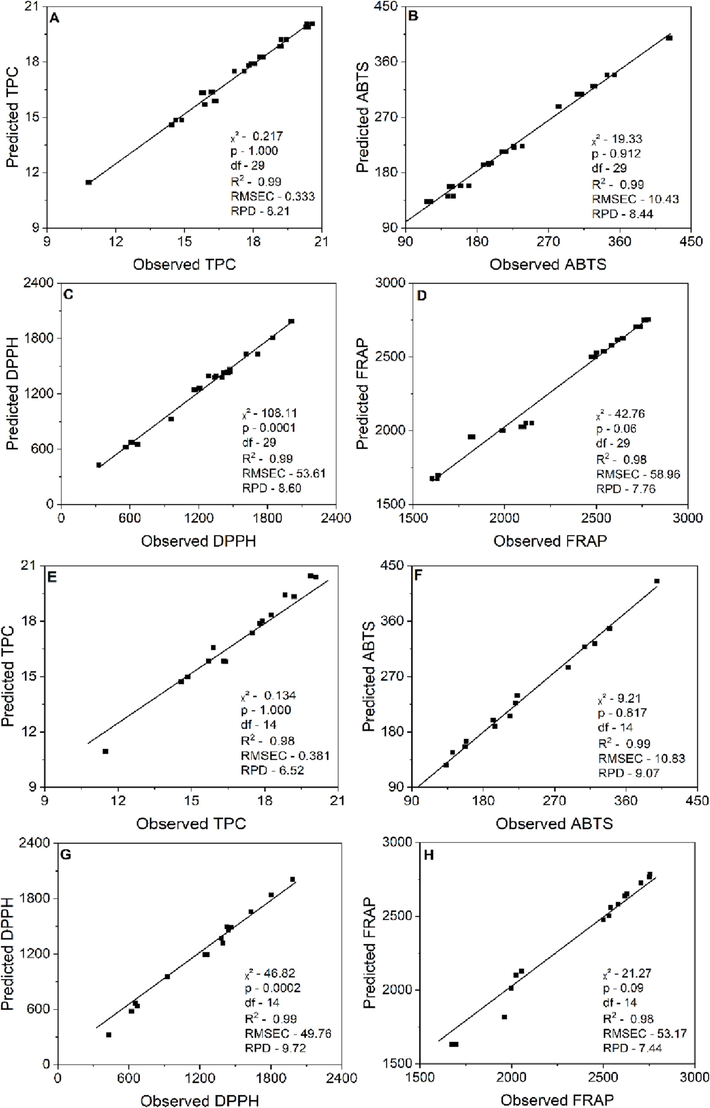
Observed and predicted values of Machine Learning model performance by Random Forest on Bertholletia excelsa barks: A, B, C and D: TPC: Total phenolic content, antioxidant activity by ABTS method and antioxidant activity by DPPH and FRAP methods respectively in the model set. E, F, G and H the respective variables in the validation set. DF: degrees of freedom, R2: coefficient of determination, RMSEC: root mean squared errors of calibration, RPD: residual predictive values.
The performance of the models was evaluated using five statistical indices, namely, coefficient of determination (R2), root mean square error of calibration (RMSEC), residual predictive value (RPD), dependent proportion (SD) and chi-square test (χ2). Predicted versus observed plots were constructed using OriginPro 8.5 software.
2.6 TPC and AA estimation through machine learning (ML)
All assays obtained through experimental design (CCRD), together with TPC and AA responses by ABTS, DPPH and FRAP methods (Supplementary material - Table SI.2), were used for the modelling. The essays of each answer were obtained in a mini-photographic studio, and the digital images were acquired using the Apple iPhone cell phone. Additionally, the parameters used in this analysis were previously reported by the team in Perin et al. (2020) for the standardisation and determination of the conditions such as distance, zoom, angle and lighting. The same CCRD data matrix and responses (TPC, AA) were input for modelling by Random Forest (RF) and PLSR. The dataset was divided for construction (70% of the data) and validation of the models (30% of the data). The models were trained by generating the predicted values for each evaluated response. The performance of each model for each answer was evaluated by the figures of merit mentioned in item 2.5. The observed versus predicted response values for each model and each response (TPC and AA) were plotted on Cartesian axes (Figs. 3 and 4). WEKA 3.8.5 software was used to generate the predictive models through ML, while the Random Forest (RF) algorithm was used to estimate TPC and AA.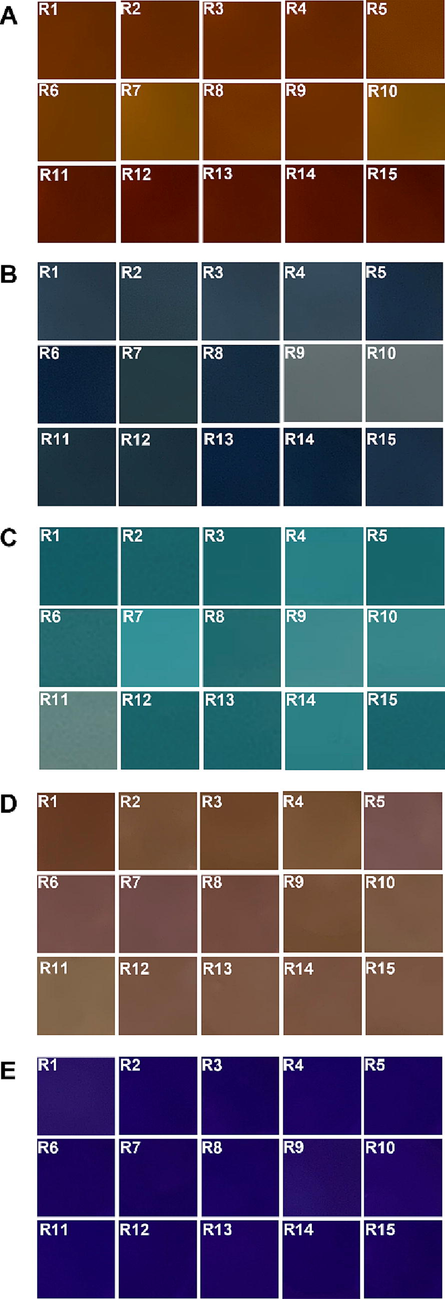
The extracted color pattern of extracts from Bertholletia excelsa barks (A), color pattern along with the reaction medium for testing total phenolic compounds (B), along antioxidant activity measured by ABTS assay (C), DPPH assay (D) and along FRAP assay (E) used for modelling by PLSR corresponding to run R1 to R15, according to central composite rotational design (CCDR).
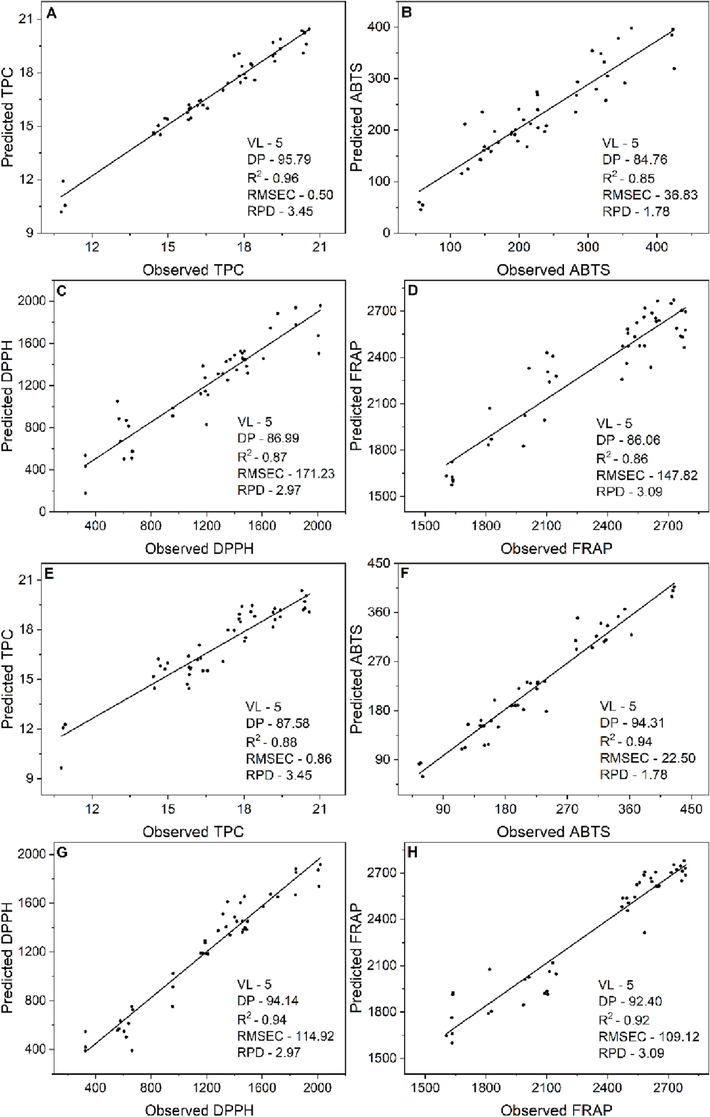
Observed and predicted values of PLSR model and prediction performance on Bertholletia excelsa barks: A, B, C and D: TPC: Total phenolic compounds, antioxidant activity by ABTS method and antioxidant activity by DPPH and FRAP methods respectively in the extract images. E, F, G and H the respective variables in the assay images. NLV: Optimum number of latent variables, DP: dependent proportion, R2: coefficient of determination, RMSEC: root mean squared errors of calibration, RPD: residual predictive values.
2.7 Multivariate calibration by partial least-squares regression (PLSR) models
Partial least-squares regression (PLSR) was used to predict the total phenolic compounds and antioxidant activity by ABTS, DPPH and FRAP methods. Two data matrices were needed to implement the multivariate calibration method by PLSR. Thus, the X matrix was composed of the grayscale values of the digital images, and the Y matrix contained the values obtained through the responses of the spectrophotometric tests. In this way, two approaches were carried out; the first was the images of the extracts (EI) in matrix X and the values of the assay concentrations (TPC and AA) in matrix Y. In the second approach, the X matrix of the assay images (AI) was used, while the Y matrix contained their respective concentrations.
Chemostat® V software was used to extract grey tones and PLSR modelling, while OriginPro 8.5 software was used to obtain the predicted versus observed values graph. The parameters to assess the quality of the model were: root means square error calibration (RMSEC), coefficient of determination (R2), residual predictive value (RPD), degrees of freedom (DF) and the number of latent variables (VL).
3 Results and discussion
3.1 Screening design – TPC and AA analysis
The independent variables selected for this study were solvent concentration (ethanol), time (min) and temperature (°C) extraction. According to Chew et al. (2011), these are the main factors that can influence the extraction of phenolic compounds and the antioxidant activity in plant extracts. The TPC in B. excelsa barks ranged from 10.86 ± 0.007 to 20.44 ± 0.121 g GAE 100 g−1 (Table 1). At the same time, the AA by ABTS and DPPH methods ranged from 57.40 ± 2.48 to 423.14 ± 1.72 and 327.22 ± 0.48 to 2010.83 ± 7.94 mM TE g−1, respectively. Finally, the AA results by the FRAP method went from 1623.61 ± 15.92 to 2783.03 ± 4.12 mM Fe2+ g−1. To date, no other author has reported on the TPC and AA of B. excelsa bark extracts in this extraction condition. Therefore, in the proceeding section, comparisons to other authors' work are limited to those concerning the nut and not the barks from B. excelsa. The TPC obtained in this work for the barks was higher than that of edible Brazil nuts from B. excelsa reported by Maldonado et al. (2020), who found 0.162 g GAE 100 g−1 on Brazilian nut from São João da Baliza, Brazil.
The extracts obtained by runs 12 and 13 of the CCRD showed the highest TPC values and did not present a statistically significant difference between them (p > 0.05). In this study, it was observed that increasing the concentration of water in the extracting solution enabled an improvement in the extraction of compounds with antioxidant activity (AA) in B. excelsa barks. In fact, the binary-solvent system has been reported by several authors (Perin et al., 2020; Sari et al., 2020) as more efficient for the extraction of antioxidant compounds in plant extracts compared to a system with only a single solvent). Additionally, adding water to the organic solvent can increase the bioactive compounds' extraction efficiency because the vegetal material can swell, promoting penetration of the solvent on the sample matrix (Chew et al., 2011).
However, when the concentration of water in the extracting solution was higher than the level corresponding to the central point (50% water and ethanol v/v), these compounds' extraction efficiency decreased. This is possibly due to solvent polarity and solute–solvent bioaffinity (Waszkowiak and Gliszczyńska-Świgło, 2016). The 30 min extraction time in these extracts was enough to extract the largest amount of compounds with antioxidant activity by the ABTS method. Additionally, the extracts obtained with the solvent 50% ethanol/water (v/v) during 120 min of extraction at 60 °C was the ideal condition for extracting compounds with AA by the DPPH and FRAP methods. Furthermore, temperatures above 60 °C indicated greater efficiency in extracting phenolic compounds with antioxidant activity by the three methods.
The antioxidant analysis methodologies can quantify compounds with different polarities. Thus, the ABTS and DPPH methods allow analysis for hydrophilic and lipophilic antioxidants using various radical sources. Additionally, the FRAP and TPC methods are evaluated according to the ability of compounds to reduce their respective reactants. Thus, as the compounds are extracted according to the interactions of the factors, it is possible to quantify them by different methods, making the evaluation more complete and analysing a wide spectrum of compounds with antioxidant potential.
When evaluating the estimation of the effects (Supplementary material - Table SI.2), it was possible to verify that the solvent concentration was the most important factor for the TPC extraction (Supplementary material - Fig. SI.1A) and consequently for the AA of these compounds. In the second-order model (Equation X) for TPC, the linear and quadratic terms were significant (p < 0.05). The time factor also had a significant effect in this model, as well as the solvent X temperature and time X temperature interactions, significantly influencing the extraction processes (Fig. SI.1).
In the analysis of AA by ABTS (Supplementary material - Table SI.2 and Fig. SI.1B), the individual factor solvent concentration was the only factor that had a significant effect, as well as the interactions, solvent concentration X time and solvent concentration X temperature (p < 0.05).
The significant influencing factors for the AA method by DPPH (Supplementary material - Table SI.2 and Fig. SI.1C) were: solvent concentration, temperature (quadratic terms) and time, as well as the interaction of solvent concentration × time (p < 0.05). Finally, the factors that had a significant effect on the FRAP AA method (Supplementary material - Table SI.2 and Fig. SI.1D) were: solvent concentration, temperature (linear terms) and the time × temperature interaction (p < 0.05). In contrast, the other factors and interactions showed no significant influence on the model (p > 0.05).
3.2 Response surface methodology (RSM)
For the TPC analysis, it can be observed that the solvent concentration X temperature interaction (Fig. 1A) showed a more optimised response close to the central point, while the time X temperature interaction (Fig. 1C) showed a tendency to optimise at levels higher, above the centre point. When analysing Fig. 1A and C with the data expressed in Table 1, it appears that the run with the best apparent optimisation for TPC (20.44 g GAE 100 g-1) was obtained with 50% ethanol (v/v) at 60 °C for 30 min of extraction. For the ABTS assay, the most influential factor in optimizing the extraction of the compounds with antioxidant activity was the solvent concentration (Fig. 1D–F), which, under conditions close to the central point, seems to maximise the extraction of these compounds with antioxidant activity. This condition was similar to the temperature factor (Fig. 1F).
Considering the extraction method adopted in this study, these results corroborate those found by Perin et al. (2020) in a study of Calycophyllum spruceanum barks. The authors found that the transfer of mass to the solvent is related to the time and temperature of extraction. However, according to Chew et al. (2011) mass transfer increases with time until the maximum extraction is reached. However, high temperatures can degrade compounds with AA.
The model for DPPH and AA determination showed that the solvent × time interaction was the only significant (p < 0.05) (Fig. 1G–I). This proves and confirms that by the DPPH method, the time factor and the solvent concentration present higher results near the central point. In the FRAP assay (Fig. 1L), the temperature X time interaction was significant, as well as the solvent concentration and temperature factors (p < 0.05) (Fig. 1J, K), (Supplementary material - Table SI 2), evidencing that solvent concentration closer to the central point, and higher temperatures showed better responses. The lack of fit (Table SI 2) for all models was significant (p < 0.05). It denotes that the models would need adjustments. The data were fitted to models using machine learning algorithms (RF and PLSR) to bypass this. This approach showed that the ML models were suitable for the proposed models.
In general, among the evaluated response variables, there was a similar behaviour in relation to solvent concentration, indicating that ethanol concentrations at 50 and 60% are the best conditions for extracting compounds with AA. As for temperature and time, the two factors affect the dependent variables inversely proportional ways. This fact is important and should be considered in these types of research, as high temperatures would lead to ethanol boiling since its boiling point is around 78 °C (Souza et al., 2021). Furthermore, it is essential to note that high extraction temperatures can degrade phenolic compounds with antioxidant potential in plant extracts. In this case, using lower temperatures and longer times to extract bioactive compounds from plants is recommended (Sari et al., 2020).
3.3 Global response (GR) for the dependent variable (TCP, ABTS, DPPH, FRAP)
The global response equation (Eq. (1) was used to determine the general optimal condition for the dependent variables. GR determined that the extraction conditions used in run 13 (50% ethanol, 60 °C and 30 min) can be considered ideal for extracting bioactive compounds in B. excelsa barks. The GR results agree with the results presented and discussed until the current topic. Supplementary material - Table SI.1 shows the values predicted by the model with the data observed in the test results. In this study, the coefficient of determination for TPC was 0.92, indicating that the model can explain 92% of the data variability. These values were evaluated by the Chi-squared test at a significance level of 5%. The results showed no significant difference (p > 0.05) between predicted and observed values for TPC, indicating high model reliability.
The coefficients of determination for the antioxidant activity assays by the ABTS, DPPH and FRAP methods were respectively 0.68, 0.89 and 0.90. However, according to this methodology, only the DPPH test presented a significant Chi-squared test (p < 0.05). This denoted a statistically significant difference between the observed and predicted values when the DPPH test was modelled. Thus, this test was not the most adequate to evaluate the antioxidant activity in B. excelsa bark extracts. Additionally, from the quadratic equations generated by the model (Supplementary material - Table SI.1), it was possible to calculate the best condition for the studied factors (solvent concentration, temperature and extraction time). Thus, applying partial derivatives and subsequent data interpolation to decode the levels was adequate to find the best extraction condition.
These results are represented in Supplementary material - Table SI.3 for each factor studied concerning the dependent variables TPC and antioxidant activity by the ABTS, DPPH and FRAP methods. The best condition for TPC by the method of partial derivatives was with ethanol 58.86%, at a temperature of 63.67 °C during 28.31 min of extraction. When we compare these results with the best run of the experimental design (Run 12, Table 1), we observe that the values are close to the values determined by the equations, evidencing that the optimisation was indeed efficient for TPC.
As for antioxidant activity by the ABTS method, the best values were obtained when 50% ethanol was used at 60 °C temperature for 75 min (Supplementary material - Table SI.3). Likewise, when comparing the results of run 13 (Table 1), we observed that the solvent concentration and extraction temperature also correspond to the results obtained through the equations.
The results obtained experimentally for the optimisation of the model for DPPH were 59.91% ethanol, 60 °C of temperature and extraction time of 81.45 min (Supplementary material - Table SI.3). In our assays, run 14 showed the best response to AA by the DPPH method. In this analysis, the temperature factor was closer to the optimised condition, followed by the solvent concentration factor, which needs a slight adjustment.
The optimal conditions obtained through partial derivatives for the FRAP assay were obtained with 58.58% ethanol, 60 °C and an extraction time of 87.96 min. Run 14, expressed in Table 1, corresponds to these conditions. This result shows that the extraction temperature was the factor that most suited the model, while the solvent concentration factor still needs slight adjustments. The extraction time factor was lower than that used in the experimental model. However, it is worth noting that the time factor was not significant for the model (Supplementary material - Table SI. 1 and Fig. SI. 1). Studies conducted by Gomes et al. (2019) show that the extraction temperature of 60 °C was the most suitable for the extraction of bioactive compounds of solid residue (cake) from Brazil nut. Sartori et al. (2020) obtained results for TPC similar to those obtained in this study with temperatures of 60 °C and ethanol 70% as extraction solvent.
3.4 Predictive modelling for AA and TPC by RF
Machine Learning (ML) is a tool capable of modelling experimental data through computational algorithms. Fig. 2A-H refer to models by Random Forest. The probability calculated by the Chi-squared test for the TPC data showed that there is no statistically significant difference (p > 0.05) between the observed and predicted values by the models (Fig. 2A and E). The coefficient of determination (R2) was 0.99 with DF (degrees of freedom) of 29, indicating that the proposed model explained 99% of the data variability. The value for RMSEC (mean squared error) was 0.333. According to De Carvalho et al. (2019), the RMSEC value indicates the modelling error and the smaller this value, the smaller the error produced by the calibration, making the model more robust. The value for RPD (residual predictive value) was 8.21. RPD above 3 are values that classify the model as reliable (Santos et al., 2019). The Chi-Squared test also checked the predicted and observed values. We observed no statistically significant difference (p > 0.05) between these values for TPC. For this model, the R2 was 0.98. The RMSEC was 0.381 and RPD 6.52 (Fig. 2E). These metrics show the good suitability of the data for the proposed model.
Model results for the ABTS assay for AA are shown in Fig. 2B and F. The chi-squared test was performed to assess whether there was a difference between the observed and predicted values. The results showed no statistically significant difference (p > 0.05) between these values. R2 was 0.99 for full-model and validation models. The values for RMSEC and RPD were respectively 10.43 and 8.44 (full-model) (Fig. 2B). While for the validation model, the values were 10.83 for RMSEC and 9.07 for RPD (Fig. 2F). These metrics also show that the data were adequately adjusted to the proposed models. Results for the DPPH assay are shown in Fig. 2C and G, while the modelling results for FRAP are shown in Fig. 2D and H. According to the Chi-squared test, there was no statistically significant difference between the observed and predicted values for the FRAP models (p > 0.05). In this study, we can verify that the generated models and the obtained metrics attest that the models were adequate. It is also observed that the Random Forest algorithm presented the best metrics of the models compared to PLSR. These results agree with previous studies by Nickel et al. (2017) with European mosses using the Random Forest algorithm, which obtained R2 values between 0.32 and 0.64, with low RMSEC values. In their essays, Fu et al. (2014) identify palmitoylation sites by coupling multi amino acid properties with random forest (RF). These authors reported the superiority of this algorithm as a powerful and effective tool for identifying palmitoylation sites.
3.5 Chemometric model of assay images (AI) and extracts (EI) using partial least squares regression (PLSR)
The chemometric model used in this work is a less conventional approach, but it has gained ground due to its practicality, speed and low cost (Perin et al., 2020). Fig. 3 shows the images of the tests and extracts used in the modelling. In this study, the modelling was carried out using two approaches: in the first one, images of the extracts (EI) were obtained according to the factorial design and the responses of the dependent variables (TPC, ABTS, DPPH and FRAP) were used. In the second approach, the modelling was performed using the trial images (AI) with their respective values for each answer. In this way, Fig. 3A corresponds to the images of the extracts obtained in the experimental planning, which were submitted to regression models using the values obtained in the TPC and AA (EI) tests. Fig. 3B, C, D and E correspond to the model where the images of the extracts were used after the addition of the specific reagent used in each colorimetric test, and the regression was performed with the specific values of each test.
The generated models could correlate the data predicted by the model with the observed values obtained experimentally. The accuracy of models generated by PLSR can be evaluated by their correlation coefficient and error estimates (Fig. 4A–H). The number of latent variables (VL) for each dependent variable was set at 5, keeping the smallest number of LVs possible. According to Santos et al. (2019), the greater the number of VL, the greater the noise, and it is incorporated into the models, decreasing their reliability. The values of R2 (coefficient of determination) for the models were between 0.85 and 0.96.
According to Andrés et al. (2007), to consider a reliable model, the coefficients of determination must be above 0.80; this value is viewed as the limit of reliability in mathematical modelling. The images of the 15 extracts obtained in each CCRD run were used to build the model. Results of the models generated for the variables TPC, DPPH, ABTS and FRAP are shown in Fig. 4A-D. In the EI model for the TPC, the coefficient of determination (R2) was equal to 0.96 and VL equal to 5, while the RMSEC and RPD were respectively 0.50 and 3.45. According to these metrics, the approach using RGB patterns of extracts versus response variables was considered adequate.
The model results for the assay images (AI) for all response variables are shown in Fig. 4E-F. The model for the TPC test is represented in Fig. 4E. In this model, the R2 was 0.88 with 5 VL. At the same time, the RMSEC and RPD metrics were, respectively, 0.86 and 3.45. These values show that the model was adequate and can be used for predictive purposes to determine concentrations of phenolic compounds.
The results for the EI ABTS model are represented in Fig. 4B. The model shows a coefficient of determination (R2) of 0.85, RMSEC of 36.83 and RPD of 1.78. The R2 for the model with the AI in the ABTS test was 0.94, RMSEC of 22.50 and RPD of 1.78 (Fig. 4F). The results for the DPPH assay in the EI approach are represented in Fig. 4C. In this model, the R2 was 0.87, RMSEC of 171.23 and RPD of 2.97. On the other hand, the results for the AI model are represented in Fig. 4G, in which R2 was 0.94 with an RMSEC of 114.92. By evaluating these results, we can verify that the model with AI, mainly for AA by the ABTS and DPPH method, was better than the model obtained by EI. Finally, the modelling was performed for the FRAP test and the two approaches (EI and AI). The results for FRAP for the EI approach are represented in Fig. 4D. In this model, R2 of 0.86 and RMSEC of 147.82 were obtained. For the AI approach (Fig. 4H), the R2 value was 0.92 and 109.12 for RMSEC. Both approaches obtained an RPD value of 3.09 using five latent variables. The results were generally efficient for all tests, except for the ABTS test. However, as previously noted, the ABTS, FRAP and DPPH assays were slightly more efficient in the approach using AI with its respective concentration. In contrast, the EI approach proved to be more efficient for the TPC assay. These differences in the models using EI or AI may be related to the grey tones of the RGB channels. In the case of the extracts, only a slight difference in the shade of the green colour may not be enough to capture the differences present in the AA or TPC. On the other hand, when AI is used, the colour differences in each type of test are more pronounced and adequate to justify the fit of the best predictive models.
4 Conclusion
Optimising extraction conditions for compounds with antioxidant activity from B. excelsa barks was possible using CCRD. In this approach, it was possible to determine that the solvent was the most important factor, and it affects antioxidant activity by the ABTS, FRAP and DPPH assays, as well as the content of total phenolic compounds (TPC) present in the plant extract. In addition to classical methodologies, this work presents other new proposals to determine antioxidant activity and TPC in B. excelsa barks. These new methodologies were developed by concatenating visible spectroscopy with computer vision through machine learning algorithms. Algorithms applied by Machine-Learning (ML), Random Forest (RF) and Partial Least-Square Regression (PLSR) can be used to determine the antioxidant capacity of bioactive compounds. In fact, all the results of the models evaluated by their metrics that attest to their quality proved to be adequate and promising. Still, we can mention that our article is the first research that uses images of extracts of B. excelsa and assays. In this way, the new approaches reported in this work can serve as a basis for other studies, as such strategies reveal the antioxidant potential of natural products.
Acknowledgements
The authors gratefully acknowledge the technical and financial support of the Brazilian National Research Council (CNPq), and Coordination for the Improvement of Higher Level Personnel (CAPES). We thank for Fonte Clara Ind. & Com. de Produtos Naturais LTDA of Pato Branco, Paraná State, Brazil for providing the B. excelsa barks.
Declaration of Competing Interest
The authors declare that they have no known competing financial interests or personal relationships that could have appeared to influence the work reported in this paper.
References
- Phenolic compounds: Current industrial applications, limitations and future challenges. Food Funct.. 2021;12:14-29.
- [CrossRef] [Google Scholar]
- Optimisation of the extraction process of polyphenols from cashew apple agro-industrial residues. Food Sci. Technol.. 2015;35:354-360.
- [CrossRef] [Google Scholar]
- Prediction of sensory characteristics of lamb meat samples by near infrared reflectance spectroscopy. Meat. Sci.. 2007;76:509-516.
- [CrossRef] [Google Scholar]
- Caracterização físico-química dos frutos de castanheira do Brasil. Nativa. 2016;4:107-111.
- [Google Scholar]
- Trypanocidal activity of extracts and fractions of Bertholletia excelsa. Fitoter. 2005;76:26-29.
- [CrossRef] [Google Scholar]
- Effect of ethanol concentration, extraction time and extraction temperature on the recovery of phenolic compounds and antioxidant capacity of Centella asiatica extracts. Int. Food Res. J.. 2011;18:571-578.
- [Google Scholar]
- Plant secondary metabolites: An opportunity for circular economy. Molecules. 2021;26:495.
- [CrossRef] [Google Scholar]
- Identification of bioactive metabolites from corn silk extracts by a combination of metabolite profiling, univariate statistical analysis and chemometrics. Food Chem.. 2021;365:130479
- [CrossRef] [Google Scholar]
- Polyphenols: A concise overview on the chemistry, occurrence, and human health. Phytother. Res.. 2019;33:2221-2243.
- [CrossRef] [Google Scholar]
- Accurate mapping of Brazil nut trees (Bertholletia excelsa) in Amazonian forests using WorldView-3 satellite images and convolutional neural networks. Ecol. Inform.. 2021;63:101302
- [CrossRef] [Google Scholar]
- Combining random forest with multi-amino acid features to identify protein palmitoylation sites. Chemometr. Intell. Lab. Syst.. 2014;135:208-212.
- [CrossRef] [Google Scholar]
- Microencapsulated Brazil nut (Bertholletia excelsa) cake extract powder as an added-value functional food ingredient. LWT - Food Sci. Technol.. 2019;116:108495
- [CrossRef] [Google Scholar]
- Rapid and non-destructive determination of drip loss and pH distribution in farmed Atlantic salmon (Salmo salar) fillets using visible and near-infrared (Vis-NIR) hyperspectral imaging. Food Chem.. 2014;156:394-401.
- [CrossRef] [Google Scholar]
- Predicting micronutrients of wheat using hyperspectral imaging. Food Chem.. 2021;343:128473
- [CrossRef] [Google Scholar]
- Phenolic compounds and antioxidant activity of Brazil nut (Bertholletia excelsa) J. Funct. Foods. 2010;2:196-209.
- [CrossRef] [Google Scholar]
- A comprehensive review: Machine learning and its application in integrated power system. Energy Rep.. 2021;7:5467-5474.
- [CrossRef] [Google Scholar]
- Estimating the sensory qualities of tomatoes using visible and near-infrared spectroscopy and interpretation based on gas chromatography–mass spectrometry metabolomics. Food Chem.. 2021;343:128470
- [CrossRef] [Google Scholar]
- Use of Random forest in the identification of important variables. Microchem. J.. 2019;145:1129-1134.
- [CrossRef] [Google Scholar]
- Determination of total phenolic compounds, antioxidant activity and nutrients in Brazil nuts (Bertholletia excelsa H. B. K.) J. Med. Plant Res.. 2020;14:373-376.
- [CrossRef] [Google Scholar]
- Modelling and mapping heavy metal and nitrogen concentrations in moss in 2010 throughout Europe by applying Random Forests models. Atmos. Environ. 2017;156:146-159.
- [CrossRef] [Google Scholar]
- RGB pattern of images allows rapid and efficient prediction of antioxidant potential in Calycophyllum spruceanum barks. Arab. J. Chem.. 2020;13:7104-7114.
- [CrossRef] [Google Scholar]
- Determination of tetracycline hydrochloride by terahertz spectroscopy with PLSR model. Food Chem.. 2015;170:415-422.
- [CrossRef] [Google Scholar]
- Convenient use of near-infrared spectroscopy to indirectly predict the antioxidant activitiy of edible rose (Rose chinensis Jacq “Crimsin Glory” H.T.) petals during infrared drying. Food Chem.. 2022;369:130951
- [CrossRef] [Google Scholar]
- Antioxidant activity applying an improved ABTS radical cation decolorisation assay. Free Radic. Biol. Med.. 1999;26:1231-1237.
- [CrossRef] [Google Scholar]
- Chemometrics in analytical chemistry – an overview of applications from 2014 to 2018. Eclética Quím. J.. 2019;44:11-25.
- [Google Scholar]
- Extraction of phenolic compounds from Tabernaemontana catharinensis leaves and their effect on oxidative stress markers in diabetic rats. Molecules. 2020;25:2391.
- [CrossRef] [Google Scholar]
- Brazil nuts: nutritional benefits from a unique combination of antioxidants. J. Food Bioact.. 2020;9:36-39.
- [CrossRef] [Google Scholar]
- Analysis of total phenols and other oxidation substrates and anitoxidants by means of Folin-Ciocalteu reagent. Meth. Enzymol.. 1999;299:152-178.
- [CrossRef] [Google Scholar]
- Simulation of the extractive distillation process to produce anhydrous ethanol using ethylene glycol as a separating agent. Res. Soc. Dev.. 2021;10
- [CrossRef] [Google Scholar]
- A comparison of random forest variable selection methods for classification prediction modeling. Expert. Syst. Appl.. 2019;134:93-101.
- [CrossRef] [Google Scholar]
- Propolis authentication of stingless bees by mid-infrared spectroscopy and chemometric analysis. LWT - Food Sci. Technol.. 2022;161:113370
- [CrossRef] [Google Scholar]
- Rapid prediction of phenolic compounds and antioxidant activity of Sudanese honey using Raman and Fourier transform infrared (FT-IR) spectroscopy. Food Chem.. 2017;226:202-211.
- [CrossRef] [Google Scholar]
- Optimisation of green and rapid analytical procedure for the extraction of patulin in fruit juice and dried fruit samples by air-assisted natural deep eutectic solvent-based solidified homogeneous liquid phase microextraction using experimental design and. Food Chem.. 2021;358:129817
- [CrossRef] [Google Scholar]
- Binary ethanol–water solvents affect phenolic profile and antioxidant capacity of flaxseed extracts. Eur. Food Res. Technol.. 2016;242:777-786.
- [CrossRef] [Google Scholar]
- Investigation of major and trace elements and their distributions between lipid and non-lipid fractions in Brazil nuts by inductively coupled plasma atomic optical spectrometry. Food Chem.. 2008;111:1012-1015.
- [CrossRef] [Google Scholar]
- Extraction, characterisation and antioxidant activities of polysaccharides from E. corneum gigeriae galli. Carbohydr. Polym.. 2014;108:247-256.
- [CrossRef] [Google Scholar]
- Antioxidant and antiproliferative activities of common edible nut seeds. LWT - Food Sci. Technol.. 2009;42:1-8.
- [CrossRef] [Google Scholar]
Appendix A
Supplementary material
Supplementary data to this article can be found online at https://doi.org/10.1016/j.jksus.2023.102792.
Appendix A
Supplementary material
The following are the Supplementary data to this article:


