

Translate this page into:
Aberrant expression of miR-143/miR-223/miR4478 and miR145 as prognostic factor for colorectal cancer patients
⁎Corresponding author at: Department of Medicine, medical school, Georgian American University, Tbilisi, Georgia. rhadeq239@gua.edu.ge (Rana Alhadheq)
-
Received: ,
Accepted: ,
This article was originally published by Elsevier and was migrated to Scientific Scholar after the change of Publisher.
Abstract
Colorectal cancer (CRC) is a type of malignancy that develops in the colon or rectal region. It develops due to abnormal growth and proliferation of cells in the lining of the colon, forming a tumor. This study included tissue samples (56 malignant and 56 matched normal samples). miRNAs were determined and retrieved from miRBase database and moderated by p53 gene. Expression levels of miRNA were varied. Only miR-223 revealed greater expression than normal matched tissue. mMiR-143, miR-4478, and miR-145 exhibited lower expression than matched normal tissue. Only miR-143 and miR-145 showed considerable variations in the expression among groups while miR-4478 did not demonstrate statistically substantial difference. In conclusion, this study highlights that upregulation of P53 and miR-223 and downregulation of miR-145 and miR-143 were associated with cancer advancement and unfavorable prognosis in Saudi CRC patients, indicating P53, miR-223, miR-145 and miR-143 to be novel and valuable signatures for predicting the outcomes for patients with CRC.
Keywords
Colon
Cancer
P53
miR
Gene Expression

1 Introduction
Colorectal cancer (CRC) arises from abnormal growth and multiplication of cells in the lining of the colon. This type of cancer ranks as the third most common cancer worldwide (Hadjipetrou et al. 2017; Rawla, et al., 2019). It can be influenced by a range of causal factors such as interplay of diverse genetic, environmental, and lifestyle factors (Marino et al., 2024). One significant category of CRC cases is sporadic cases, which are not hereditary and prevail predominantly. These cases typically result from errors in DNA that occur spontaneously during cellular processes like proliferation, differentiation, apoptosis (Alhadheq Abdullah et al., 2023). Cells contain genetic material that includes coding and non-coding genes, coding genes control the production of proteins which have specific roles in the cells. Dysfunctional or mutated genes may lead to abnormality as uncontrolled cell division (Adjiri, 2017). Annually, around 1.24 million cases have been identified related to CRC while around 40,000 deaths occurs worldwide (Ferlay et al. 2015). According to scientific report (2021), advancements in treatments have led to decrease death rate in recent decades. In Saudi Arabia, CRC ranks as a second constituting approximately nine percent of the recent cases, standing first in the male and third among the female population(Alsanea et al. 2015). Roughly 1 out of every 23 men and 1 out of every 25 women are expected to receive a diagnosis of CRC (Miller et al. 2019). Beyond gender, age and race/ethnicity markedly increase the odds of disease susceptibility (Hossain et al. 2022). Despite advancements in diagnosis and treatment modalities, the prognosis for CRC patients remains guarded, necessitating continued efforts to unravel novel prognostic markers and therapeutic targets. MicroRNAs (miRNAs) have emerged as pivotal regulators of gene expression, orchestrating various cellular processes including proliferation, apoptosis, differentiation, and metabolism (Divisato et al., 2020). Dysregulation of miRNAs has been involved in the progression of numerous malignancies, contributing to initiation of tumor, development, and metastasis (Hussen et al., 2021). One gene frequently mutated in CRC is p53, this gene is activated via different stress signals, including oncogene activation. p53 mutations in cancer abrogate the ability of mutant p53 and confer new oncogenic properties and may actively promote carcinogenesis (Liebl and Hofmann, 2021). Aberrant miRNA expression profiles have been extensively documented in CRC, underscoring their potential as diagnostic, prognostic, and therapeutic biomarkers. MicroRNAs (miRNAs) play critical roles in the regulation of gene expression. They are involved in various cellular processes. In the context of CRC, miRNAs have emerged as key players in the pathogenesis and progression of the disease. Aberrant expression of specific miRNAs can contribute to tumor initiation, growth, and metastasis by regulating oncogenes and tumor suppressor genes. Understanding the role of miRNAs in CRC can lead to development of novel therapeutic strategies and improve patient outcomes (Zhou and Wang 2010). Among the myriad of dysregulated miRNAs in CRC, miR-143, miR-223, miR-4478, and miR-145 have garnered considerable attention for their multifaceted roles in tumorigenesis and cancer suppression across diverse cancer types. miR-143 has been implicated in CRC as a tumor suppressor, modulating key signaling pathways involved in cell proliferation, migration, and invasion (Abd El Fattah et al., 2023). Similarly, miR-223, has been shown to exert tumor-suppressive effects in CRC by targeting various oncogenic signaling cascades (Liu et al., 2021; Wang et al., 2021a). Furthermore, miR-4478 has been implicated in CRC pathogenesis through its regulatory effects on critical cancer-related genes (Wang et al., 2020). Conversely, miR-145 is frequently downregulated in CRC and is recognized as a potent tumor suppressor, governing diverse cellular processes including epithelial-mesenchymal transition (EMT), angiogenesis, and drug resistance (Guzel Tanoglu and Ozturk, 2021; Sachdeva and Mo, 2010; Zou et al., 2012). While the individual roles of miR-143, miR-223, miR-4478, and miR-145 in CRC have been elucidated their collective significance as prognostic markers still to be completely explained. Understanding the interplay between these miRNAs and their intricate regulatory networks in CRC pathogenesis holds promise for new prognostic models and targeted therapeutic strategies. In this study, we utilized the GEO database for miRNA differential expression analysis and identified the assessed miRNAs as differentially expressed. For validation purposes, we selected miRNAs based on their significant differential expression and their relevance as highlighted in the literature. This approach ensured a focused and meaningful validation process for our study. The objective of current research study was to investigate the abnormal expression patterns of miR-143, miR-223, miR-4478, and miR-145 in CRC and their prognostic implications for patient outcomes.
2 Methods
2.1 Study population
We obtained 112 tissue samples: 56 CRC tissues and 56 corresponding normal colorectal tissue samples, sourced from King Khalid University Hospital in Riyadh, Saudi Arabia. Clinical data, including age, family history, gender, and tumor location, were recorded (Alhadheq Abdullah et al., 2023). Participant ages ranged from 23 to 88 years. Each contributed tissue sample was preserved in RNAlater® solution. Ethical approval was granted by King Saud University's medical college ethics committee, ensuring compliance with ethical standards.
2.2 Total RNA isolation and quality
Total RNA extraction was carried out for 56 CRC tissues and 56 corresponding normal colorectal tissue samples, following the manufacturer's guidelines with a Qiagen RNA extraction Kit. 10 µl β-ME (β-mercaptoethanol) and 350 µl RLT (lysis buffer) were added to 20 mg of each tissue and then homogenized by using the Medic Tools Dispomix Drive. 350 μl RLT lysis buffer was added for each sample tube. Afterwards, 1x of 70 % ethanol 350 μl was added which was mixed immediately by vertex. After mixing, 700 µl was shifted to the Kit columns and 700 µl of washing buffer and 500 µl RPE (twice) were added in each loading with subsequent centrifugation at 8000 rpm for two minutes, respectively. Next, 50 µl of elution buffer was added to each sample and centrifugation was performed at 8000 rpm for about 1 min. The extracted samples were stored at −20°C. The quantification of RNA isolated from tissue specimens was carried out through measuring optical density at 260 nm (OD260) and 280 nm (OD280) using a NanoDrop 1000 spectrophotometer (Peqlab Biotechnologie GmbH, Erlangen, Germany). Examination of RNA integrity (RIN) was conducted by means of Agilent 2100 Bioanalyzer (Agilent Technologies GmbH, Waldbronn, Germany) as well as with RNA 6000 series II Nano LabChip analysis kit.
2.3 Synthesis of cDNA
The process of converting RNA into cDNA was executed using a high-capacity cDNA reverse transcription kit (Applied Biosystems, Warrington, USA) as per manufacturer's provided instructions. Specifically, 10 µl of the master mix from the cDNA reverse transcription kit was thoroughly combined with 1 µg of pristine RNA sourced from the isolated samples. The resulting mixtures were then exposed to cDNA synthesis within a MasterCycler Gradient Eppendorf. The procedural steps encompassed an initial incubation of 10 mints at temperature 25 °C, accompanied by 2 hrs at temperature 37 °C, and a final phase of 5 mints at 85 °C to ensure optimal cDNA generation. The resultant cDNA was appropriately preserved at −20 °C for subsequent use.
2.4 P53 mRNA quantification
Gene expression analysis was conducted using quantitative RT–PCR in triplicate, employing TaqMan gene expression assay Hs01034249 from Applied Biosystems. The GAPDH gene (Hs02758991g1) served as the internal control. Each qPCR reaction (20 μl) consisted of 2 μl of 1 µg cDNA template, Universal TaqMan MasterMix (2x concentrated, Life Technologies), TaqMan assay (20x concentrated, Life Technologies), and H2O. The reactions were conducted using the 7500 Fast Real-Time PCR System (Life Technologies). The qPCR reactions, performed thrice, involved initial incubation at 50 °C for 2 mints, accompanied by denaturation for 10 mints at 95°C. Subsequently, 40 rounds of denaturation at similar temperature for 15 sec and annealing/extension for one minute at 60 °C were executed. Non-template controls were systematically incorporated as controls (negative) in each experimental run. Relative RNA quantities were determined utilizing ΔΔCT. To normalize gene expression data, the GAPDH gene was employed, and mean expression in the tumor and normal samples was matched, expressed as an n-fold ratio.
2.5 Characterization of miRNAs regulated by p53
In present research, we sought to determine microRNAs (miRNAs) that are moderated by p53 gene by leveraging the principle of sequence complementarity. The known miRNA mature sequences were retrieved from miRBase database. The interaction between P53 and miRNAs is crucial for understanding the regulatory network in cancer and other bioprocesses. The seed region typically consists of nucleotides 2–7 or 2–8 of the miRNA, which are imperative for target recognition. We developed an in-house Perl program to identify miRNAs bound by P53, aimed at seed region's complete matching criteria to enhance the accuracy of predictions.
2.6 Statistical analysis
The target sample size was determined utilizing PS software (Power and Sample Size Calculation Software Package, Vanderbilt University, Nashville, TN). P < 0.05 was considered statistically significant. Mann-Whitney U test was performed to analyze the association between gene expressions.
3 Results
3.1 Influence of p53 on the growth and advancement of human CRC
To explore the effect of p53 gene expression alterations in human CRC, we conducted a comparative analysis between healthy individuals and those with tumors. To assess differences in p53 gene expression, we employed GAPDH as a reference gene in both groups to estimate the fold-change in p53 gene expression. In the healthy group, the mean value of expression for p53 gene was 31.66 ± 1.51, and it was 20.07 ± 0.82 for GAPDH gene. Conversely, in the cancer group, the mean expression value for the p53 gene was 30.62 ± 1.97, and for the GAPDH gene, it was 19.27 ± 0.88. To mitigate bias in the fold change values, we normalized each gene's value by dividing it by the average group fold change value. The normalized fold change value for the normal group ranged from 0.06 to 8.54. However, the range was significantly higher in tumor group which was 0.04 to 52.66. Our initial observation reveals that the expression bias in p53 potentially responsible for growth and development of human CRC. This is underscored by the apparent higher p53 gene expression pattern among the groups, showing nearly a 2-fold induction (P value; 0.02), as displayed in Fig. 1.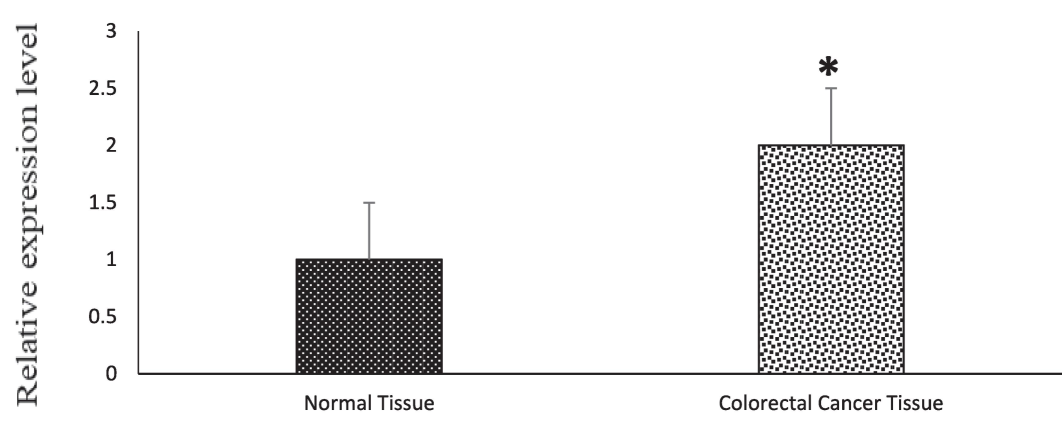
P53 gene expression level among normal tissue and CRC tissue. Expression levels were statistically compared with a paired Student’s t test (* p < 0.05).
3.2 Detection and analysis of p53-regulated microRNAs (miRNAs)
In our quest to unveil miRNAs showcasing altered expression patterns triggered by p53 activation within CRC, we embarked on a comprehensive genome-wide miRNA expression analysis utilizing the GEO dataset GSE67181. The dataset's contributor utilized doxycycline as an inducer to prompt p53 expression in CRC. Leveraging the robust capabilities of edgeR, we meticulously identified miRNAs exhibiting differential expression concerning p53 activation in this cellular context. Our investigation unveiled 400 miRNAs displaying significantly differential expression. Notably, eight miRNAs stood out with remarkable statistical significance, as underscored by their p-values, while also exhibiting logFC values exceeding 2 or falling below −2, as outlined in Table 1. These findings shed light on potential miRNA candidates intricately associated with the regulatory network modulated by activation of p53 in CRC, offering valuable comprehension into the molecular mechanisms driving cancer growth and development. To evaluate the binding affinity of differentially expressed miRNAs with p53, we retrieved the gene sequence along with its 500 base pairs upstream and 500 base pairs downstream. Each mature miRNA sequence was individually aligned with these genomic sequences. Our alignment analysis uncovered specific mismatch patterns between the miRNAs and the p53 gene sequence. Specifically, has-miR-143 exhibited 7 mismatches, hsa-miR-145 had 6 mismatches, hsa-miR-200b displayed 8 mismatches, hsa-miR- 200c showed 9 mismatches, hsa-miR-205 presented 9 mismatches, hsa-miR-223 demonstrated 8 mismatches, hsa-miR-34a indicated 8 mismatches, and hsa-miR-4478 featured 8 mismatches with the p53 gene sequence (Fig. 2). *CCC: Colorectal cancer cells *FC: Fold change.
miRs
p53 activated CCC
Normal CCC
FC
log2FC
hsa-miR-143
2301.94
346.5
6.643405
2.731923
hsa-miR-145
94.2
0
95.2
6.57
hsa-miR-200b
831.69
22026.17
0.04
−4.73
hsa-miR-200c
199.17
0
200.17
7.65
hsa-miR-205
488.52
0
489.52
8.94
hsa-miR-223
101.94
1743.5
0.058469
−4.09619
hsa-miR-34a
1053.74
0
1054.74
10.04
hsa-miR-4478
194.2
10
19.42
4.279471
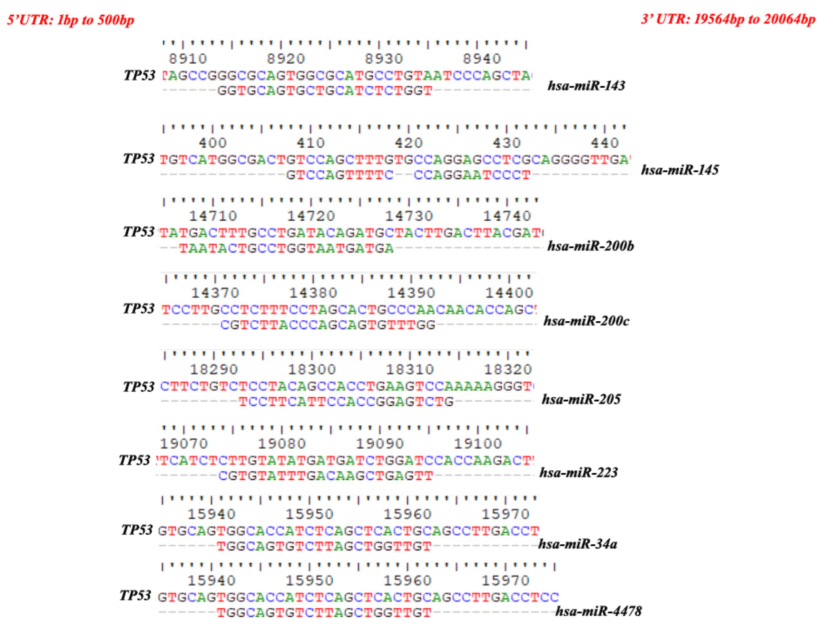
Analysis of the alignment between the p53 gene sequence and differentially expressed miRNAs.
3.3 Expression levels of miR-143, miR-4478, miR-223, and miR-145 in CRC with p53 mutations
We compared miRNAs expression between two distinct groups: one is representing normal tissue while another representing tumor tissue. To derive meaningful insights, we utilized the small noncoding RNA RNU6B as a reference gene to estimate the values of fold change in all miRNA for each sample in both groups. Upon analysis, we noticed that average expression of miR-145, after normalization with the normal group, was 0.52 in test group, indicating that miR-145 exhibited greater expression in control group than tumor group. Further examination of the normalized fold-change values revealed a range of 0.14 to 9.86 for control and 0.07 to 6.70 for test group. To analyze the statistical importance of variations in miR-145 expression between these groups, we conducted a Student t-test. miR-145 expression analysis showed that p-value less than 0.05, suggesting significant results, as demonstrated in Fig. 3. Additionally, the average expression of miR-223, after normalization with the normal group, was 2.02 in the tumor group, indicating higher expression in the tumor group compared to the normal group. The normalized fold change values for miR-223 ranged from 0.03 to 9.88 for the normal group and 0.01 to 12.84 for the tumor group. The Student t-test unveiled a significant result with p-value less than 0.05, as illustrated in Fig. 4. These investigations support that miR-223 overexpression might play an important role in CRC with p53 mutations. Similarly, for miR-143, we observed an average expression of 0.6 in test group, signifying higher miR-143 expression in control group. The normalized fold change values for miR-143 noticed from 0.04 to 5.41 for normal group and 0.02 to 3.3 for tumor group (test group). The Student t-test demonstrated a statistically significant result (p < 0.05) (Fig. 5). Finally, we investigated miR-4478, which exhibited an average expression of 0.33 in control group and 0.24 in the tumor group, implying greater expression in the normal group. The normalized fold change values for miR-4478 ranged from 0.01 to 2.57 for the normal group and 0.02 to 0.81 for the tumor group. Unlike miR-223, miR-145, and miR-143, the t-test results suggested no notable difference between two groups regarding miR-4478 expression (Fig. 6). Notably, miR-223, miR-145, and miR-143 exhibited statistical significance, meaning that there is a difference between two groups, while miR-4478 did not show significant findings. These results underscore the crucial role of miR-223, miR-145, and miR-143 in CRC development.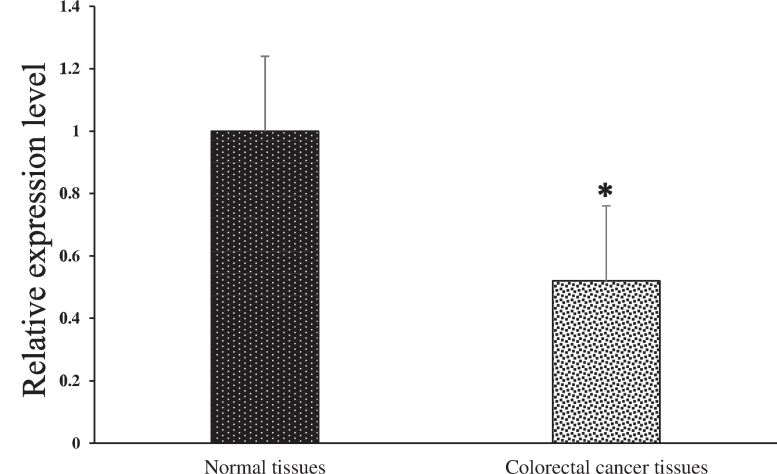
The expression of miR-145 was determined by quantitative real-time PCR in paired human colorectal cancer and adjacent normal tissues. Expression levels were statistically compared with a paired Student’s t test (* p < 0.05).

The expression of miR-223 was determined by quantitative real-time PCR in paired human colorectal cancer and adjacent normal tissues. Expression levels were statistically compared with a paired Student’s t test (* p < 0.05).
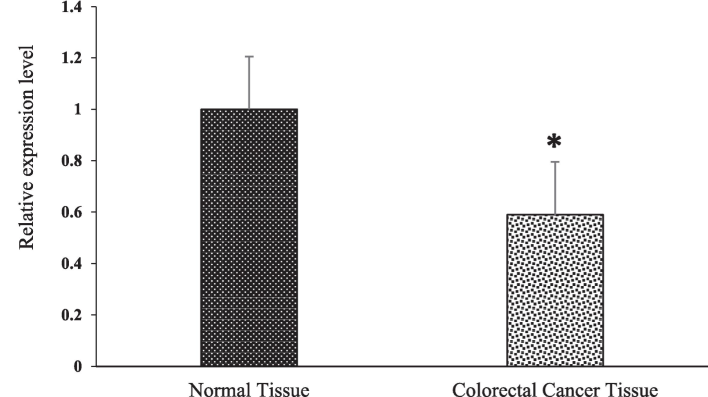
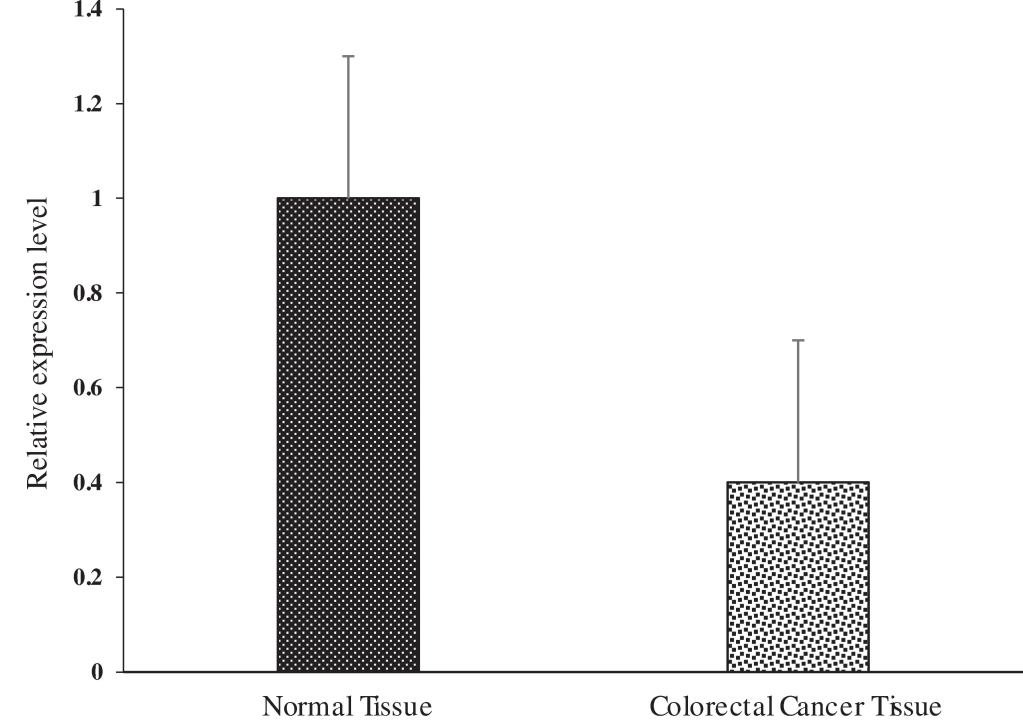
The expression of miR-143 was determined by quantitative real-time PCR in paired human colorectal cancer and adjacent normal tissues. Expression levels were statistically compared with a paired Student’s t test (*p < 0.05).
The expression of miR-4478 was determined by quantitative real-time PCR in paired human colorectal cancer and adjacent normal tissues Expression levels were statistically not significant compared with a paired Student’s t test.
3.4 Association between miRNA expression level and clinicopathological characteristics
The relationship between miRNA expression levels and clinicopathological characteristics is displayed in Table 2. Notably, advance age effect was significantly associated with higher miR-223 expression levels (p-value 0.04) and tumor location (p-value 0.01). However, no significant association was observed between miRNA expression levels and other clinicopathological factors, including age (P = 0.12) and TNM stage (P = 0.19). Interestingly, miR-145 and miR- 143 did not demonstrate any significant associations with clinicopathological characteristics.
Clinicopathological factors
Cases number
miR-145 expression level
miR-143 expression level
miR-223 expression level
Low (n = 28)
High (n = 28)
P value
Low (n = 28)
High (n = 28)
P value
Low (n = 32)
High (n = 24)
P value
Age
<56 years
26
12
14
0.59
15
11
0.28
12
14
0.12
≥56 years
30
16
14
13
17
20
10
Gender
Male
31
14
17
0.42
12
19
0.06
14
17
0.04
Female
25
14
11
16
9
18
7
Tumor Location
Colon
34
15
19
0.27
18
16
0.58
15
19
0.01
Rectum
22
13
9
10
12
17
5
TNM stage
I/II
29
14
15
0.79
16
13
0.4
19
10
0.19
III
27
14
13
12
15
13
14
3.5 Impact of miRNA expression on prognosis of CRC
As shown in Table 3, the results of univariate and multivariate analyses assessing various prognostic parameters in individuals with CRC. The multivariate analysis, conducted with a Cox proportional hazards model, confirmed that low levels of miR-145 expression (HR = 3.54, 95 % CI: 1.95 – 9.86, P = 0.011) and miR-223 (HR = 2.91, 95 % CI: 1.51 – 8.62, P = 0.0005) were significant independent predictors of poor survival in CRC. HR: Hazard Ratio, P: P-Value.
Variables
Univariate analyses
Multivariate analyses
HR
95 % CI
P
HR
95 % CI
P
Age
1.34
0.83 – 4.5
0.28
1.28
0.72 – 4.01
0.39
Gender
1.86
1.02 – 4.89
0.07
1.94
1.25 – 5.12
0.06
Tumor Location
2.47
1.23 – 7.21
0.028
2.54
1.37 – 7.88
0.022
TNM stage
1.72
0.84 – 3.98
0.13
1.62
0.78 – 3.87
0.10
miR-145 level
2.69
1.52 – 8.32
0.019
3.54
1.95 – 9.86
0.011
miR-143 level
1.51
0.79 – 3.99
0.42
1.34
0.72 – 3.62
0.47
miR-223 level
3.31
1.54 – 8.73
0.0006
2.91
1.51 – 8.62
0.0005
4 Discussion
Tumor suppressor protein (p53) is vital for maintaining genomic integrity and preventing oncogenic transformation by regulating DNA repair, cell cycle, and cell development. Inactivation of p53 is frequently observed in many cancers, including CRC, resulting in loss of genome integrity (Zhou et al. 2014; Liebl and Hofmann, 2021). In our study, we conducted a comprehensive investigation into miRNAs expression profiles and its prognostic importance in CRC cases (Elsaid et al. 2019). Our findings elucidate several key aspects that enhance our understanding about molecular mechanisms driving CRC pathogenesis and progression. In human cancers, the p53 gene is commonly mutated (Kandoth et al. 2013). Prior research suggests that p53 expression serves as a reliable indicator of p53 gene mutation, detecting up to 75 % of tumors with confirmed gene mutations (Kapiteijn et al. 2001). Additionally, another study has reported a concordance rate of up to 94 % between p53 expression and the mutation status of the p53 gene as determined by a molecular study (Servomaa et al. 2000). Therefore, our results indicate that the expression bias in p53 contributed to the advancement or escalation of human CRC by promoting substantial proliferation, forming metastases, and inducing drug resistance (Muller and Vousden 2014). Abnormal expression of the p53 protein can lead to uncontrolled cell growth and the development of tumors (Kmet et al., 2003). Another study has investigated the prognostic significance of p53 expression in CRC. The result of this study has shown that patients with tumors that have high levels of p53 expression have a worse prognosis than patients with tumors that have low levels of p53 expression (Lanza et al., 1996). This is likely due to the fact that mutant p53 proteins can promote tumor progression and metastasis. In the context of our objectives, we evaluated the p53 gene expression pattern in both normal and tumor tissues. We observed a slight downregulation of p53 expression in CRC tissues. This observation aligns with findings of the existing literature, where the prevalence of p53 expression in CRC is reported to range from 27 % to 76 % (Tejpar et al. 2010). However, when normalized to account for potential bias in fold change values, the range of p53 expression was significantly higher in the tumor group compared to the normal group. This observation implies that the expression bias in p53 could contribute to the development or progression of CRC. Likewise, research conducted by Aladhraei et al., 2019 demonstrated the presence of positive p53 expression and its association with CRC in Yemeni patients. However, our independent samples t-test comparing p53 gene expression between the normal and tumor group suggests that there was no statistically significant difference in the means of p53 gene expression between these two groups. Notably, research conducted by Horvath et al (2015) revealed a noteworthy connection between p53 overexpression and the progression to neoplasia (Horvath et al. 2015). This finding warrants further exploration with larger sample sizes and more comprehensive analyses to conclusively determine the association between p53 expression levels and CRC prognosis. Accumulating data discovered that both wild-type and mutant p53 are regulated by miRNAs, with specific targeting of mutated sites (Liu et al., 2017). The regulatory purpose of miRNAs on p53 was first exemplified with MiR-125b, which interacts to 3′-UTR mRNA of p53, leading to down-regulation and reduced activity (Liu et al., 2017). Subsequent study has identified additional miRNAs targeting p53 through experimental and in silico analyses (Hu et al., 2021), highlighting the intricate regulatory network between miRNAs and the p53 gene. To identify miRNAs exhibiting differential expression following p53 activation in CRC cells, we utilized the GSE67181 dataset (Huenten et al., 2015). Our analysis identified numerous miRNAs among significant differential expression profiles within p53-activated CRC cells, including hsa-miR-143, hsa-miR-145, hsa-miR-200b, hsa-miR-200c, hsa-miR-205, hsa-miR-223, hsa-miR-34a, and hsa-miR-4478. Previous research reports have demonstrated that as a result of DNA impairment, wild-type p53 protein has the ability to increase the post-transcriptional processing of various microRNAs, including miR-143 and miR-16–1, which possess growth-suppressive properties. These miRNAs have been identified to attack K-Ras, along with miR-145, which specifically attacks CDK6 (Suzuki et al., 2009). Furthermore, p53 can elevate the expression of the microRNA-200 family and also directly activates the oncosuppressive miR-205 (Chen et al., 2022, Piovan et al., 2012). Conversely, mutant p53 reduces miR-223 expression, contributing to chemoresistance (Masciarelli et al., 2014). Our findings align with these observations, showing a downregulation of miR-223 in tumor samples, consistent with its role in chemoresistance. Furthermore, we observed a downregulation of miR-4478 in CRC tissues, in alignment with previous study showing similar expression pattern in ovarian cancer, suggesting that this process might conserve across different forms of carcinomas (Wang et al., 2021b). These results suggest that activated p53 modulates the expression of these miRNAs, influencing downstream mRNA expression and regulating various processes within CRC. Overall, our study highlights the complex network of interactions between p53, miRNAs, and their downstream targets in CRC, underscoring the multifaceted regulatory mechanisms involved in CRC-related processes. Recent studies have increasingly highlighted the correlation between dysregulated miRNAs and CRC biology and clinical features (Ahadi, 2020; Niu et al., 2021). However, the ability of miRNAs as prognostic biological marker and treatment targets in CRC remains underexplored. Quantitative RT-PCR analysis revealed lower levels of miR-143 and miR-145 expression and higher expression levels of miR-223 in CRC tissues compared to matched adjacent normal tissues. While miR-223 overexpression was statistically related with gender and tumor location. Multivariate analysis confirmed that low miR-145 expression and high miR-223 expression were independent predictors of reduced viability in CRC. Previous literature research reports have revealed that miR-145 is epigenetically silenced in various cancers and in relation with a more intense phenotype in CRC (Iorio et al., 2007; Feng et al., 2014; Li et al., 2016). Similarly, miR-143 and miR-145 downregulation disrupts cellular growth and apoptosis in CRC, particularly through the MDM2-p53 feedback loop (Zhang et al., 2013). Regarding miR-223, our findings of its upregulation in CRC align with previous reports, although the association with clinical stage observed in other studies was not evident in our study (Zhang et al., 2014; Wu et al., 2012). Taken together, our study contributes by confirming and extending previous findings regarding miRNA expression in CRC. Specifically, we found that low miR-145 expression and high miR-223 expression independently serve as prognostic indicators in CRC patients. This novel discovery underscores the significance of miRNA dysregulation in CRC pathogenesis and prognosis. By integrating our results with established literature, we emphasize the potential clinical relevance of these miRNAs as biomarkers for predicting patient outcomes in CRC. Further investigations into miR-223′s regulatory role, including its impact on FOXO1 expression, could provide additional insights into its contribution to CRC pathogenesis.
5 Conclusion
Current study sheds light on the intricate relationship between p53 gene expression, miRNA dysregulation, and CRC susceptibility and progression in the Saudi population. Through comprehensive analysis, we identified key miRNAs, including miR-143, miR-145, miR-200b, miR-200c, miR-205, miR-223, miR-34a, and miR-4478, whose dysregulation is associated with p53 mutations and possibly dysfunction in CRC. Specifically, dysregulation of miR-145, miR-143, and miR-223 was linked to poor survival outcomes in CRC patients. These results emphasize the prominence of understanding the molecular mechanisms underlying CRC development and progression, particularly in diverse populations like the Saudi population. Moving forward, further scientific work is warranted to establish precise roles of these miRNAs and their interactions with p53 gene polymorphisms in CRC pathogenesis, with eventual intention to develop targeted therapies and personalized interventions for CRC patients in Saudi Arabia and beyond. In spite the limitation of standardized protocols regarding the use of miRNAs as biomarkers, they may become a reliable way for diagnosis. However, miRNAs meet most of the required criteria for being an ideal biomarker for personalized medicine and remain an impressive research field.
Authors' contributions
Abdullah M Alhadheq collected samples, isolated RNA, and synthesized cDNA. Rana Alhadheq quantified P53 mRNA and performed the statistical analyses. Saad Alkahtani verified the Quality of RNA, cDNA, and wrote the article. All authors have approved the final version of the manuscript.
CRediT authorship contribution statement
Abdullah M Alhadheq: Methodology, Investigation, Data curation. Rana Alhadheq: Software, Methodology, Formal analysis. Saad Alkahtani: Writing – review & editing, Supervision, Investigation, Funding acquisition.
Acknowledgment
This work was funded by Researchers Supporting Project number (RSP2024R26), King Saud University, Riyadh, Saudi Arabia.
Declaration of competing interest
The authors declare that they have no known competing financial interests or personal relationships that could have appeared to influence the work reported in this paper.
References
- CCDC144NL-AS1/hsa-miR-143-3p/HMGA2 interaction: in-silico and clinically implicated in CRC progression, correlated to tumor stage and size in case-controlled study; step toward ncRNA precision. Int. J. Biol. Macromol.. 2023;253:126739
- [CrossRef] [Google Scholar]
- DNA mutations may not be the cause of cancer. J Oncology, and therapy. 2017;5:85-101.
- [Google Scholar]
- The significance of microRNA deregulation in colorectal cancer development and the clinical uses as a diagnostic and prognostic biomarker and therapeutic agent. Non-Coding RNA Res.. 2020;5:125-134.
- [CrossRef] [Google Scholar]
- The roles of p53 and XPO1 on colorectal cancer progression in Yemeni patients. J. Gastrointestinal Oncology. 2019;10:437.
- [Google Scholar]
- Polymorphisms of TP53 gene and its association with colorectal cancer: a case-control investigation. J. King Saud University – Sci.. 2023;35:102936
- [Google Scholar]
- Colorectal cancer in Saudi Arabia: incidence, survival, demographics and implications for national policies. Ann. Saudi Med.. 2015;35:196-202.
- [Google Scholar]
- Regulatory functions of miR-200b-3p in tumor development. Oncol. Rep.. 2022;47:1-9.
- [Google Scholar]
- The key role of micrornas in self-renewal and differentiation of embryonic stem cells. Int. J. Mol. Sci.. 2020;21:6285.
- [CrossRef] [Google Scholar]
- Genetic polymorphisms of TP53 Arg72Pro and Pro47Ser among Egyptian patients with colorectal carcinoma. Arch. Physiol. Biochem.. 2019;125:255-262.
- [Google Scholar]
- MicroRNA-145 inhibits tumour growth and metastasis in colorectal cancer by targeting fascin-1. Br. J. Cancer. 2014;110:2300-2309.
- [Google Scholar]
- Ferlay, Jacques, Isabelle Soerjomataram, Rajesh Dikshit, Sultan Eser, Colin Mathers, Marise Rebelo, Donald Maxwell Parkin, David Forman, and Freddie %J International journal of cancer Bray. 2015. 'Cancer incidence and mortality worldwide: sources, methods and major patterns in GLOBOCAN 2012', 136: E359-E86.
- miR-145 suppresses epithelial-mesenchymal transition by targeting stem cells in Ewing sarcoma cells. Bratisl. Lek. Listy. 2021;122:71-77.
- [CrossRef] [Google Scholar]
- Hadjipetrou, Athanasios, Dimitrios Anyfantakis, Christos G Galanakis, Miltiades Kastanakis, and Serafim %J World journal of gastroenterology Kastanakis. 2017. 'Colorectal cancer, screening and primary care: A mini literature review', 23: 6049.
- Overexpression of p53 predicts colorectal neoplasia risk in patients with inflammatory bowel disease and mucosa changes indefinite for dysplasia. Gastroenterology Report. 2015;3:344-1339.
- [Google Scholar]
- Hossain, M. S., H. Karuniawati, A. A. Jairoun, Z. Urbi, J. Ooi, A. John, Y. C. Lim, K. M. K. Kibria, A. K. M. Mohiuddin, L. C. Ming, K. W. Goh, and M. A. Hadi. 2022. 'Colorectal Cancer: A Review of Carcinogenesis, Global Epidemiology, Current Challenges, Risk Factors, Preventive and Treatment Strategies', Cancers (Basel), 14.
- Targeting mutant p53 for cancer therapy: direct and indirect strategies. J. Hematol. Oncol.. 2021;14:1-19.
- [Google Scholar]
- p53-regulated networks of protein, mRNA, miRNA, and lncRNA expression revealed by integrated pulsed stable isotope labeling with amino acids in cell culture (pSILAC) and next generation sequencing (NGS) analyses. Mol. Cell. Proteomics. 2015;14:2609-2629.
- [Google Scholar]
- MicroRNA: a signature for cancer progression. Biomed. Pharmacother.. 2021;138:111528
- [CrossRef] [Google Scholar]
- p53 expression in colorectal cancer: relation to tumor type, DNA ploidy pattern, and short-term survival. Am. J. Clin. Pathol.. 1996;105:604-612.
- [Google Scholar]
- Mutational landscape and significance across 12 major cancer types. Nature. 2013;502:333-339.
- [Google Scholar]
- Mechanisms of oncogenesis in colon versus rectal cancer. J. Pathol.. 2001;195:171-1118.
- [Google Scholar]
- A review of p53 expression and mutation in human benign, low malignant potential, and invasive epithelial ovarian tumors. Cancer. 2003;97:389-404.
- [Google Scholar]
- Inhibition of SW620 human colon cancer cells by upregulating miRNA-145. World J. Gastroenterol.. 2016;22:2771-2778.
- [Google Scholar]
- The role of p53 signaling in colorectal cancer. Cancers. 2021;13(9):2125.
- [CrossRef] [Google Scholar]
- MicroRNA-223-induced inhibition of the FBXW7 gene affects the proliferation and apoptosis of colorectal cancer cells via the Notch and Akt/mTOR pathways. Mol. Med. Rep.. 2021;23:154.
- [CrossRef] [Google Scholar]
- Healthy lifestyle and cancer risk: modifiable risk factors to prevent cancer. Nutrients. 2024;16:800.
- [CrossRef] [Google Scholar]
- Gain-of-function mutant p53 downregulates miR-223 contributing to chemoresistance of cultured tumor cells. Oncogene. 2014;33:1601-11168.
- [Google Scholar]
- Miller, Kimberly D, Leticia Nogueira, Angela B Mariotto, Julia H Rowland, K Robin Yabroff, Catherine M Alfano, Ahmedin Jemal, Joan L Kramer, and Rebecca L Siegel. 2019. 'Cancer treatment and survivorship statistics, 2019', CA: a cancer journal for clinicians, 69: 363-85.
- Mutant p53 in cancer: new functions and therapeutic opportunities. Cancer Cell. 2014;25:304-317.
- [Google Scholar]
- Biological implications and clinical potential of metastasis-related miRNA in colorectal cancer. Mol. Ther. - Nucleic Acids. 2021;23:42-54.
- [CrossRef] [Google Scholar]
- Oncosuppressive role of p53-induced miR-205 in triple negative breast cancer. Mol. Oncol.. 2012;6:458-472.
- [Google Scholar]
- Epidemiology of colorectal cancer: incidence, mortality, survival, and risk factors. Gastroenterology Review/przegląd Gastroenterologiczny. 2019;14:89-103.
- [Google Scholar]
- miR-145-mediated suppression of cell growth, invasion and metastasis. Am. J. Transl. Res.. 2010;2:170-180.
- [Google Scholar]
- p53 and K-ras gene mutations in carcinoma of the rectum among Finnish women. Mol. Pathol.. 2000;53:24.
- [Google Scholar]
- Prognostic and predictive biomarkers in resected colon cancer: current status and future perspectives for integrating genomics into biomarker discovery. Oncologist. 2010;15:390-404.
- [Google Scholar]
- miR-4478 sensitizes ovarian cancer cells to irradiation by inhibiting Fus and attenuating autophagy. Mol. Ther. Nucleic Acids. 2020;23:1110-1119.
- [CrossRef] [Google Scholar]
- miR-4478 sensitizes ovarian cancer cells to irradiation by inhibiting Fus and attenuating autophagy. Molecular Therapy-Nucleic Acids. 2021;23:1110-1119.
- [Google Scholar]
- MicroRNA-223-3p is involved in fracture healing by regulating fibroblast growth factor receptor 2. Bioengineered. 2021;12:12040-12048.
- [CrossRef] [Google Scholar]
- MicroRNA-223 regulates FOXO1 expression and cell proliferation. FEBS Lett.. 2012;586:1038-1043.
- [Google Scholar]
- MicroRNA-223 functions as an oncogene in human colorectal cancer cells. Oncol. Rep.. 2014;32:115-120.
- [Google Scholar]
- Loss of microRNA-143/145 disturbs cellular growth and apoptosis of human epithelial cancers by impairing the MDM2-p53 feedback loop. Oncogene. 2013;32:61-69.
- [Google Scholar]
- Circulating microRNAs: novel biomarkers for esophageal cancer. World J. Gastroenterol.. 2010;16:2348-2354.
- [Google Scholar]
- Gain-of-function mutant p53 promotes cell growth and cancer cell metabolism via inhibition of AMPK activation. J. Molecular Cell Jasser.. 2014;54:960-974.
- [Google Scholar]
- MiR-145 inhibits tumor angiogenesis and growth by N-RAS and VEGF. Cell Cycle. 2012;11:2137-2145.
- [CrossRef] [Google Scholar]
Appendix A
Supplementary data
Supplementary data to this article can be found online at https://doi.org/10.1016/j.jksus.2024.103494.
Appendix A
Supplementary data
The following are the Supplementary data to this article:


