

Translate this page into:
Groundwater quality assessment using revised classical diagrams and compositional data analysis (CoDa): Case study of Wadi Ranyah, Saudi Arabia
⁎Corresponding authors. ahmedmohamed@aun.edu.eg (Ahmed Mohamed), mohammed.musaab@uni-miskolc.hu (Musaab A.A. Mohammed)
-
Received: ,
Accepted: ,
This article was originally published by Elsevier and was migrated to Scientific Scholar after the change of Publisher.
Abstract
This research aims to assess the status and chemical properties of groundwater in the shallow aquifer of the Wadi Ranyah region, Saudi Arabia, using robust statistical methods (CoDA) that take into account the unique characteristics of chemical analysis data from forty-five (45) groundwater samples collected in the Wadi Ranyah valley. A centered logarithmic transformation (clr) approach and isometric logarithmic transformation (ilr) plots for compositional data were utilized to determine the different water types and to understand the hydrogeochemical processes influencing groundwater chemistry in the region. The results of principal component analysis and K-means clustering reveal the existence of three groundwater groupings: (i) The first group occupies the recharge region with a relationship between trace metal elements (F, Pb, Mn, Zn), pH, and TDS, indicating the effect of alteration of igneous and metamorphic rock minerals. (ii) The second group characterizes the downstream part of the Al-Hujrah area with a relationship between calcium and nitrates, indicating the influence of agricultural activities. (iii) The third group, located in the Ranyah area, shows a relationship between major ions (Na+, SO42−, Mg2+, HCO3–, Cl−, K+), which explains water mineralization influenced by silicate weathering and evaporation phenomena. According to the modified Piper diagram (ilr Piper), two hydrochemical facies are identified. The upstream region is categorized as Ca-HCO3– while the downstream region is classified as Na-K-HCO3–. Calculated water quality index (WQI) values indicate that all Wadi Ranyah groundwater samples are of very poor quality (WQI > 300). This is due to higher concentrations of polluting elements (Pb, Mn and F), in particular the high lead concentrations which vary between 0.24 and 0.4 mg/L, and are well above the WHO limit (0.01 mg/L) for consumption of drinking water. The application of CoDA for the first time in the study region has provided a more detailed and reliable assessment of the mechanisms governing groundwater quality, permitting suggestions for the management of groundwater resources and defining future research needs.
Keywords
Groundwater quality evaluation
Powerful multivariate statistical analysis
Isometric log-ratio transformation
Water quality index
Saudi Arabia

1 Introduction
Groundwater is the principal freshwater supply utilized for home and agricultural uses in arid and semi-arid countries, necessitating attention of the growing need for this resource, especially with agricultural and industrial expansion and population growth in recent years (Vivek et al., 2024). Climate change is having a major influence on water supply worldwide (Murugesan et al., 2023). Although precipitation is the main natural process for recharging aquifers, the volatility and frequency of droughts, particularly in arid and semi-arid regions such as Saudi Arabia, have necessitated the implementation of intelligent resource management techniques to maximize groundwater use and ensure its sustainability for future generations (Vaiphei and Kurakalva, 2021).
Groundwater hydrogeochemistry is the main factor determining its suitability for consumption and use in agriculture, households and industry (Mgbenu and Egbueri, 2019; Karmakar et al., 2023; Khan et al., 2023). However, the processing and interpretation of geochemical data generally presents a number of difficulties, including spurious correlations, censored extreme values and complex interactions between variables (Templ et al., 2008). Consequently, it is important to analyze these datasets utilizing robust techniques that take into account the inherent properties of geochemical data (Parsa et al., 2022). Indeed, a significant improvement in the assessment of unbiased correlations, as well as clearer variance, easier-to-understand results and better predictive power when data are presented in centered logarithmic coordinates or pivot coordinates (Templ and Templ, 2020). As all methods, including PCA, transform the data set into Euclidean geometry. In addition, the graphs have been improved, in the light of the Compositional Data Analysis (CoDA) approach, by replacing the original coordinates with chemical balances obtained by implementing the isometric transformation of the logarithmic ratio to the composition data in particular; for the Piper diagram (Shelton et al., 2018), and Gibbs diagrams (Buccianti, 2015).
Previous studies have focused on groundwater in shallow aquifers in Saudi Arabia (Subyani and Al Ahmadi, 2010; Saleem et al., 2020; Abba et al. 2023; Alghamdi et al., 2023; Khan et al., 2023), including the identification of natural factors (e.g. geological and hydrogeological conditions, rock types and geochemical minerals, etc,) that influence groundwater quality, using several graphical representation-based approaches, as well as statistical methods based on Euclidean geometry that do not take into account the nature of the geochemical data. However, no study has used compositional analysis (CoDA) to assess groundwater in Saudi Arabia.
The current study focuses on the groundwater of the Wadi Ranyah region, which is located in the dry western mountains of Saudi Arabia, and provides a substantial potential resource for both surface and groundwater. This shallow aquifer is highly demanding and under intensive exploitation due to the influence of human activities (Subyani and Al Ahmadi, 2010; Saleem et al., 2020). In this study, a compositional analysis (CoDA) based on isometric logarithm (ilr) and centroid logarithm (clr) transformations was applied to achieve the following objectives (1) to perform a detailed study of the hydrochemical data from wells exploiting the quaternary and fractured aquifers of Wadi Ranyah using principal component analysis (PCA) and k-means classification of the clr-transformed data. (2) to better understand the hydrochemical variation of facies/water types in groundwater geochemistry using the new versions of water quality diagrams, such as the ilr ion diagram, which is based on converting data to ilr coordinates and mimics the type of information contained in this diagram; (3) to undertake a thorough hydrogeochemical evaluation of drinking water sources by using weights generated from the relative loadings and the related eigenvalues of the water parameters in the principal components (PCs); (4) and to use the weights obtained from the relative loads and the corresponding eigenvalues of the water parameters in the principal components (PCs) to perform a full hydrogeochemical evaluation of drinking water sources.
The findings of this study can help decision-makers formulate effective policies to protect groundwater in the Wadi Ranyah region, and ensure ongoing monitoring of water quality and its sustainable management.
2 Site and its general features
2.1 Location and climatic context
The governorate of Ranyah is part of the Mecca region, located in the western part of Saudi Arabia, with a total area of around 62,000 km2. It lies between latitudes 42° 30′ and 43° 00′ E and longitudes 21° 00′ and 21° 30′ N (Fig. 1). This region is characterized by a semi-arid climate, with cold winters and hot summers, with clear seasonal variations in rainfall (average 450 mm/year) and high evaporation (average 400 mm/year) (Subyani and Al Ahmadi, 2010; Saleem et al., 2020). According to the study realized by Geng and Boufadel (2017), which examined the effects of evaporation and precipitation rates on groundwater salinity and dynamics using field data and numerical models, indicates that groundwater salinity in the surface layer increases with increasing evaporation rate. Another important point is that not only climatic factors affect water resources, but also human and mining activities such as fertilizers, wastewater, agricultural effluents and industrial waste, all of which generate anthropogenic sources of pollution, while rock weathering also generates geogenic sources of pollution.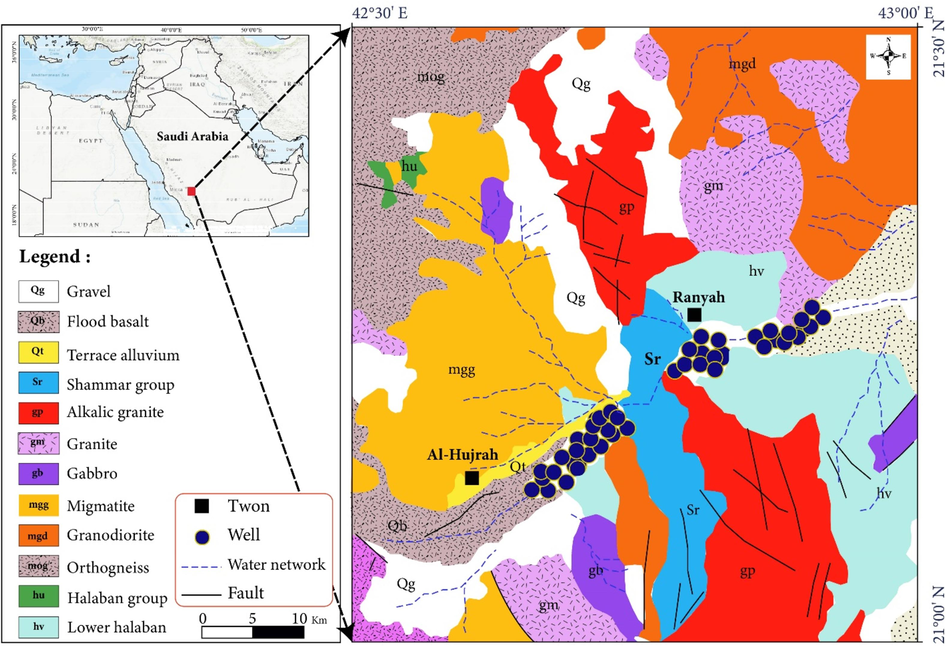
Geological map and inventory of groundwater samples.
According to the preliminary results of the general population and housing census carried out by the Ministry of Statistics and Information (2018), 47,034 people live in the Ranyah region. The majority of the governorate's inhabitants are employed in agriculture, with the Ranyah Valley offering excellent conditions for this activity. The valley is considered an important water reservoir supplying the region, and lies within the Hedjaz Mountains, part of the Arab Shield that runs north–south parallel to the Red Sea. Wadi Ranyah rises in the Baha Mountains, where its altitude varies from 1,750 to 1,880 m above mean sea level (amsl), and extends eastwards into the Saudi Arabian desert, where its altitude gradually decreases (Mohamed et al., 2023).
2.2 Geology setting
The project plan to map the geography and geology of the Arabian Peninsula received approval in July 1953 from the governments of the Kingdom of Saudi Arabia, the United States Department of State, and the Arabian American Oil Company (ARAMCO), with neighboring countries also granting their approval. The main goal was to make the fundamental geology of the area, as mapped by ARAMCO and the U.S. Geological Survey, accessible to the public. This collaboration between governments, oil companies, and private individuals marked a significant milestone in geological research (Brown et al., 1989).
The specific study area is in the western part of KSA, on the Arabian Shield. This shield covers about a third of the Arabian Peninsula, or about 630,000 km2 of land (32 % of the Kingdom's total area). It consists predominantly of Precambrian rocks, mainly igneous and metamorphic rocks, with younger volcanic rocks found in the western region (Brown et al., 1989). Fig. 1 provides a visual representation of the various rock formations from the Precambrian to the Quaternary that make up the geology of Wadi Ranyah. These rocks include andesite and basalt flows, granodiorite, diorite, granitic plutons, pyroclastic dacite and rhyolite, schist, gneiss, and metamorphosed volcanic wacke and sandstone. The area's Quaternary alluvial layers, on the other hand, consist of sands, silts, clayey sands, silts and gravels that were eroded from nearby soil and collected in Wadi Ranyah. Their thickness ranges from 5–10 m in the upper parts to 10–15 m or more in the lower parts (Mohamed et al., 2023).
Hydrogeologically, the Wadi Ranyah aquifer consists of the alluvial deposits of the wadi, with a thickness ranging from 3 m upstream to 12 m downstream, as well as in the fractured bedrock. The depth of the water table fluctuates between 3 and 10 m, with no systematic variability along the course of the wadi (Subyani and Al Ahmadi, 2010).
3 Material and methods
3.1 Sample collection and analysis
In this study, sampling focused on shallow wells to extract groundwater from Quaternary alluvium and fractured rock in the Ranyah region. 45 samples were collected from urban and rural areas after 25–30 min of pumping time (Fig. 1). High-density polyethylene bottles were washed with hydrochloric acid and rinsed 2 or 3 times with sample water before sampling. Each bottle was meticulously numbered and labelled before being transported. Samples collected after being filtered with quantitative Whatman Grade 44 filter paper and acidified with nitric acid (pH < 2) were stored in a cooler at 4 °C before being transferred to the laboratory for analysis of physicochemical parameters (APHA, 2017). The pH and TDS of the site were all measured using a pH meter (HANNA – HI 991300) which was calibrated before reading the results. In addition, each groundwater sample was analyzed for major ions (SO4−2, HCO3–, Cl−, NO3–, Ca+2, Mg+2, Na+, K+, Cl−) and minor ions (F, Mn, Pb and Zn) in milligrams per Liter. Titrimetric and photometric methods with the HANNA spectrophotometer (HI 83215) were employed to analyze the main elements: sulfates, bicarbonates, chlorides, magnesium, calcium, sodium and potassium. While trace elements of groundwater samples were determined using inductively coupled plasma mass spectrometry (ICP-MS).
All measurements and analysis procedures mentioned above were carried out in accordance with the WHO international standard. The analytical error (less than ±10 %) of the analyzed ion content was verified by the charge balance error (CBE) percentage based on the following Eq. (1):
3.2 Compositional data analysis (CoDA)
Many researchers, particularly in geosciences, are interested in geochemical data as a subset of multivariate data, which belongs to the category of compositional data and consists of a matrix of nonnegative relative values with a constant sum (Egozcue et al., 2003; Greenacre, 2018; Reghais et al., 2024). In detail, CoDA, which is based on obtaining relative information by comparing the compositional components, was developed by Aitchison (1982), and Egozcue et al. (2003). According to Egozcue et al. (2003), and Greenacre (2018), the use of traditional statistical techniques can lead to false assumptions and correlations. To address this problem, two general approaches were later developed.
-
The first approach, known as “ staying in the simplex”, with a constant sum K and a non-negativity constraint (Equation (2), consists of a constraint on a set of D components or part within a D-1-dimensional hyperplane in positive real space (R+D − 1), called “simplex space” (Egozcue et al., 2003).
-
The log-ratio transformations are used in the second approach to transfer the simplex into real space, where conventional Euclidean geometry and standard statistical methods can be used. This is achieved using either the centered log-ratio transformation (clr) or the isometric log-ratio transformation (ilr), as in the works of Aitchison (1982), and Egozcue et al. (2003).
3.2.1 Principal component analysis (PCA)
Geosciences experts rely on the utilization of the most effective methods in order to accurately analyze data. Various paper investigating the geochemistry of groundwater extensively use statistical approaches such as cluster analysis, PCA, and k-means classification. PCA is a multivariate statistical method applied to interpret hydrogeochemical data and determine relationships between observed variables in order to identify the contribution of the various anthropogenic and natural processes influencing groundwater chemistry. This technique has been widely used to study groundwater chemistry in Saudi Arabia. However, a common feature among all these studies is the use of traditional or classical statistical methods, working within a Euclidean geometry framework, without considering the unique nature of the data (Templ and Templ, 2020). In this study a robust PCA based on the transformation of geochemical data from 45 wells into centered log-ratio (equation (3), in order to assess the mutual relationship between element concentrations and their origins. In this transformation, the data are reweighted on the basis of their geometric mean or g(x), which is a measure of general trend applied to report-scale data.
g(x) is defined as the square root of the total number of elements in the product of all elements, as shown in Equation (4) using the same notation (Nishio et al., 2022):
The PCA was conducted using the “prcomp” function from the “stats” package version 4.1.3 (Team et al., 2018). Prior to this, the input geochemical data underwent a clr transformation using the “clr” function from the “rgr” package version 1.1.15 (Garrett, 2015).
3.2.2 Cluster analysis
The objective of cluster analysis is to arrange multivariate observations into a few notable homogeneous groups. The technique used in this study is k-means clustering (MacQueen, 1967), which appears to provide reasonably effective partitions in terms of intraclass variance. This clustering technique is also known as a centroid model since it describes each group with a vector reflecting the mean. It is regarded a method of acquiring qualitative and quantitative insight into massive multivariate data sets, rather than identifying a single, definitive grouping for the data.
The k-means algorithm is a widely used clustering strategy in environmental geochemistry (Khorshidi et al., 2021). This algorithm partitions multivariate data into a specified number of subgroups or clusters, with 'k' representing the number of clusters. It aims to minimize the sum of squared distances between each data point and its corresponding cluster center. The algorithm begins by randomly selecting cluster centers and iteratively adjusts them to minimize the average dispersion within each cluster (Nishio et al., 2022). This strategy, which is unsupervised and based on only one data set, can detect clusters without prior knowledge. However, the use of these machine learning tools in processing and interpreting phenoms is limited due to the compositional nature of geochemical data (Aitchison, 1982; Khorshidi et al., 2021). To address this limitation, the authors conducted k-means clustering using the PC1 and PC2 values (Supplementary Materials Table S1) derived from PCA after applying the clr transformation to the raw elemental concentration values. This transformation helps solve the data closure problem and allows for the classification of geochemical patterns. The authors chose this algorithm due to its merits and availability in most open-source software (Templ et al., 2008).
The R programming language's factoextra package was utilized to employ the fviznbclust function in order to determine the optimal number of clusters using the silhouette index (Kassambara, 2016). The results of the silhouette analysis indicated three clusters as the ideal number (Supplementary Materials Fig. S1).
3.3 Revised diagrams (Compositional perspective)
Numerous graphical and numerical methods have been developed in the literature to elucidate the intricate nature of geochemical characterization of groundwater. This complexity arises from a multitude of uncertainties stemming from natural factors, such as geological structures, aquifer reservoirs, and transit time, as well as anthropogenic factors like wastewater discharges and agricultural activities (Reghais et al., 2023). In general, conventional analysis methods such as ion ratios, correlation analysis, and graphs like the Gibbs diagram have been used to achieve this goal. However, these techniques often overlooked the relative structure of data sets, leading to inaccurate and incorrect results (Wheeler et al., 2021). Consequently, it is now crucial to update schematics, while still enabling straightforward interpretation of the geochemical findings (Templ et al., 2008).
Recently, new statistical tools have been developed to effectively compare and handle digital information. One of these techniques involves converting data into ilr coordinates, which allows for easy transfer from simplex space to real space. This technique has been proven to be valuable both in theory and practice, especially in the construction of balances using the Sequential Binary Partition (SBP) of composition x. The SBP divides composition parts into two non-overlapping groups at each of the D-1 partition a step, resulting in ilr coordinates of D-1. Equation (5) represents the equilibrium between these groups in RD-1 (Pawlowsky-Glahn and Buccianti, 2011; Buccianti, 2015).
In the ith step of SBP, xi+ and xi- represent the groups of parts that are separated. ri+ and ri- indicate the number of parts in ci+ and ci−, respectively. Additionally, the function g(.) corresponds to the geometric mean of its argument.
This paper utilizes two classical diagrams that have been recently revised in light of an approach called compositional data analysis. These diagrams are used to describe the groundwater in Wadi Ranyah, Saudi Arabia. The first diagram is the ilr-plot, which is a new type of diagram that incorporates the information found in Piper's diagram. The ilr-plot was introduced by (Shelton et al., 2018). The second diagram is a revised version of the Gibbs diagram, which takes into account the properties of compositional data. This revised version was introduced by (Buccianti, 2015). These diagrams allow for the exploration and description of the chemistry of water in an exploratory and descriptive manner. The balances of the modified and replaced diagrams are presented for each axis (Supplementary Materials Table S2), as well as the sequential binary partition for the ilr diagram (Supplementary Materials Table S3).
3.4 Drinking water resources assessment
Groundwater plays a crucial role in Saudi Arabia's overall water supply. However, recent studies by Alghamdi et al. (2023) indicate that the quality of these resources has been deteriorating due to excessive groundwater extraction in the dry region. This degradation poses significant challenges to human health. In this section, our focus lies on analyzing chemical data from 45 groundwater samples, encompassing 15 chemical parameters including Ca2+, Mg2+, Na+, K+, Cl−, HCO3–, SO42−, NO3–, TDS, EC, F, Pb, Mn, and Zn. To comprehensively assess the hydrogeochemical condition of groundwater sources with regards to their potability, we utilized the weights derived from the relative loadings and corresponding eigenvalues of the water parameters in the principal components (PCs). These weights were employed in the calculation of the Water Quality Index (WQI) as per Equation (6), as described by Ewuzie et al. (2021).
The weight of parameter i, noted Wi, was obtained from the eigenvalue of each PC as well as the factor loadings of each parameter based on the PCA results. Ci and SI correspond to the value of the parameter measured for each sample and the WHO (2017) guideline, respectively. The water quality index (WQI) remains among the reliable methods for assessing water quality according to drinking water guidelines (Shanmugamoorthy et al., 2023). It categorizes drinking water quality into five classes: Excellent quality when WQI ≤ 50, Good quality (51 ≤ WQI ≤ 100), Poor quality (101 ≤ WQI ≤ 200), Very poor quality (201 ≤ WQI ≤ 300) and, finally, Unsuitable for consumption when WQI > 300 (Meng et al., 2016).
4 Results and discussion
Groundwater physicochemical parameters were statistically examined to identify their hydrochemical characteristics. Table 1 summarizes and provides statistical details in terms of maximum, mean, minimum and standard deviation concerning water quality parameters. In the region studied, groundwater pH values fluctuated between 6.2 and 8.5, with the majority of samples meeting the guidelines for drinking water (6.5–8.5) recommended by the World Health Organization (WHO, 2017). The average pH value is 7.30, attributing a neutral character to the groundwater, with low spatial variability, reflecting the water's buffering capacity. The low pH values (pH < 7) were registered in the upstream part (H3, H4, H17, H19 and H20), considered as a recharge area (dilution effect). A slight increase in pH was recorded in the central and downstream parts of the region studied, which can be explained by biological reactions resulting from the influence of anthropogenic activities, particularly agricultural activities requiring the use of fertilizers, which increase the rate of chemical erosion.
Variable
Units
Min
Max
Mean
Std. deviation
pH
/
6.20
8.50
7.30
0.37
EC
µS/cm
531.25
804.69
746.98
64.23
Ca2+
mg/L
24.00
60.00
38.38
5.35
Mg2+
mg/L
8.00
18.00
12.73
1.42
Na+
mg/L
17.00
41.00
32.48
5.91
K+
mg/L
0.80
3.50
2.00
0.51
HCO3–
mg/L
109.00
220.00
171.06
21.15
Cl−
mg/L
18.00
52.70
34.49
7.83
SO42−
mg/L
24.00
51.00
42.82
7.09
NO3–
mg/L
1.50
6.00
3.16
0.98
F
mg/L
0.27
0.42
0.36
0.04
Zn
mg/L
1.30
2.59
2.30
0.19
Pb
mg/L
0.24
0.40
0.34
0.04
Mn
mg/L
0.10
0.20
0.17
0.02
Electrical conductivity (EC) is a useful indicator of mineralization, reflecting the content of the dissolved salts (Murugesan et al., 2023). It ranged from 532 to 805 µS/cm (mean: 747 µS/cm). All groundwater samples (100 % of samples) had EC values below WHO potability standards (1000 µS/cm). The upstream part showed the lowest values, due to natural recharge (dilution effect). An increase in EC values was observed towards the center and downstream of the aquifer, depending on the direction of groundwater flow. For the major chemical elements, the order of abundance of anions is HCO3– > SO42− > Cl− > NO3–. Whereas cations are Ca2+ > Na+ > Mg2+ > K+. Concentrations of all elements remain below and far from WHO standards, with the exception of bicarbonates, which were close to the limit standard (250 mg/L). They originate on the one hand from the weathering of crystalline formations and on the other from the precipitation of HCO3– in alluvium following variations in rainfall (Saleem et al., 2020).
In all groundwater samples, heavy metal contents were below WHO guidelines for zinc (Zn), fluorine (F) and manganese (Mn). However, lead (Pb) exceeded WHO maximum recommended values (0.01) in all samples. High Pb levels could be due to weathering of natural lead carbonates (PbCO3) or from the use of lead fertilizers and pesticides (Endosulfan, Aldrin, Deieldrin, etc.) in the agricultural sector. The results obtained are in concordance with those published by Subyani and Al Ahmadi, (2010).
4.1 Multivariate compositional statistics (CoDA-MSA)
4.1.1 Summary CoDA-statistics
Considering the nature of the compositional data, traditional descriptive statistics, particularly the arithmetic mean and standard deviation or variance of the individual components as measures of dispersion or central tendency, are incompatible with Aitchison geometry. Therefore, new alternatives were required in CoDA statistics. They were included in the concepts of center, variation matrix, and total variance (Buccianti, 2015). The geometric means and corresponding percentiles are used in CoDA to determine dispersion of the components and the central value (Filzmoser et al., 2018).
The summary of compositional statistics, including the closed geometric mean, 25th percentile, and 75th percentile, was obtained using CoDA Pack software version 2.01.14 (Department of Computer Science and Applied Mathematics, University of Girona, Spain). The results are presented in Table 2.
Parameters
central value
percentile25
percentile75
Ca2+ (mg/L)
0.0243
0.0226
0.0252
Mg2+ (mg/L)
0.0081
0.0078
0.0081
Na+ (mg/L)
0.0204
0.0184
0.0226
K+ (mg/L)
0.0012
0.0012
0.0014
HCO3– (mg/L)
0.1085
0.1073
0.1117
Cl− (mg/L)
0.0215
0.0174
0.0243
SO42− (mg/L)
0.0270
0.0245
0.0296
NO3– (mg/L)
0.0019
0.0015
0.0026
PH −-
0.0047
0.0045
0.0047
TDS (mg/L)
0.3046
0.3022
0.3072
EC (µs/cm)
0.4759
0.4722
0.4801
F (mg/L)
0.0002
0.0002
0.0002
Zn (mg/L)
0.0015
0.0014
0.0015
Pb (mg/L)
0.0002
0.0002
0.0002
Mn (mg/L)
0.0001
0.0001
0.0001
4.1.2 Spearman correlation matrix
The Spearman rank method is a non-parametric way of calculating the correlation rate between variables and does not calculate linear relationships, but rather determines whether they are constantly (monotonically) increasing or decreasing. The difference between linear and Spearman correlation coefficients is that the latter is more general and less restrictive than (Reimann et al., 2017). The Spearman correlation matrix of the 15 variables (Supplementary Materials Table S4) reveals several hydrochemical relationships. Notably, the correlation between SO42− and K+, Na+, Cl− is significant (0.74 < r < 0.94), indicating the evaporation effect on the mineralization of groundwater. Additionally, a high correlation (r = 0.88) between Ca2+ and NO3– suggests the possible impact of the agricultural activities. Lastly, there are significant correlations (0.60 < r < 0.81) between Pb and Mn, as well as F and Zn, which may indicate a common origin such as igneous rocks like granite and granodiorite.
4.1.3 Robust principal component analysis
Log-transformed ratios are important for assessing compositional data because they emphasize the relative magnitudes and variability of the components rather than their absolute values (Aitchison, 1982). To ensure proper statistical analysis of the variable inputs obtained from the laboratory, a log-transformation (clr) was applied prior to conducting the principal component analysis. The dataset consists of 45 groundwater samples and 15 variables, including 8 major ions (Mg2+, Ca2+, K+, Na+, SO4−2, Cl−, HCO3–, and NO3–) and 4 minor ions (F, Zn, K, Pb, and Mn), in addition to TDS, EC, and pH. However, the variation to be explained determines the number of robust components that can correctly represent the data. Consequently, the two robust PCs were selected (rPC 1: 37.8 %, and rPC 2: 20.1 %), representing a total variance of 57.9 %. The descriptive statistics obtained from the principal component analysis of the clr-transformed data are presented in Supplementary Materials (Table S5). Based on the quartile and median values, it is evident that the second cluster exhibits lower PC1 values compared to the first cluster (I). Nevertheless, it is worth noting that cluster I still contains samples with high PC1 values (>6). Conversely, cluster II consists of a sub-cluster with high PC2 values (>4.5).
The F1-F2 factorial plan (57.9 % of variance) reveals an opposition between two groups of variables (Fig. 2). The F1 axis, explaining 37.8 % of the variance, represents the main differentiating factor between these groups. The first group, referred to as G1, consists of pH, manganese, and trace elements. These variables may indicate the weathering effect of crystalline rocks and agricultural activities. Notably, this group corresponds to wells located in the upstream part, specifically the Al-Hujrah zone, which is considered the recharge zone. On the other hand, the second group (G2) can be subdivided into two subgroups: the subgroup (G2-1) corresponds to the wells from the Ranyah zone, which are rich in HCO3–, Cl−, K+, SO42− and Na+. While the subgroup (G2-2) represents the downstream wells in the Al-Hujrah zone, which are mineralized like those in Ranyah, but richer in calcium and nitrates.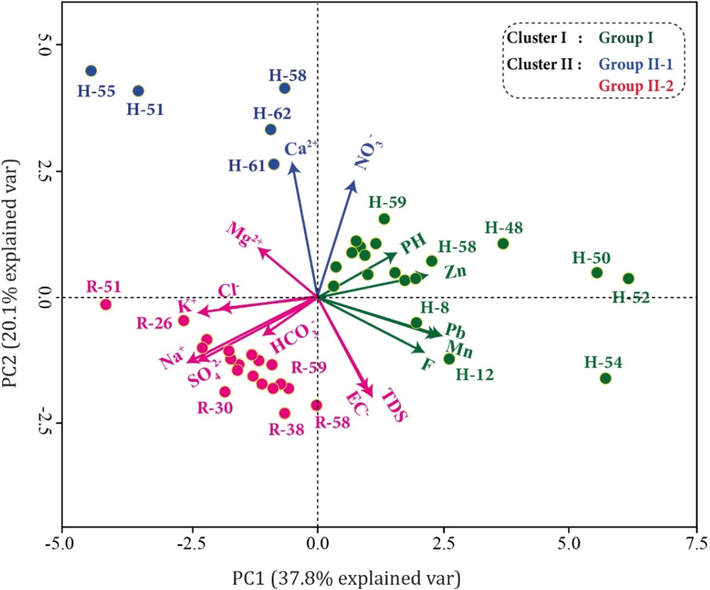
Principal component analysis of clr-transformed data: Biplot of the PC1 versus PC2 factors.
Regarding axis F2 (20.1 % of variance), it distinguishes mineralized waters rich in HCO3–, Cl−, K+, SO42− and Na+ that are well correlated with electrical conductivity (G2-1), which corresponds to the wells in the Ranyah zone, from highly diluted waters (G1) with higher concentrations of trace metallic elements.
4.1.4 Cluster analysis
Hierarchical cluster analysis (HCA) in R mode was applied to the 15 hydrochemical parameters, while HCA in Q mode was utilized to examine the 45 samples of groundwater. The resulting dendrograms enabled the classification of the waters in three distinct groups (G1, G2, and G3) (Fig. 3). This sequential logic (G1-G2-G3) aligns with the flow direction, as it corresponds to the concentration of elements along the pathways and flow lines of groundwater.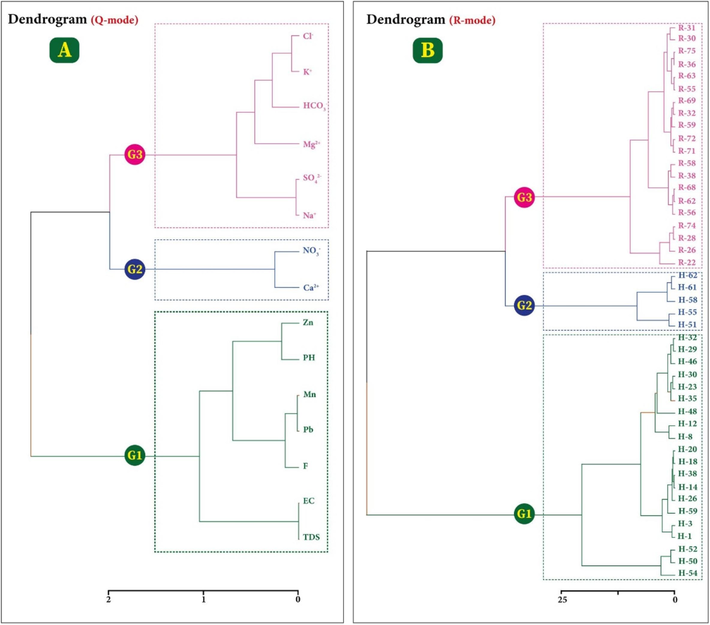
Dendrograms: (A) cluster analysis of variables; (B) cluster analysis of samples.
The first group, referred to as G1, consists of trace metal elements, pH, TDS, and EC. These characteristics are used to define wells in the recharge zone, where high contents of lead, zinc, and fluoride are present. These elevated levels are a result of the weathering of igneous and metamorphic rocks, as well as agricultural activities (Subyani and Al Ahmadi, 2010).
The second group, known as G2, focuses on calcium (Ca+2) and nitrate (NO3–) levels (Fig. 3A). This group includes five wells: H51, H55, H58, H61, and H62, which are located downstream of the Al-Hujrah zone. The water from these wells is mineralized and contains high levels of calcium. The excess calcium and nitrates compared to other wells is likely due to agricultural activities.
The third group, G3, includes all wells in the Ranyah area, which is the discharge zone. This group exhibits a strong correlation among major ions, namely Mg+2, HCO3–, Na+, SO4−2, K+, and Cl− (Fig. 3B). The waters in this group are mineralized, with an electrical conductivity (EC) greater than 750 μS/cm. This mineralization is attributed to the alteration of silicate minerals, such as plagioclase, pyroxenes, and amphiboles, which are commonly found in igneous rocks like andesite, granodiorite, and mafic igneous rocks (Drouiche et al., 2022). Additionally, the evaporation effect and overexploitation of the groundwater aquifer for irrigation (Reghais et al., 2023).
4.2 Isometric log-ratio-ion plot
Although the Piper diagram has been a useful tool for categorizing different types of water for the past eight decades, it has also presented challenges. The diamond-shaped structure of the Piper diagram renders it difficult to differentiate between fluids primarily comprising of Ca+2, Mg+2, Cl−, and SO4−2, especially when dealing with large data sets. To address this issue, a new version of the Piper diagram has been developed. This updated diagram incorporates compositional data analysis (CoDA) to generate four (4) isometric log-ratio (ilr) coordinates for the six (6) principal chemical parameters analyzed in the traditional Piper diagram. These coordinates are then utilized to create a four-field biplot, referred to as the ilr-ion plot. The ilr-ion plot allows for the visualization of additional data, such as the relationships between Ca2+/Mg2+ and Cl−/SO4−2. It effectively conveys information from the traditional Piper diagram regarding composition, water chemistry types, and geochemical processes (Shelton et al., 2018).
The information in Piper's diamond can be understood by referring to the anion triangle (SO4−2 + Cl−) versus (HCO3–) and the cation triangle (alkaline-earth vs. alkali), as shown in Fig. 4. Based on the top right panel of the diagram (Fig. 4B), bicarbonates (HCO3–) are generally the dominant anions in all three groups of water samples, with an average content of about 170 mg/L. This aligns with the HCO3– content found in the crystalline domain. A slight increase in HCO3– content was observed downstream, which can be attributed to variations in rainfall. The river experiences dry periods of more than three months, followed by cycles of heavy rainfall, leading to precipitation and a higher level of HCO3– in the groundwater (Saleem et al., 2020).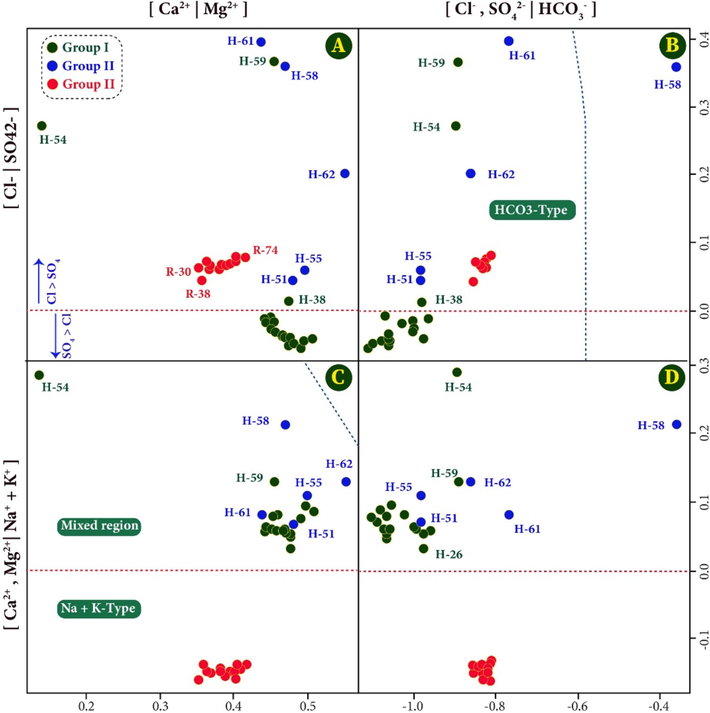
Isometric log-ratio-ion plot for Ranyah groundwater samples.
All samples from the third group (Ranyah zone) exhibited negative values, indicating a higher abundance of alkaline elements (Na+ + K+) compared to alkaline-earth elements (Ca+2 + Mg+2) in relationship to the flow direction (Fig. 4C). In the top right panel, data points for groups (1) and (2) have negative y-coordinate values and positive x-coordinate values (Fig. 4). The sampling points within the cation panel represent the Ca+2 type (Fig. 4C), while in the anion panel, they represent the HCO3– type (Fig. 4B), suggesting an HCO3– − Ca+2 type of water. The relative abundances of Ca+2 and Mg+2 (x-axis) compared to SO4−2 and Cl− (y-axis) can be distinguished in the left top panel (Fig. 4A). In this panel, all samples from the three groups have positive x-coordinates, indicating that the Ca+2 content was mostly higher than the Mg+2 content. Conversely, the y-axis separates the waters of the first group (Al-Hujrah zone) with negative values, indicating that these waters have a higher content of SO4−2 compared to Cl−. In contrast, the waters of groups (2) and (3) exhibit higher concentrations of Cl−− than SO4−2 (downstream part of Al-Hujrah and Ranyah zone).
4.3 Natural processes
Various techniques, including the Gibbs and molar ratio diagrams with a common denominator are commonly used to study the diversity in water composition. However, these diagrams, which rely on molar ratios for their coordinates, cannot be effectively analyzed using statistical methods due to their lack of orthogonal directions. This limitation hinders the modeling stage. To better understand the natural processes controlling the chemistry of groundwater, the revised Gibbs diagram was employed in this study. This version of the Gibbs diagram is consistent with the kind of compositional data recently introduced by (Buccianti, 2015) through the use of isometric log-ratio equilibria for groundwater samples.
The groundwater geochemical analysis of Wadi Ranyah has been presented using a binary diagram. The coordinates in this diagram are determined by the equations listed in Supplementary Materials (Table S2). Fig. 5 depicts the three Gibbs geochemical mechanisms, as well as the position of the seawater composition. In this diagram, lower values on the y-axis indicate a low concentration of elements in the aqueous solution, while higher values indicate the prevalence of water–rock interaction processes. Additionally, the x-axis demonstrates the dominance of Na+ over Ca+2, as illustrated in Fig. 5. The majority of water samples are in the water–rock interaction domain, with two distinct groups. The first group consists of wells located in the upstream part (Al-Hujrah zone). These wells are characterized by a dominance of Ca+2 over Na+, indicating the influence of water-aquifer reservoir interaction. The second group includes wells from the downstream part (Ranyah zone), where most points lie along a vertical line representing an equilibrium between Na+ and Ca+2. In this group, the y-axis values continue to increase, suggesting that water chemistry is affected by evaporation. Wells H51 and H55 are located close to the evaporation line, where an increase in Ca+2 is generally observed due to anthropogenic activities.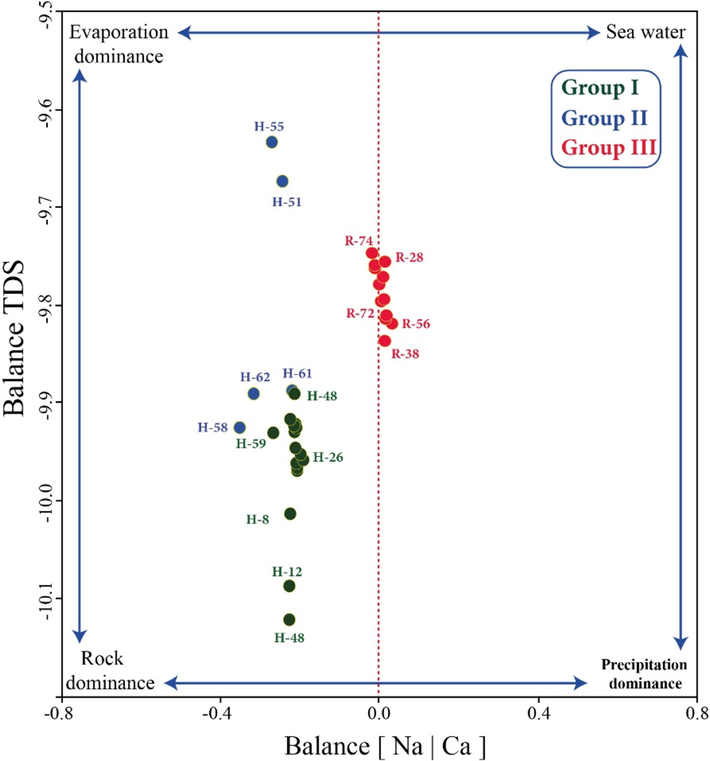
Isometric log-ratio balances for Gibbs's diagram revised as proposed by Buccianti (2015).
4.4 Water quality index
In the present study, we calculated the groundwater quality index for domestic use in the Wadi Ranyah area. We used weights based on relative loads and eigenvalues for trace metal elements and major ions, which were converted to central logarithmic ratio (clr) as input variables in the principal components (PC) analysis. The standards set by (WHO, 2017) have also been taken into account, as shown in Table 3. The water quality index (WQI) tool we employed shows great promise. It can be employed to evaluate overall water quality or serve as a pollution index. Furthermore, this tool facilitates swift and cost-effective monitoring of multiple water bodies, helping identify sources of pollution or elements that require immediate monitoring or treatment (Ewuzie et al., 2021).
PC
Eigenvalue
Relative eigenvalue
Variables
Loading’s value
Relative loadings
Weights*
WHO (2017) (Si)
PC1
2.66
0.62
Mg2+
0.337
0.120
0.319
50 (mg/L)
Na+
0.342
0.121
0.323
200 (mg/L)
K+
0.336
0.119
0.318
12 (mg/L)
HC03−
0.328
0.116
0.310
250 (mg/L)
Cl−
0.238
0.084
0.225
250 (mg/L)
SO42
0.327
0.116
0.308
250 (mg/L)
PH
0.32
0.114
0.302
8.5
TDS
0.294
0.104
0.278
600 (mg/L)
EC
0.294
0.104
0.278
1000 (µS/cm)
Total
2.82
PC2
1.61
0.38
Ca2+
0.294
0.193
0.311
75 (mg/L)
NO3–
0.287
0.189
0.304
50 (mg/L)
F
0.454
0.298
0.479
1.5 (mg/L)
Zn
0.069
0.045
0.073
3 (mg/L)
Pb
0.419
0.275
0.443
0.01(mg/L)
Mn
0.468
0.307
0.494
0.4 (mg/L)
Total
1.51
In this research, the estimated water quality index (WQI) values (Supplementary Materials Table S6) for Group (1) ranged from 1410 to 1948, with an average of 1731, while Group (2) had a range of 1260 to 1930, with an average of 1502 (Fig. 6). Group (3) showed a WQI range of 1412 to 1957, with a mean of 1712. It was observed that all groundwater samples from Wadi Ranyah were categorized as water of very poor quality and unsuitable for consumption (WQI > 300). On the basis of the sub-indices, it was noted that lead had high sub-index values (>24). Consequently, the high WQI values correspond to higher levels of this parameter in groundwater, where lead concentrations range from 0.24 to 0.4 mg/L, well above the WHO limit (0.01 mg/L).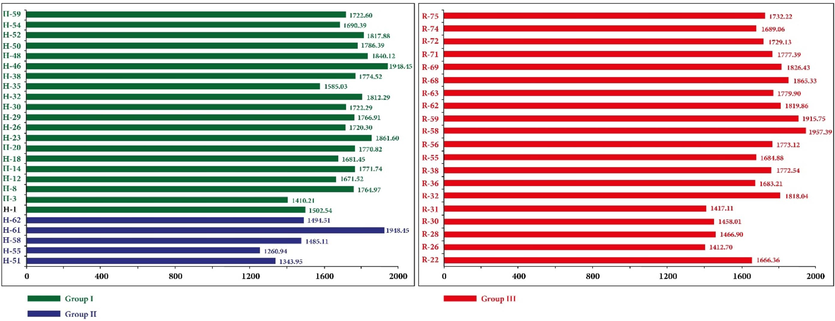
Graphic representation of the water quality index in the study area.
A significant correlation was found between WQI and fluorine and manganese (0.45 > R2 > 0.69), while a strong correlation was observed with lead (R2 = 0.99) (Table 4). This indicates that water quality is influenced only by high concentrations of pollution elements (F, Mn and Pb). These elements can originate from two main sources: (i) weathering of crystalline and metamorphic rocks such as granites and gneisses (Subyani and Al Ahmadi, 2010), and (ii) human activities such as road traffic and agriculture. To guarantee human health, it is essential to regularly monitor groundwater quality, implement water treatment measures where necessary, and provide the populations concerned with alternative sources of clean, safe drinking water.
Variables
Ca2+
Mg2+
Na+
K+
HCO3–
Cl−
SO42−
NO3–
pH
TDS
EC
F
Zn
Pb
Mn
WQI
−0.492
−0.443
−0.181
−0.234
−0.245
−0.177
−0.187
−0.232
−0.324
−0.064
−0.064
0.454
0.110
0.997
0.686
5 Conclusion
The aim of this study is to assess groundwater quality in the shallow Wadi Ranyah aquifer, one of the main groundwater sources in the Al-Baha region (Saudi Arabia). A compositional data analysis (CoDA) method was used to analyze a chemical dataset of 45 groundwater samples with the aim of examining the hydrogeochemical data in detail, while taking into account their nature, enabling us to identify the dominant hydrogeochemical processes and evaluate the groundwater suitability of Wadi Ranyah for human consumption.
Various multivariate compositional statistical methods were employed, including Compositional Clustering Analysis (HCA), correlation analysis, robust Principal Component Analysis (rPCA), ilr-ion plot, and isometric log-ratio balances for the Gibbs diagram. The CoDA-based MSA identified three groups: (i) a correlation between trace metal elements, pH, and TDS, which characterizes the upstream wells in the study area. The effect of alteration of igneous and metamorphic rocks, as well as agricultural activities, could explain this sub-composition. (ii) A linkage between [Ca2+, NO3–], indicating the influence of anthropogenic activities, particularly agriculture. (iii) An association between mixed waters [Na+, SO42−, Mg2+, HCO3–, Cl−, K+], characterizing the downstream waters in the Ranyah area, where silicate weathering and evaporation are the mechanisms responsible for this mineralization. Groundwater has been classified into two types on the basis of its basic geochemical properties: Ca-HCO3 facies in the upstream region and Na-HCO3 facies in the downstream region. A review of drinking water quality using WQI measurements reveals that all groundwater samples from Wadi Ranyah are a very poor quality and unfit for consumption (WQI > 300). Consequently, the high WQI values are due to higher concentrations of pollutant elements (Pb, Mn and F), in particular the high lead concentrations which vary between 0.24 and 0.4 mg/L, and are well above the WHO limit (0.01 mg/L) for drinking water.
The combination of statistical compositional analysis (CoDA), modified graphs and the modified quality index (WQI), based on the results of chemical analyses of major elements as well as trace metals, has made it possible to accurately determine groundwater quality and its governing mechanisms, and to highlight potential sources of contaminants and the mechanisms by which they are enriched. They showed that geogenic sources and geochemical processes have a greater influence on groundwater quality than anthropogenic activities. These findings clearly demonstrate the need to implement a management program focused on rationalizing water use in order to ensure the long-term sustainability of the aquifer. However, such a program would require the incorporation of water treatment methods to make the water potable.
CRediT authorship contribution statement
Drouiche Abdelmalek: Writing – original draft, Methodology, Formal analysis, Conceptualization. Reghais Azzeddine: Writing – original draft, Methodology, Formal analysis, Conceptualization. Ahmed Mohamed: Writing – review & editing, Validation, Methodology, Formal analysis, Data curation. Zahi Faouzi: Writing – review & editing, Software, Investigation, Conceptualization. Wael F. Galal: Writing – review & editing, Visualization, Validation, Investigation. Saad S. Alarifi: Writing – review & editing, Visualization, Software. Musaab A.A. Mohammed: Writing – review & editing, Visualization.
Acknowledgment
This research was supported by Researchers Supporting Project number (RSP2024R496), King Saud University, Riyadh, Saudi Arabia
Declaration of competing interest
the authors declare that they have no known competing financial interests or personal relationships that could have appeared to influence the work reported in this paper.
References
- Fluoride and nitrate enrichment in coastal aquifers of the Eastern Province, Saudi Arabia: the influencing factors, toxicity, and human health risks. Chemosphere 2023
- [CrossRef] [Google Scholar]
- The statistical analysis of compositional data. J. R. Stat. Soc.. 1982;44:139-160.
- [CrossRef] [Google Scholar]
- Impact of climate change on hydrochemical properties and quality of groundwater for domestic and irrigation purposes in arid environment: a case study of Al-Baha region, Saudi Arabia. Environ. Earth Sci.. 2023;82:39.
- [CrossRef] [Google Scholar]
- APHA, 2017. Standard methods for the examination of water and wastewater, 23rd edn. Washington DC: American Public Health Association Inc., New York.
- Brown, G.F., Schmidt, D.L., Huffman, A.C., Jr, 1989. Geology of the Arabian Peninsula; shield area of western Saudi Arabia. USGS Prof. Pap. 10.3133/pp560a.
- The FOREGS repository: Modelling variability in stream water on a continental scale revising classical diagrams from CoDA (compositional data analysis) perspective. J. Geochem. Explor.. 2015;154:94-104.
- [CrossRef] [Google Scholar]
- Assessment of surface water quality: a case of Jijel region, North-East Algeria. Arab. J. Geosci.. 2022;15:252.
- [CrossRef] [Google Scholar]
- Isometric Logratio transformations for compositional data analysis. Math. Geol.. 2003;35:279-300.
- [CrossRef] [Google Scholar]
- Hydrogeochemical, microbial and compositional analysis of data from surface and groundwater sources in Southeastern Nigeria. J. Geochem. Explor.. 2021;224:106737
- [CrossRef] [Google Scholar]
- Filzmoser, P., Hron, K., Templ, M., 2018. Applied Compositional Data Analysis: With Worked Examples in R. Springer.
- Garrett, R.R., 2015. rgr: Applied Geochemistry EDA. R package version 1.1. 11.
- The influence of evaporation and rainfall on supratidal groundwater dynamics and salinity structure in a sandy beach. Water Resour. Res.. 2017;53(7):6218-6238.
- [CrossRef] [Google Scholar]
- Greenacre, M.J., 2018. Compositional Data Analysis in Practice. CRC Press, Taylor and Francis Group. 10.1201/9780429455537.
- Investigation of the hydrogeochemistry, groundwater quality, and associated health risks in industrialized regions of Tripura, northeast India. Environ. Foren.. 2023;24(5–6):285-306.
- [CrossRef] [Google Scholar]
- Kassambara, A., 2016. Factoextra: extract and visualize the results of multivariate data analyses. R package version, 1.
- Influence of natural and anthropogenic factors on the hydrogeology and hydrogeochemistry of Wadi Itwad Aquifer, Saudi Arabia: assessment using multivariate statistics and PMWIN simulation. Ecol. Indicators. 2023;151:110287
- [CrossRef] [Google Scholar]
- Identification of heavy metal pollution sources and its associated risk assessment in an industrial town using the K-means clustering technique. Appl. Geochem.. 2021;135:105113
- [CrossRef] [Google Scholar]
- MacQueen, J., 1967. “Classification and Analysis of Multivariate Observations.” In: 5th Berkeley Symp. Math. Statist. Probability, 281–97. University of California Los Angeles LA USA.
- Geochemistry of dissolved trace elements and heavy metals in the Dan River Drainage (China): distribution, sources, and water quality assessment. Environ. Sci. Pollut. Res. Int.. 2016;23:8091-8103.
- [CrossRef] [Google Scholar]
- The hydrogeochemical signatures, quality indices and health risk assessment of water resources in Umunya district, southeast Nigeria. Appl. Water Sci.. 2019;9(1):22.
- [CrossRef] [Google Scholar]
- Integrated geophysical approach of groundwater potential in Wadi Ranyah, Saudi Arabia, Using Gravity, electrical resistivity, and remote-sensing techniques. Rem. Sens.. 2023;15:1808.
- [CrossRef] [Google Scholar]
- Groundwater hydrochemistry and its appropriateness for consumption and irrigation: geographic and temporal variation: Integrated approach. Urban Climate. 2023;49:101482
- [CrossRef] [Google Scholar]
- Compositional data analysis (CoDA) of clinopyroxene from abyssal peridotites. Geochem. Geophys. Geosyst.. 2022;23
- [CrossRef] [Google Scholar]
- Innovative methods applied to processing and interpreting geochemical data. J. Geochem. Explor.. 2022;237:106983
- [CrossRef] [Google Scholar]
- Compositional Data Analysis: Theory and Applications. John Wiley & Sons; 2011.
- Hydrogeochemical evaluation of the Terminal Complex aquifer system in an arid area: a case study from the Biskra region, north-east Algeria. Environ. Earth Sci.. 2023;82:182.
- [CrossRef] [Google Scholar]
- Compositional data analysis (CoDA) and geochemical signatures of the terminal complex aquifer in an arid zone (northeastern Algeria) J. Afr. Earth Sci.. 2024;210:105162
- [CrossRef] [Google Scholar]
- A new method for correlation analysis of compositional (environmental) data - a worked example. Sci. Total Environ.. 2017;607–608:965-971.
- [CrossRef] [Google Scholar]
- Saleem, H.A., Alharbi, M.O., Subyani, A.M., 2020. Hydrochemical Assessment of Groundwater Within the Lower Wadi Ranyah, Western Saudi Arabia Using Multivariate Statistical Technique, in: Khomsi, S., Roure, F.M., Al Garni, M., Amin, A. (Eds.), Arabian Plate and Surroundings: Geology, Sedimentary Basins and Georesources. Springer International Publishing, Cham, pp. 249–257. 10.1007/978-3-030-21874-4_10.
- Groundwater contamination monitoring for pollution measurement and transmission applying WQI approaches from a region of the erode district, Tamilnadu, India. J. Water Chem. Technol.. 2023;45(2):181-194.
- [CrossRef] [Google Scholar]
- The isometric log-ratio (ilr)-ion plot: a proposed alternative to the Piper diagram. J. Geochem. Explor.. 2018;190:130-141.
- [CrossRef] [Google Scholar]
- Multivariate statistical analysis of groundwater quality in Wadi Ranyah, Saudi Arabia. JAKU Earth Sci.. 2010;21:29-46.
- [Google Scholar]
- Team, R.C., Team, M.R.C., Suggests, M., Matrix, S., 2018. Package stats. The R Stats Package.
- Cluster analysis applied to regional geochemical data: problems and possibilities. Appl. Geochem.. 2008;23:2198-2213.
- [CrossRef] [Google Scholar]
- Analysis of chemical compounds in beverages - guidance for establishing a compositional analysis. Food Chem.. 2020;325:126755
- [CrossRef] [Google Scholar]
- Hydrochemical characteristics and nitrate health risk assessment of groundwater through seasonal variations from an intensive agricultural region of upper Krishna River basin, Telangana, India. Ecotoxicol. Environ. Saf.. 2021;213:112073
- [CrossRef] [Google Scholar]
- Study on groundwater pollution and its human impact analysis using geospatial techniques in semi-urban of south India. Environ. Res.. 2024;240:117532
- [CrossRef] [Google Scholar]
- Utilising CoDA methods for the spatio-temporal geochemical characterisation of groundwater; a case study from Lisheen Mine, south central Ireland. Appl. Geochem.. 2021;127:104912
- [CrossRef] [Google Scholar]
- Guidelines for Drinking-water Quality, 4th edition, incorporating the 1st addendum. Geneva: World Health Organization; 2017. p. :2017.
Appendix A
Supplementary material
Supplementary data to this article can be found online at https://doi.org/10.1016/j.jksus.2024.103463.
Appendix A
Supplementary material
The following are the Supplementary data to this article:


