

Translate this page into:
Investigating the applicability of the social spider optimization for the inversion of magnetic anomalies caused by dykes
⁎Corresponding author. ahmed.eldosouky@sci.suezuni.edu.eg (Ahmed M. Eldosouky)
-
Received: ,
Accepted: ,
This article was originally published by Elsevier and was migrated to Scientific Scholar after the change of Publisher.
Peer review under responsibility of King Saud University.
Abstract
Dipping dykes are geologically important structures since they are very important structures for hydrogeological, geothermal and hydrocarbon research. Many methods have been introduced by researchers to interpret dykes from magnetic anomaly data, but each of these methods have limitations. Therefore, new techniques are constantly being developed to achieve better results. This study introduces a novel method based upon the Social Spider Optimization algorithm and tests the method using synthetic examples. The algorithm developed to decipher the source body properties, is presented in detail. The test data consists of synthetic anomalies corrupted by different levels of random noise and field anomalies from mining records in China and Turkey. The obtained results have showed that Social Spider Optimization is a reliable, stable and efficient tool for deciphering the physical properties of deep and shallow located dykes from magnetic data. In addition, the proposed method is recommended for inversion of other geophysics data such as self-potential and gravity data.
Keywords
Magnetic anomaly
Dyke
Social Spider Optimization

1 Introduction
For many years, magnetic prospecting has been used to investigate the subsurface structures associated with mineral deposits (Ben et al., 2021c). Dipping Dykes (DD), known as effective traps for hydrocarbons, are also known to be associated with heat contact in most geothermal production systems. Recently, it has been determined that dykes affect the local/regional aspect of mineralization. For this purpose, it has become important to use correct procedures to interpret anomalies related to dykes.
Several techniques have been adopted for the interpretation of dyke-related magnetic anomalies. Some of these procedures exploit numerical methods such as the gradient, iteration, Gauss and the simplex algorithms (Tlas and Asfahani, 2011; Won,1980; Tlas and Asfahani, 2015; Abdelrahman et al., 2012). However problems such as window size compatibility, noise sensitivity and, overreliance on subjectivity commonly impede the accuracy of these techniques. Recently and with improvements in machine learning techniques, it has been shown that these problems could be resolved if the numerical techniques were replaced by metaheuristic methods. Some employed techniques include Particle swarm optimization algorithm (PSO) (Essa and Elhussein, 2020), differential algorithm (Balkaya and Kaftan, 2021), Genetic-price algorithm (Di Maio et al., 2020), simulated annealing (Biswas and Acharya, 2016) amongst others. These intelligent algorithms’ strength behooves on the premise that, unlike other algorithms, the feasible solution search is independent of gradient (Ben et al., 2022a,b,c). Nevertheless, for these mentioned algorithms, their strength is also their weakness – over generalization of results due to concentration on agent swarms (Yu and Li, 2015). In this article, we present a new stochastic technique based on the Social Spider Optimization (SSO) algorithm that will attempt to eliminate this weakness.
The SSO is a bio-inspired metaheuristic that imitates the mutual behaviors of social spiders (Cuevas et al., 2018). Unlike other heuristic algorithms where optimization follows swarms of one agent type in a search domain, the SSO concurrently exploits the operational behavior of both female and male spiders (the agents) in a search space. Because the algorithm favors uniquely classified qualities over swarm traits, the collective behavioral outcomes of this individualized characterization are thus healthy reductions in crucial particle concentration problems, which are typical in most metaheuristic approaches (Sun et al., 2019). While reports from the application of this method with other problems (Fathy et al., 2020; Sahlol et al., 2019; Ben et al., 2022c) are encouraging, at the time of preparing the initial draft of this article, no application of SSO in dyke inversion has been reported in literature. This itself, is a novelty of the study.
2 Methodology
2.1 Forward modeling of a 2-D dipping dyke
Assuming a Cartesian coordinate system with the abscissa representing the sampling profile and the ordinate representing DD’s strike at burial depth z; the magnetic anomay (MA) of a DD structure at any point yi on the sampling profile is expressed as (1) (Ben et al., 2022a).
Magnetic field
Amplitude coefficients
Index angle
Total
Vertical
Horizontal
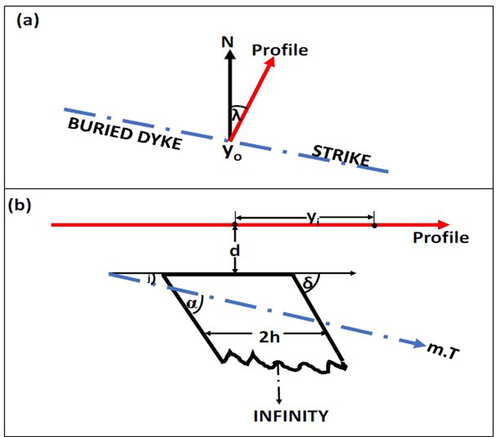
A dipping dyke model.
The process around deciphering the set of parameters describing subsurface structure from the geomagnetic datasets is straightforward. An initial model originally constructed with knowledge from historical geologic information is progressively improved through series of optimization processes based on the cost function (2) until a fitted version estimating data synonymous or that, near-synonymous with the observed data is obtained
2.2 Social spider optimization
The algorithm imitates the social spiders' cooperative attributes, where the female and male spiders cooperate as search agents in a communal web where the spiders move at random and across the search space, with each spider being promoted as a potential solution (). The method was built in seven phases as follows, using their behavioral pattern to solve the magnetic inversion problem:
Stage 1: The female and male population vectors of spiders (representing magnetic models or search agents) were first initiated at random in the search space. The female Nf and male Mf population were generated using (3) and (4) (Yu and Li, 2015);
Stage 2: In this step, all the spiders were given a weight, G. In S, each spider’s quality was rated using weight. Gi was determined from (5) as
Stage 3: Next, the agent’s movement process (VB) was simulated. This stage was numerically implemented using (6);
Stage 4: After establishing their movement, the position of the agents were initialized in the search space. Consistent with our DD problem, the position vectors were constructed as 4-D vectors representing the to-be-optimized parameters (K, h, α, and z). Each parameter value was generated within the space-dependent lower, LBj and upper, UBj bounds (7) and (8) (Fathy et al., 2020)
Stage 5: Based on the spider gender, the population's cooperative behavior was carried out amongst individual spiders for each iteration session.
That of the female spiders was done using (9) (Husodo et al., 2020; Ben et al., 2021b).
The co-operative behavior of male spiders was defined using (10).
Stage 6: In this stage, we carried out the selection of offspring for the next generation. To facilitate this, mating between dominant males and females was permitted within a specified radius (R) computed using (11) (Klein et al., 2016). The fitness values of the dominant spiders' progeny were assessed and contrasted with those of their parents. The child spiders were adopted and their parents were replaced if they spiders produced higher-quality results than their parents. This was done iteratively.
The quality of the findings acquired in that specific step was assessed at the conclusion of respective iterations by computing the mismatch between the measured and estimated data using the RMS error (2). Once a suitable RMS was arrived at, the four physical parameters (K, h, α, and z) were returned.
Fig. 2 is a summarized flowchart highlighting the stages implemented for the SSO procedure.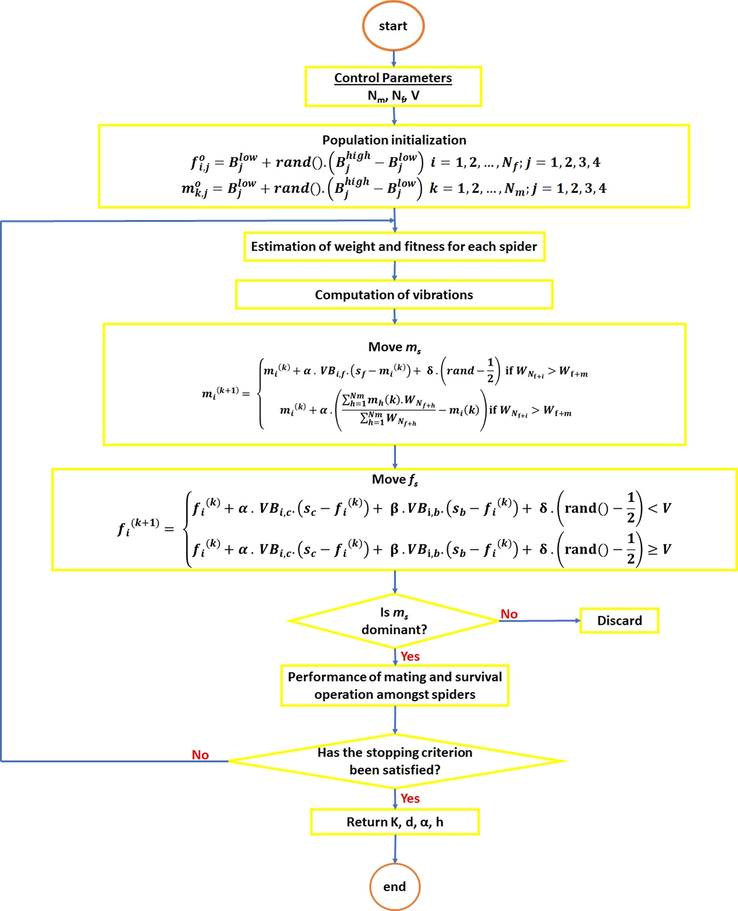
Flow chart of the SSO-adapted process.
2.3 Algorithm design/complexity
The program employed for the SSO process was designed in PYTHON3 installed on a simple Windows 10 desktop running with a Core i5 processor. For complexity, the program’s duration varied based on the complexity of the structure modeled. Howbeit in all cases, the optimization process rounded up in less than 20 s.
2.4 Uncertainty analysis
Uncertainty assessment analyses have come to be recognized as critical in inversion investigations (Connolly and Khan, 2016). This is because of the non-linearity, non-uniqueness, and ill-posedness of geophysical inverse problems (Ben et al., 2021c). For this study, uncertainty was appraised using the Metropolis-Hasting (MH) sampling approach.
Based on a previous distribution, MH offers many model suggestions. By resolving the forward issue and computing the misfit in the data, it is possible to determine the probability of any suggested model. The updated model is acceptable if the probability increases. Furthermore, the suggested model may still be adopted even if the probability declines. However, the likelihood ratio between the proposed and original models will decide the probability of this. By offering parameter confidence intervals, the technique, which is based on simulated annealing without cooling schedule, enabled for the appraisal of uncertainty (Ben et al., 2021c). In this study, 500 iterations were allowed for the MH algorithm.
2.5 Parameter tuning studies
The convergence point of the algorithm during inversion is greatly influenced by control parameters in nature-inspired global optimization algorithms. The effectiveness of every algorithm depends on these parameters (Granat, 2003). However, the problem under consideration significantly determines their choice (Ekinci et al., 2020). To identify the appropriate control parameters for the method, model parameters tuning was conducted before inversion.
For the tuning procedure, an MA dataset was synthetically constructed using (1) with K = 60 nT. Further, h = 15 m, z = 12 m, α = 55°, with a profile length of 300 m (Fig. 3a). For the experiment, broad search spaces (Table 1b.) were adopted for the model parameters. Finding the ideal values for the spider population (S) and the probability factor (V) in the search space was the primary objective of the parameter tuning analysis. Thirty independent runs consisting of 500 iterations were allowed for the optimization process. The value for S was obtained by multiplying the number of unknown parameters (4) by the number of independent runs (30)(Turgut, 2021). The MA problem was then statistically analyzed using the SD, mean, and minimum of RMS values obtained. After 30 runs, the results obtained by utilizing various V are shown in Table 1c. From the table, statistical results suggest that using 0.7 as the probability factor (boldface) for the magnetic data will ensure stability and efficiency of the optimization procedure. This was thus adopted the optimization problem. Another observation is the significant error gap between the value for V that provided the best results and the one that generated the poorest outcomes. This massive disparity could undoubtedly cause a substantial effect on the solution's accuracy with regards to optimal resolution of parameters. This highlights the necessity of the tuning process in optimization procedures.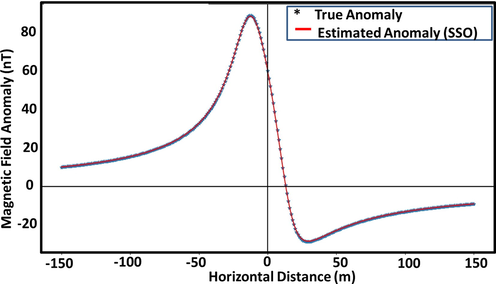
Design synthetic dyke anomaly.
V
RMS (nT)
minimum
mean
sd
0.4
1.51053
1.61293
0.90047
0.5
0.32654
0.52996
0.20163
0.6
0.20062
0.33642
0.12805
0.7
0.07143
0.07254
3.39915 × 10⁻⁷
0.8
0.11624
0.16081
1.72423 × 10⁻²
0.9
0.33762
0.50018
0.22656
Parameters
Space bounds
Actual (Control)
Estimated
K (nT)
[0, 500]
60.00
60.027
α (o)
[-90, 90]
55.00
54.983
h (m)
[0, 50]
15.00
14.996
z (m)
[0, 50]
12.00
12.101
3 Theoretical examples
To validate the performance of the suggested methodology, the algorithm was exposed to several preliminary controlled tests with clean and noisy synthetic anomaly data.
3.1 Noise-free anomaly
The SSO algorithm was applied for the modeling of noiseless theoretical anomalies for a dyke-like structure constructed with model parameters shown in Table 1c. The MA was designed using (1).
For the process and for each run, a maximum of five hundred iterations was allowed (Figs. 3b-4b). The corresponding model parameters obtained at the end of the process were respectively are shown in Table 1c.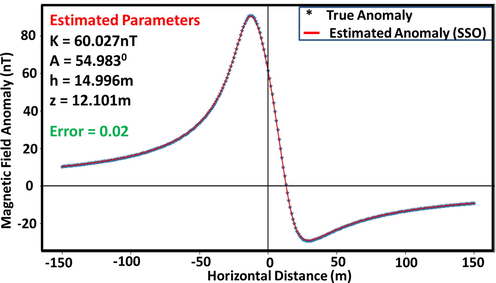
Actual and predicted anomaly parameters for synthetic dipping dyke model (Noiseless).
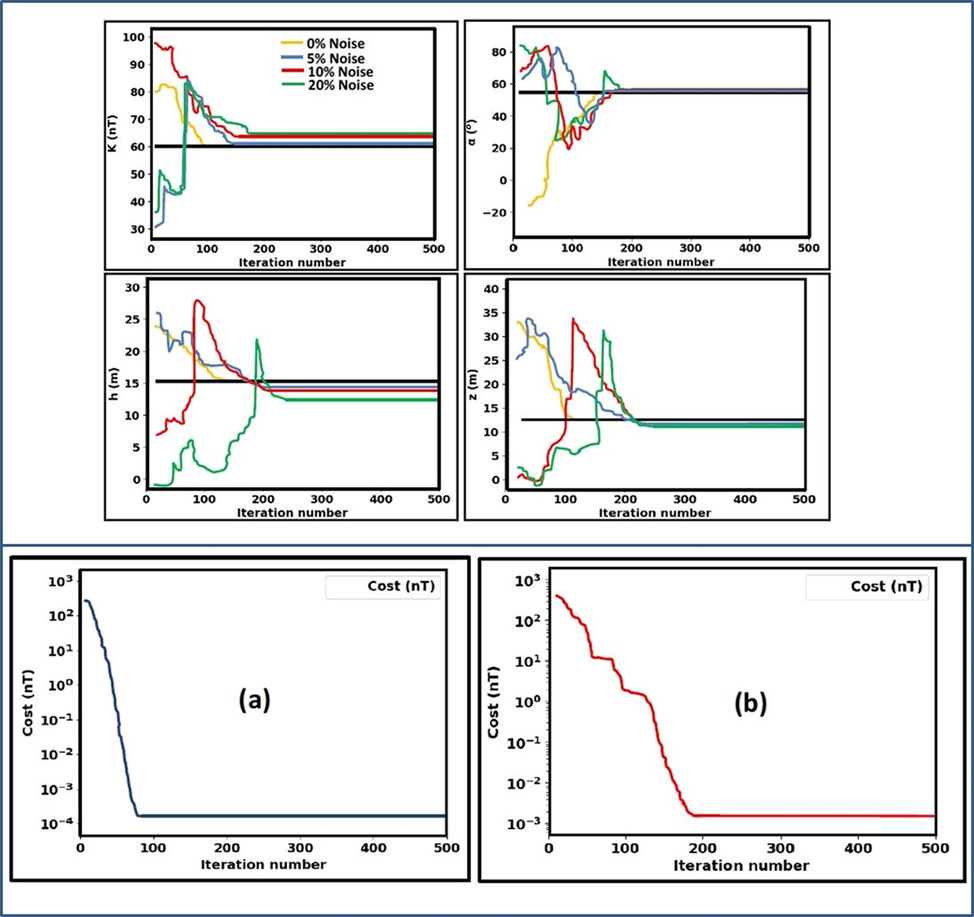
Convergence plots: Upper panel - Change in the model parameters vs iteration; Lower panel - Change in the model parameters vs iteration (a) Noiseless example, and (b) Noisy example.
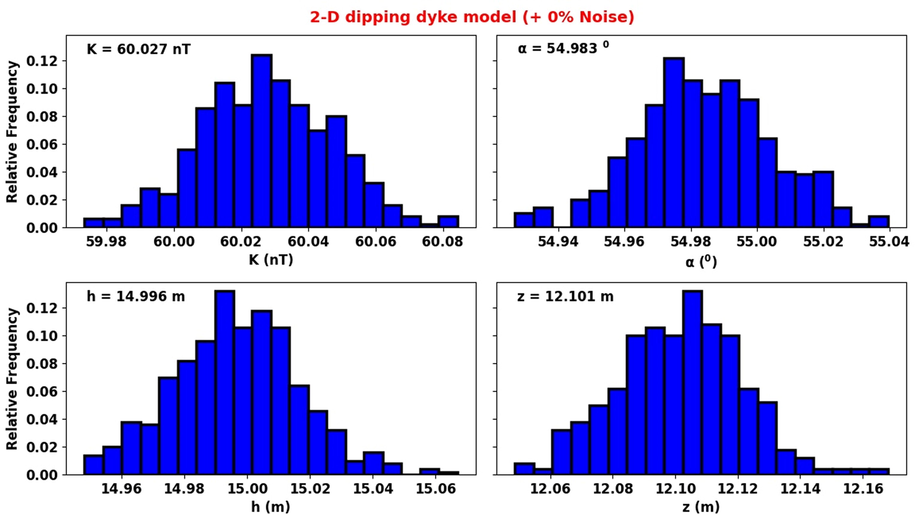
Uncertainty histogram reconstructed using MH algorithm (Noiseless anomaly).
Comparing these estimations with the actual parameters used in designing the model, it is evident that the new method’s estimation abilities are considerably excellent. Further, the MH technique was applied for the assessment of uncertainty in these parameters obtained. Our answers fall within adequate confidence intervals, according to a careful inspection of the histogram that was constructed after the MH uncertainty procedure (Section 2.7, Fig. 4b).
3.2 Noisy anomaly
Clean synthetic data was corrupted with 5, 10, and 20 % random noise to replicate real field conditions. The random numbers utilized in noise were naturally distributed and zero-mean (as with all Gaussian distributions). Table 2a displays the standard deviation (SD) of the noise content that was artificially introduced. These different levels of noise were included in order to test the effectiveness of SSO in less-than-ideal conditions, such as when there is noise from the host materials or nearby geologic intercalations. The random noise was created automatically using the MATH library. The percentage of corruption was computed using (12).
Percentage of Noise injected (%)
5
± 1.50
10
± 2.50
20
± 4.50
The SSO-based methodology was used once more to estimate the model parameters and the model ranges employed with the noiseless example were readopted. After each repetition, the convergence and misfit were examined.
The SSO algorithm-estimated model parameters and their actual values were found to be remarkably consistent (Table 2b., Figs. 5a-c). Another notable observation is that the K parameter (coefficient of amplitude) appeared to be more sensitive to increasing noise than other parameters. This sensitivity (attributed to the multiplication factor role taken by k in (1)), which is likely to affect interpretation when dealing with very complicated dyke systems, may be readily addressed by reducing the range of the space-bound. Also demonstrated by the results is that noise causes a slight increase in the after-convergence misfit and RMS error. However, the overall inversion process is unaffected by this since parameter results continue to be appealing even at a noise level of 20 % (Table 2b). Furthermore, the RMS obtained (Figs. 5b-d) was found to be well-matched to the standard deviation of the corruptions (Table 2a). Uncertainty histograms were constructed based on sampling done by MH and over model parameters for scenarios of the executed noisy models (Fig. 5d)(For the sake of brevity and paper space, only plots for 10 % noise are shown). The histograms reveal that the SSO sampling process is quite effective, as the actual parameter values estimated by the algorithm all fell within high probability regions. These show the SSO technique as being intrinsically stable and as admirably performing even when dealing with noisy datasets.
Model parameter
Noise percentage and observed results
5 %
10 %
20 %
K (nT)
61.835
64.476
65.548
α (o)
57.653
56.873
56.001
h (m)
14.781
14.279
13.145
z (m)
12.532
13.031
11.783
RMS (nT)
1.38
2.42
4.89
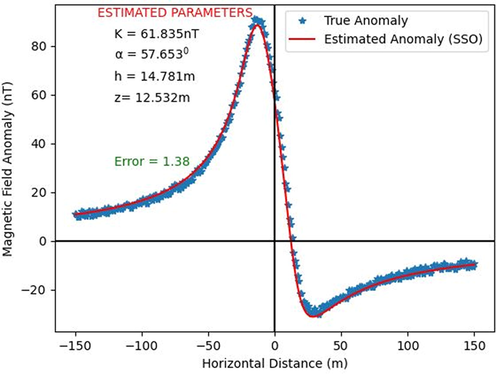
Actual and predicted anomaly parameters for synthetic dipping dyke model (5% noise).
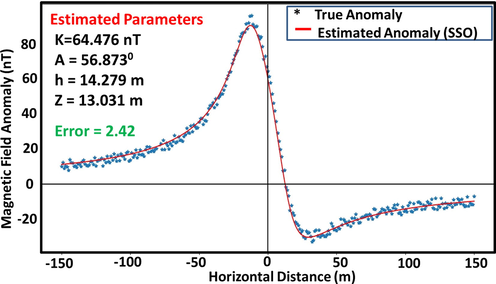
Actual and predicted anomaly parameters for synthetic dipping dyke model (10% noise).
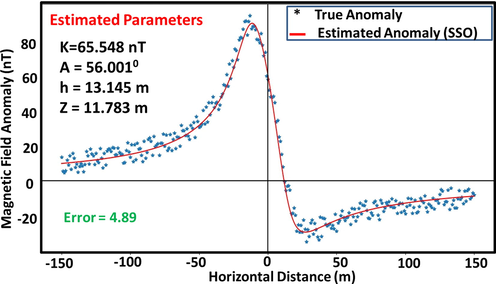
Actual and predicted anomaly parameters for synthetic dipping dyke model (20% noise).
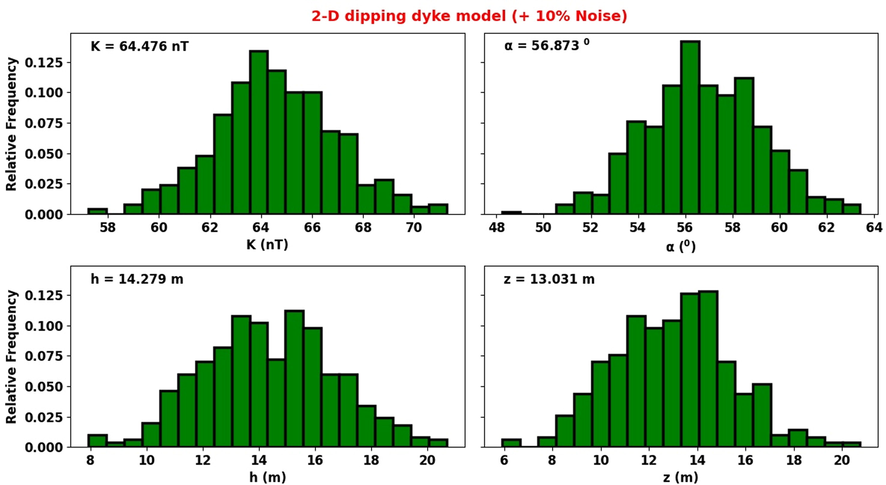
Uncertainty histogram reconstructed using MH algorithm (10% noise).
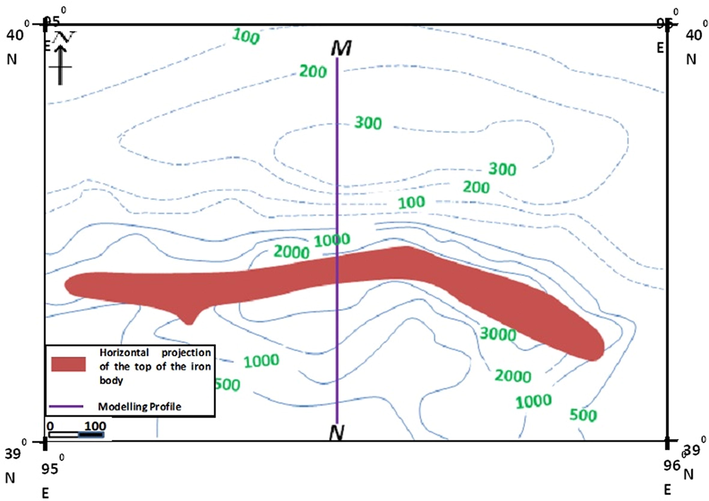
Section of total magnetic contour map of Gansu province showing the M163-1 mining area.
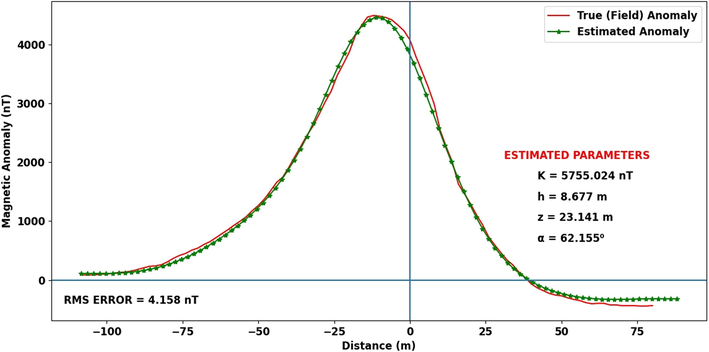
Observed and estimated magnetic anomaly (Magnetite ore deposit, China).
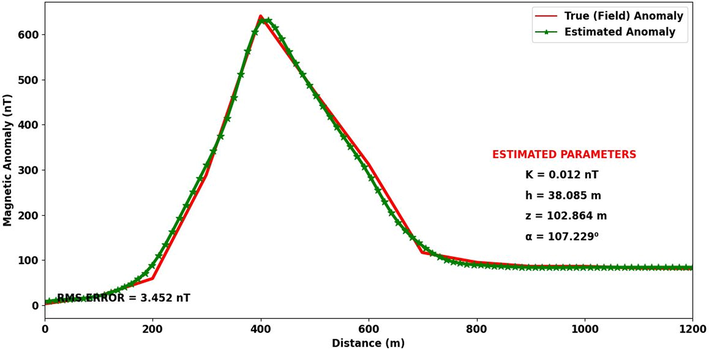
Observed and estimated magnetic anomaly (Bayburt-Sarıhan dyke).
4 Field examples
Two field examples taken from different mining regions in Turkey and Asia were used to experimentally assess the SSO method. Then, the parameters describing the physical properties of the subsurface magnetic anomalies were examined, and the findings from earlier studies reported in literature were contrasted with those obtained using the experimented method.
4.1 The magnetite iron deposit, China
In the early 1960 s, an aeromagnetic study in the Chinese province of Gansu, identified an alluvial covered area afterwards designated M163. This deposit has been developed further over the years and regarded as metasomatic contact of iron deposits (Zhang et al., 2019). Following a rigorous magnetic investigations, the anomaly was sectioned into 11 distinct and smaller individualized anomalies (Scott, 2006). The M163-1 MA was investigated in this investigation. A 200-m long MA profile (MN) spanning the M163-1 area was collected from a magnetic intensity contour map at 2-m intervals for this purpose (Fig. 6).
As the DD was suspected as a two-dimensional structure based on a priori geologic information, Estimation of its distinctive parameters based on this knowledge. However, before beginning the iteration process, the UB and LB were set based on Table 2c. The algorithm was executed using 30 individuals with 500 iterations allowed. The model parameters obtained after algorithm execution are displayed in Table 2c. The discernable similarity between the estimated and observed anomalies is revealing (Fig. 7a).
Model parameters
Space bound
Results
RMS error
K (nT)
[0, 20000]
5755.024
4.158 (nT)
α (o)
[-90, 90]
62.155
h (m)
[0, 50]
8.677
z (m)
[0, 50]
23.141
Table 3a compares model parameters produced by earlier researchers using various methods to those obtained by the SSO algorithm in this work. Petrophysical records (Guo et al., 1998) report the thickness of the alluvial overburden to be between 20 and 25 m. Using PSO, Essa and El-Hussein (2017) calculated that the DD, which he reported as being buried at z of 22.55 from the surface and inclined at 57.99°, is buried at a depth of 22.55 m. In contrast, Ben et al. (2021a) used MRFO to calculate the anomaly's h to be 20.10 m and α as 60.98°. It can be observed that our results are very consistent with those from these reports.
Model parameters
Gay (1963)
Essa & El Hussein (2017)
Ben et al. (2021)
Present study
K (nT)
–
8116.91
5636.60
5755.024
α (o)
–
57.99
60.98
62.155
h (m)
9.00
9.17
9.05
8.677
z (m)
22.25
22.24
20.10
23.141
4.2 The Bayburt-Sarıhan dyke
In this example, we employed the SSO for the interpretation of a shallow dyke in the Bayburt-Sarıhan skarn zone of Northeastern Turkey. The Bayburt-Sarıhan skarn zone is an extensive geologic zone dominated by granodiorite, limestone, volcanic sediments and tuffs. To the southwest of a skarn zone – and sandwiched between the limestone and the granodiorite unit, an intrusion mainly composed of magnetite was reported (Kaftan, 2017). We would be analyzing this intrusion.
Fig. 7b shows a profile extract of a vertical component MA map constructed for the region (Keskin et al., 1989) showing a 1200 m profile taken over the region. The profile was sampled at an interval of 200 m. Due to the paucity of geologic information for this structure, the bounds were kept open-ended; however, a bisection algorithm was inserted into the SSO structure to prevent indiscriminate movement of the agents. The results – after convergence, are shown in Table 3b and Fig. 7b. The RMS of 3.452nT was adjudged as impressive.
Model parameters
Results
RMS error
K (nT)
0.012
3.452 (nT)
α (o)
38.085
h (m)
102.864
z (m)
107.229
Aydın and Gelişli (1996) performed some anisotropic magnetic investigations in the region and showed the structure as an eastward DD with a slope of about 110°, depth of 100 m, and a half-width of 75 m. Dondurur and Pamukcu (2003) employed the damped least-squares inversion method on the same anomaly. They reported the depth to the dyke as 97 m, the inclination as 111°, h as 76 m, and z as 97 m. It can be discerned from these results, that the SSO produces estimations similar to those obtained by earlier workers (Table 3c).
Model parameters
Gay (1963)
Essa & El Hussein (2017)
Present study
K (nT)
–
–
0.012
α (o)
110
111
38.085
h (m)
75
76
102.864
z (m)
100
97
107.229
5 Discussion
A new method based on the SSO algorithm was designed for the magnetic inversion of DD models and subjected to a series of tests to gauge its adaptability and suitability. The new tool was tested with data synthetically generated from an already established forward model and examples extracted from real mining fields. The cases allowed evaluation of the new method's viability, strengths, and reputability.
In terms of performance, the convergence signatures (Fig. 4a) for all the cases indicate that the SSO possess strong and extensive search abilities. As can be observed, the agents (parameter vectors) are not caved up in the search space. This is not unrelated to the design structure (Section 2). Popular metaheuristics such as PSO, GA, and SA employ individuals with the same properties and performing nearly the same behaviors. In these cases, algorithms squander the opportunity to add new and selective operators resulting from considering individuals with different characteristics. As the algorithm advances, such characteristics cause the whole population to cluster around the best particle or to diverge indiscriminately, resulting in traditional concerns such as exploration–exploitation imbalance and premature convergence. The SSO, on the other hand, models each individual based on gender. In this case, the entire population is divided into several search-agent groups, and specialized operators are applied to each one selectively and explicitly. With this framework, extensive exploitation is achieved (16) in such a way that efficient exploration is still maintained (15) – tackling the aforementioned popular problems at a go.
More also, Fig. 3b reveals the fast convergence rate of the new method. In most cases, the algorithm converges in less than 150 iterations; and under 200 iterations for all cases. This speed notably, does not affect the quality of the result in any way as the RMS were consistently impressive even for noisy anomalies and field examples.
The algorithm was tested for sensitivity and stability by corrupting the synthetic data with random noise (Section 3.2). As expected, the results of the noisy data were found to be marginally worse than those of the noise-free counterpart. Nonetheless, as illustrated in Fig. 5c, the inversion procedure remained undisturbed, producing reliable parameters up to the highest level of noise tested (20 %). As a result, it may be inferred that the new technique is intrinsically adept when dealing with noisy data.
We further tested the new technique with real field data taken from Chinese and Turkish mining fields. As is generally known, it is not always assured that a novel algorithm's virtuosic performance with numerically generated data (which is normally constructed under ideal conditions) would always replicate with real-world data (subjected to heterogeneous factors). Besides confirming the algorithm's capabilities, the outputs of inversion of these anomalies were also similar to those acquired previously using alternative methods and petrophysical investigation.
The previously developed Monte-Carlo approach was used to check for ambiguity in each of the estimations (Section 2.6). A closer examination of the frequency distribution plots obtained after MH sampling reveals that the histograms show very reasonable ranges of solutions for K, h, d, and α. This implies that the estimations for these parameters are within the range of their actual values.
It must be added that in four of the synthetic examples and the Gansu anomaly example, we restricted the search space using historical information. However, one of the objectives of this study was to limit or if possible, eradicate such dependencies. So, for the Bayburt-Sarıhan dyke case, the bounds were left open and the performance of the algorithm assessed. From the results, it could be observed that the algorithm still performed excellently even when LB and UB were not explicitly defined presenting a method that can be employed where reconnaissance information is scarce or unavailable.
These features unanimously imply the new methodology is a robust tool, stable and efficient for deciphering the physical characteristics of deep and shallow-seated dykes from magnetic data.
6 Conclusion
Metaheuristic-based techniques have been found to be more effective than their numerical counterparts in exploring/exploiting potential solution-leading positions. Nonetheless, despite significant-resolution advancements, several strategies employing metaheuristic procedures are still plagued by problems such as premature convergence, local optima, and so on. These discrepancies have necessitated a quest for better-performing inversion methods. The SSO algorithm's capability and effectiveness in modeling the physical parameters describing magnetic anomalies from DDs were examined in this study. In contrast to previously studied heuristic algorithms in which a general population concentrating around a single particle vector (best particle) is used to modify individual positions, the SSO algorithm models each individual based on their gender. Unlike other metaheuristics, SSO models individuals based on gender encouraging the de-individualization of best-positioned agents and allowing for the introduction of computational procedures to mitigate major problems disturbing traditional techniques. The experiments on both synthetic and real-world anomalies with varying levels of corruption were quite successful. To measure success, model stability was evaluated, and general performance was assessed.
The SSO technique demonstrated both better convergence and solution correctness. These characteristics point to a competitive processing tool, one that could easily outperform present algorithms. It must be added that while the decoupling of search agents based on gender allowed for more extensive exploration and improved quality resolution, it is observed that this is at the expense of speed. This is but a limitation of the algorithm which (as a recommendation) could be improved through modifications and hybridization.
We also recommend investigation of SSO with structures with higher complexities, such as self-potential and gravity data. The metaheuristic technique can also be restructured for three-dimensional geophysical problems.
Acknowledgements
This research was supported by Researchers Supporting Project number (RSP2022R425), King Saud University, Riyadh, Saudi Arabia.
Declaration of Competing Interest
The authors declare that they have no known competing financial interests or personal relationships that could have appeared to influence the work reported in this paper.
References
- Parametric inversion of residual magnetic anomalies due to simple geometric bodies. Exploration Geophys. 2012
- [CrossRef] [Google Scholar]
- Inverse modelling via differential search algorithm for interpreting magnetic anomalies caused by 2D dyke-shaped bodies. J. Earth System Sci. 2021
- [CrossRef] [Google Scholar]
- Integrated technical analysis of wind speed data for wind energy potential assessment in parts of southern and central Nigeria. Cleaner Eng. Technol. 2021
- [CrossRef] [Google Scholar]
- Novel technique for the interpretation of gravity anomalies over geologic structures with idealized geometries using the Manta ray foraging optimization. J. Asian Earth Sci.. 2021;X
- [CrossRef] [Google Scholar]
- Novel Methodology for Interpretation of Magnetic Anomalies Due to Two-Dimensional Dipping Dikes Using the Manta Ray Foraging Optimization. J. Appl. Geophys. 2021
- [CrossRef] [Google Scholar]
- Novel methodology for the geophysical interpretation of magnetic anomalies due to simple geometrical bodies using social spider optimization (SSO) algorithm. Heliyon 2022
- [CrossRef] [Google Scholar]
- A novel method for estimating model parameters from geophysical anomalies of structural faults using the manta-ray foraging optimization. section Solid Earth Geophysics Front. Earth Sci. 2022
- [CrossRef] [Google Scholar]
- Interpretation of magnetic anomalies over simple geometrical structures using Manta-Ray foraging (MRF) Optimization. Sec. Solid Earth Geophysics Front. Earth Sci.. 2022;46(1):152-165.
- [Google Scholar]
- A very fast simulated annealing method for inversion of magnetic anomaly over semi-infinite vertical rod-type structure. Modeling Earth Systems and Environment 2016
- [CrossRef] [Google Scholar]
- Uncertainty of mantle geophysical properties computed from phase equilibrium models. Geophys. Res. Lett. 2016
- [CrossRef] [Google Scholar]
- The metaheuristic algorithm of the social-spider. Stud. Comput. Intell. 2018
- [CrossRef] [Google Scholar]
- Modeling of magnetic anomalies generated by simple geological structures through Genetic-Price inversion algorithm. Physics of the Earth and Planetary Interiors 2020
- [CrossRef] [Google Scholar]
- Interpretation of magnetic anomalies from dipping dike model using inverse solution, power spectrum and Hilbert transform methods. J. Balkan Geophys. Soc.. 2003;6(2):127-136.
- [Google Scholar]
- Global optimization of near-surface potential field anomalies through metaheuristics. In: Biswas A., Sharma S.P., eds. Advances in Modelling and interpretation in Near Surface Geophysics. Series of Springer Geophysics, Springer International Publishing; 2020. p. :155-188.
- [CrossRef] [Google Scholar]
- A new approach for the interpretation of self-potential data by 2-D inclined plate. J. Appl. Geophys. 2017
- [CrossRef] [Google Scholar]
- Interpretation of Magnetic Data Through Particle Swarm Optimization: Mineral Exploration Cases Studies. Nat. Resources Res. 2020
- [CrossRef] [Google Scholar]
- Recent approach based social spider optimizer for optimal sizing of hybrid PV/wind/battery/diesel integrated microgrid in Aljouf Region. IEEE Access 2020
- [CrossRef] [Google Scholar]
- A method of hidden markov model optimization for use with geophysical data sets. Lect. Notes Comput. Sci. Including Subseries Lect. Notes Artif. Intell. Lect. Notes Bioinfo. 2003
- [CrossRef] [Google Scholar]
- Self demagnetization corrections in magnetic modelling: some examples. Explor. Geophys.. 1998;29:396-401.
- [Google Scholar]
- Enhanced social spider optimization algorithm for increasing performance of multiple pursuer drones in neutralizing attacks from multiple evader drones. IEEE Access 2020
- [CrossRef] [Google Scholar]
- Interpretation of magnetic anomalies using a genetic algorithm. Acta Geophys. 2017
- [CrossRef] [Google Scholar]
- Keskin, I., Korkmaz, S., Gedik, I., Ate., M., Gök, L., Küçükmen, M. and Erkal, T., 1989. Geology of Bayburt and Surrounding Areas, MTA, Geol. Prosp. Div., Ankara (in Turkish)
- Modified Social-Spider Optimization Algorithm Applied to Electromagnetic Optimization. IEEE Trans. Magnetics 2016
- [CrossRef] [Google Scholar]
- Automatic acute lymphoblastic leukemia classification model using social spider optimization algorithm. Soft. Comput. 2019
- [CrossRef] [Google Scholar]
- Metallographic Examination of Iron Artefacts from Gansu Province. China: Historical Metallurgy; 2006.
- The adaptive particle swarm optimization technique for solving microseismic source location parameters. Nonlinear Processes Geophys. 2019
- [CrossRef] [Google Scholar]
- Fair function minimization for interpretation of magnetic anomalies due to thin dikes, spheres and faults. J. Appl. Geophys. 2011
- [CrossRef] [Google Scholar]
- The Simplex Algorithm for Best-Estimate of Magnetic Parameters Related to Simple Geometric- Shaped Structures. Mathemat. Geosci. 2015
- [CrossRef] [Google Scholar]
- A novel chaotic manta-ray foraging optimization algorithm for thermo-economic design optimization of an air-fin cooler. SN Applied Sciences 2021
- [CrossRef] [Google Scholar]
- Won, I. J. 1980. Application of Gauss’s Method to Magnetic Anomalies of Dipping Dikes. Geophysics. https://doi.org/10.1190/1.1441192
- A social spider algorithm for global optimization. Appl. Soft Comput. J. 2015
- [CrossRef] [Google Scholar]
- Zhang, S. X., Hu, Q. Q., Wang, Y. T., Wei, R., Ke, C. H. 2019. Characteristics of Ore Geology and Ore-Controlling Factors of Giant Guojiagou Pb-Zn Deposit in Xicheng Ore Concentration Area, Western Qinling. Mineral Deposits. https://doi.org/10.16111/j.0258-7106.2019.05.012
Appendix A
Supplementary material
Supplementary data to this article can be found online at https://doi.org/10.1016/j.jksus.2023.102569.
Appendix A
Supplementary material
The following are the Supplementary data to this article:


