

Translate this page into:
Influence of operational parameters and kinetics analysis on photocatalytic hydrolysis of ammonia borane for H2 production used heterojunction FeTiO3/TiO2-decorated carbon nanofibers
⁎Corresponding author. aymanyousef84@gmail.com (Ayman Yousef)
-
Received: ,
Accepted: ,
This article was originally published by Elsevier and was migrated to Scientific Scholar after the change of Publisher.
Peer review under responsibility of King Saud University.
Abstract
Abstract
In this work, carbon nanofibers (CNFs) decorated with heterojunction iron titanate/titanate nanoparticles (FeTiO3/TiO2 NPs) were effectively prepared using electrospinning for use as a photocatalyst in the production of hydrogen (H2) from ammonia borane (AB). The as-prepared FeTiO3/TiO2@CNFs exhibited strong photocatalytic activity for H2 release from photohydrolysis of the AB when exposed to visible light. Under visible light illumination, the observed H2 evolution over TiO2@CNFs was 0.38 mol in 14 min, whereas over FeTiO3/TiO2@CNFs it was 2.97 mol. Using FeTiO3/TiO2@CNFs, H2 generation was shown to be substantially higher under visible light irradiation (2.97 mol/14 min) than in the dark (1.87 mol/14 min). A mathematical model was used to predict the photocatalytic activity of FeTiO3/TiO2@CNFs. Different operational factors were used to verify the accuracy of the mathematical model; they included the impact of AB concentration, light intensity, reaction temperature, and catalyst dosage. The reaction rate constant and equilibrium concentration were measured experimentally and compared to those predicted by the model. A good correlation was obtained between the calculated and measured photocatalytic activity.
Keywords
Iron Titanate
Nanofibers
Ammonia Borane Complex
Hydrogen
Electrospinning
Visible Light

1 Introduction
Advancement of the hydrogen economy has raised awareness of solid hydrogen storage materials (Simagina et al., 2021). Amongst, Ammonia borane (NH3BH3, AB) has gained interest due to its low molecular weight (30.87 g/mol), high hydrogen content (19.6 wt%), and durability in solid and aqueous solutions at ambient conditions (Demirci 2017). If an appropriate catalytic material is utilized, H2 could be easily released from AB. The following equation describes the catalytic hydrolysis:
The first evidence of AB photohydrolysis was published in 2012 by Ayman et al (Yousef et al., 2012a). Many investigations have been carried on since then, with the aim of releasing hydrogen from AB using photocatalytic materials of different types and compositions (Yousef et al., 2012b, Yousef et al., 2013, Yousef et al., 2015a, Song et al., 2021, Yan et al., 2021). The photohydrolysis process may release gravimetric hydrogen capacity in AB, similar to conventional hydrolysis, while light irradiation can limit ammonia formation (Simagina et al., 2021). Photocatalysis, a “green” technology, offers significant promise for producing green energy and environmental remediation by removing hazardous compounds and pathogens (Hoffmann et al., 1995). Recent years have seen much research on photocatalysts incorporating metal oxides, sulfides, halides, etc (Yousef et al., 2012c, Yousef et al., 2017a). However, it is still difficult to develop photocatalysts that are effective, long-lasting, inexpensive, and kind on the environment. Thus, researchers have placed a premium in recent years on finding ways to modify materials to increase their photocatalytic activity. Recently, perovskite-type oxides have been presented as a potential photocatalytic material due to their visible light-driven characteristics (Moradi et al., 2021). Amongst them, Iron titanate (FeTiO3) is attractive because to its non-toxicity, cheapness, and chemical and physical stability (Kim et al., 2009, Abdou and Fadl 2019). It is used in a broad variety of electromagnetic, chemical catalysts, photocatalysts optoelectronic and device applications due to its low band gap (2.5–2.9 eV) (Kim et al., 2009, Verma et al., 2014). The presence of Fe in the TiO2 lattice could be improving its band gap and crystallinity (Moradi et al., 2021). Lee and his group developed a heterojunction of FeTiO3 and TiO2. The proposed photocatalyst was very effective in photodegrading organic molecules under UV light irradiation (Kim et al., 2009). Quang and etal (Truong et al., 2012), used a hydrothermal process to prepared heterojunction FeTiO3/TiO2 photocatalysts. The developed photocatalyst showed excellent photocatalytic activity in the conversion of CO2 to CH3OH under both visible and UV- light irradiation. Masoud Moradi etal (Moradi et al., 2021), mixed graphene oxide (GO) with FeTiO3 to reduce the band gap and improve the shift in the visible light range. They found that visible light causes faster photodegradation of phenolic compounds than ultraviolet light. High photocatalytic activity in the degradation of phenolic compounds was observed after 240 min of solar light irradiation. Incorporating GO into FeTiO3 improved visible light absorption with decreasing hole-electro recombination. As is well-known, the shape and structure of nanomaterials, which in turn impact their catalytic activity, are directly influenced by the technique of synthesis used (Yousef et al., 2017b). Previous studies shown that carbon nanofibers (CNFs) may easily capture and transport photo-induce charges during the photocatalytic process owing to their high electrical conductivity (Liu et al., 2008, Unalan et al., 2008). The fabrication of heterojunction FeTiO3/TiO2@CNFs and their photocatalytic activity toward AB photohydrolysis are reported for the first time in the current study. The electrospinning technique was used in the preparation of the photocatalyst. Good photocatalytic activity towards H2 production from AB photohydrolysis was shown for the synthesized NFs
2 Experimental
Experimental part is available in supporting information.
3 Results and discussion
3.1 Morphology study
There are a variety of techniques for making NFs, but electrospinning is by far the most common. The produced NFs have an excellent nanofibrous structure (Yousef et al., 2015b, Al-Enizi et al., 2017, Al-Enizi et al., 2019, Al-Enizi et al., 2020). Electrospun NF mats may have their nanofibrous structure preserved by sintering them at high temperatures in an inert atmosphere (Yousef et al., 2017c, Yousef et al., 2017d). Electrospun NF mats containing FeAc, TIIP, and PVP are shown in Sem image (Fig. 1A) after being vacuum dried at 50 °C overnight. The resulting NFs are shown to be smooth, continuous, and bead-free. Sintering at 800 °C for 5 h in an argon environment maintains the nanofibrous structure, which is an interesting finding (Fig. 1 B). In addition, tiny, white NPs may be seen growing on the surface of NFs. Due to polymer partial breakdown, the size of electrospun NF mats was significantly reduced during calcination, from 251.09 nm to 144.81 nm (Fig. 1C and D). EDX analysis (Inset Fig. 1B) reveals that iron (Fe), titanium (Ti), oxygen (O), and carbon (C) are the only elements present in the NFs.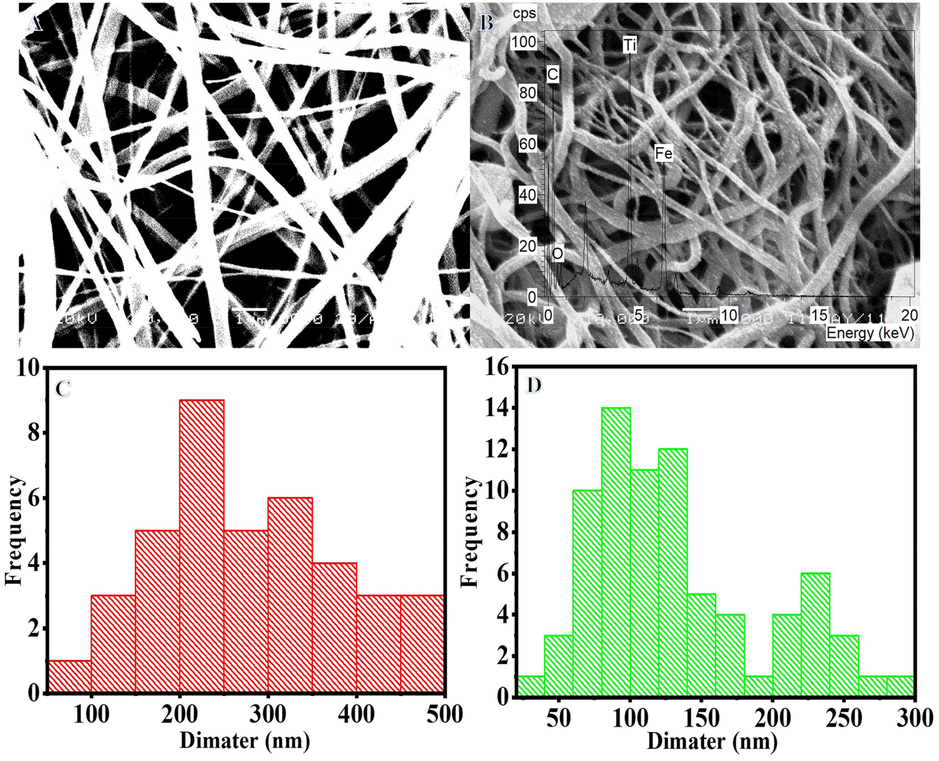
SEM images of the electrospun FeAc/TIIP/PVP nanofiber mats after drying at 50 °C overnight (A) and the produced powder after calcination in Ar at 800 °C (B).
3.2 Phase study
Fig. 2A displays the XRD patterns of the powder produced following the calcination process. According to the data, the formation of one peak from tetragonal TiO2 rutile phase (JCPDS#21–1276) at 2θ value ∼ 36.62° corresponds to (1 0 1). The hexagonal ilmenite FeTiO3 phase (JCPDS#03–0781) has four peaks with 2θ value ∼ 42.67°, 61.58°, 73.56°, and 77.63°, which are consistent with (2 0 2), (2 1 4), (2 1 7), and (2 2 3). In addition, a low intensity peak at a 2θ value ∼ 26.1° is seen, which is associated with the (0 0 2) and suggests the synthesis of carbon-like graphite (Yousef et al., 2017a, 2017b, 2017c, 2017d, Xue et al., 2021). The crystallite diameters of FeTiO3 and TiO2 were determined using Scherrer's equation to be 4.56 and 5.19 nm, respectively. Fig. 2B shows a normal TEM image of the introduced NFs. Growth of NPs on the surface of NFs is easily visible in this image. The generated NPs might be FeTiO3/TiO2, whereas the NFs could be carbon. The HR-TEM image (red circle in Fig. 2B) displays a high crystalline structure with parallel atomic planes (Fig. 2C). Furthermore, distinct lattice fringes were identified in the sample, which might be related to the FeTiO3 and/or TiO2 phases. The production of polycrystalline material is shown in the SAED pattern of the designated region (red circle in Fig. 2B) seen in inset Fig. 2C. As demonstrated in Fig. 2D, the primary NFs are formed of amorphous structure (blue circle in Fig. 2B), suggesting the development of amorphous carbon. It may say that the NPs are crystalline FeTiO3/TiO2 NPs, while the NFs are amorphous carbon. TEM-EDX was utilized to determine the chemical composition of produced NFs (Fig. 3). Fig. 3A depicts a STEM image of a single chosen NF, as well as a line TEM-EDX analysis and the related EDX analysis, which are displayed in Fig. 3B, C, D, and E. The identical distributions of Ti, O, Fe, and C are observed, as illustrated in Figure, providing more evidence for the synthesis of FeTiO3 and TiO2. The addition of carbon to the phtocatalytic process may result in the following benefits: i) enhance photo-induced e- and h+ separation, and ii) enhance AB contact with the photocatalyst, via an adsorption process.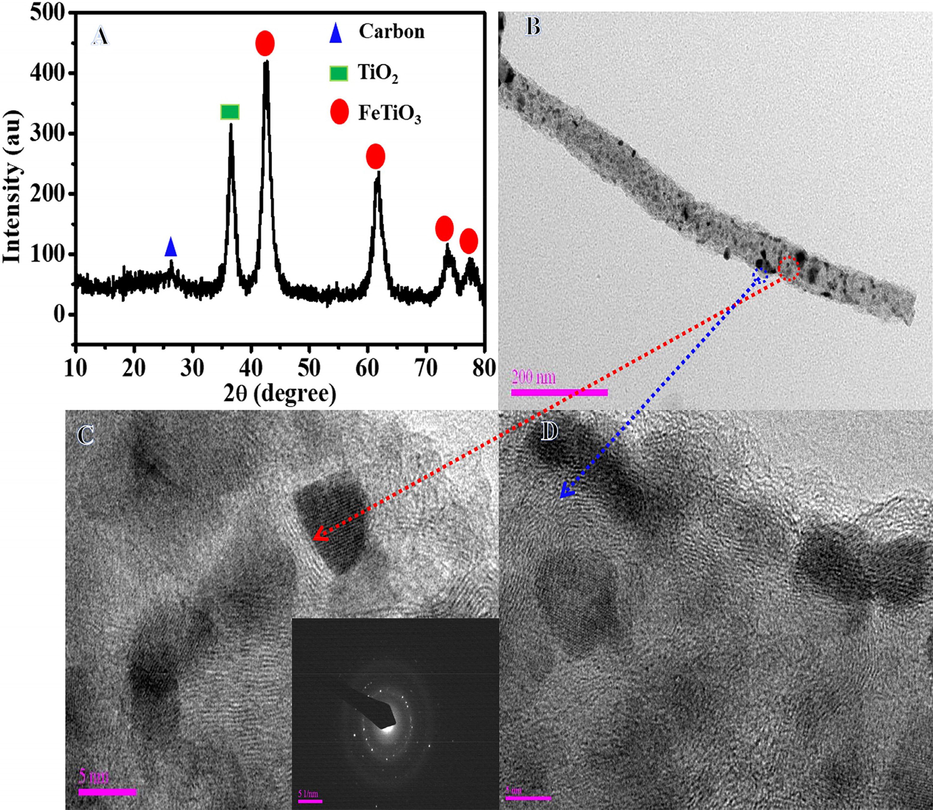
XRD patterns (A), Normal TEM image of single NF (B) and HR-TEM images (C, D) of produced powder after calcination of electrospun FeAc/TIIP/PVP nanofiber mats at 800 °C in Ar atmosphere. The inset in Panel C represents the SAED of the marked area (red circle).
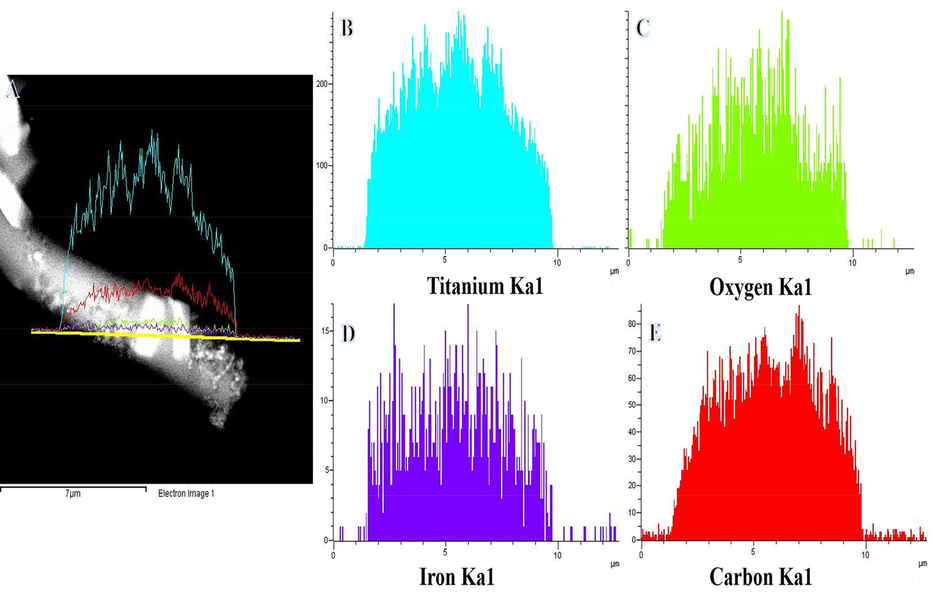
TEM image of single NF along with the line TEM EDX analysis (A) and the corresponding Ti, O, Fe, and C line analyses TEM EDX (B, C, D).
3.3 H2 generation from the photohydrolysis of AB
At ambient temperature and under visible light irradiation (I = 25 Wm−2), the photocatalytic activity of TiO2@CNFs and FeTiO3/TiO2@CNFs was evaluated in terms of H2 release from the hydrolysis of AB (1 mmol AB) (Fig. 4). The observed H2 evolution over TiO2@CNFs and FeTiO3/TiO2@CNFs were found to be 0.38 and 2.97 mmol in 14 min, respectively. FeTiO3/TiO2@CNFs displayed substantially greater activity than TiO2@CNFs. This might be because to the quicker electro/hole separation on FeTiO3/TiO2@CNFs, which improves H2 production from AB photohydrolysis compared to TiO2@CNFs. Also, H2 generation was shown to be substantially higher in the presence of visible light than in the absence of it (Fig. 4). Even when exposed to visible light, no H2 was detected in the absence of a photocatalyst, showing that AB was extremely stable in water. The effects of starting concentration (Ci), reaction temperature (T), photocatalyst dosage (CNFs), and light intensity (I) on the photocatalytic process have been investigated, and a mathematical model to predict these reactions has been developed (Eq.S2) (Ali et al., 2020):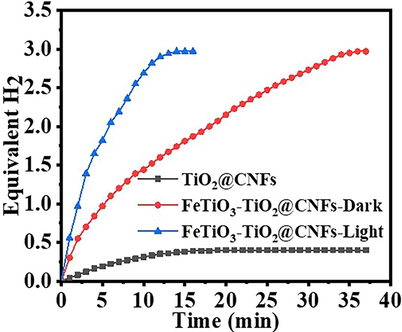
H2 generation in the presence of different photocatalysts. (Photocatalyst amount = 0.2 gm L-1, Ci = 0.1 M, T = 298 K, and I = 25 W m−2).
3.3.1 Effect of initial AB concentration (Ci)
Under visible light irradiation, the influence of the initial AB concentration (0.1, 0.2, 0.3, and 0.4 M) on H2 generation from AB photohydrolysis was studied (Fig. 5A). As indicated in the Figure, the initial H2 production rate was relatively unaffected by the AB concentration. The photoproduction of H2 at varying AB concentrations may be attributed to a pseudo-first order reaction, as described by the Langmuir Hinshelwood (LH) model (Eq. S3).![Influence of [AB] on H2 generation (A), ln Ci/Cf vs time (B), Modified LH plot for AB photohydrolysis (C). (Photocatalyst amount = 0.2 gm L-1, T = 298 K, and I = 25 W m−2).](/content/185/2023/35/3/img/10.1016_j.jksus.2022.102538-fig6.png)
Influence of [AB] on H2 generation (A), ln Ci/Cf vs time (B), Modified LH plot for AB photohydrolysis (C). (Photocatalyst amount = 0.2 gm L-1, T = 298 K, and I = 25 W m−2).
The relationship between ln Ci/Cf and reaction time is seen in Fig. 5B. Rate constants (K1) may be estimated from the slopes of the straight lines shown in Fig. 5B. As [AB] increases from 0.1 to 0.4 M, K1 decreases from 0.2318 to 0.0504 min−1 (Table S1). By transforming Eq. S7 into a straight-line equation, we can determine the correlation between K1 and initial [AB] (Fig. 5C).
3.3.2 Effect of reaction temperature (T)
The rate of H2 production in the presence of FeTiO3/TiO2@CNFs vs irradiation time over a range of reaction temperatures is shown in Fig. 6A. Figure shows that when the reaction temperature is raised from 25 to 40 °C, photohydrolysis of AB increases due to enhanced charge carrier mobility and interfacial charge transfer. As the temperature of the reaction rises, photoelectron-hole pair movement increases, accelerating the interaction between adsorbed oxygen and electrons and between holes and OH radicals, speeding up AB photohydrolysis (Ojstršek et al., 2013, Meng et al., 2017, Chen and Hsu 2021). The kinetic analyses of AB photohydrolysis over FeTiO3/TiO2@CNFs at different temperatures are shown in Fig. 6B. Increases in the AB photohydrolysis efficiency with increasing temperature are shown by an increase in the reaction rate (K2) from 0.2318 to 0.4148 min−1 as the reaction temperature increases from 25 to 40 °C (Table S1). A straight-line slope from Fig. 6B could be used to determine the rate constant (K2). The plot of K2 vs 1/T reveals a straight-line relationship (Fig. 6C). Using the Arrhenius equation (Eq. S8), we can get the activation energy (Ea) = 3.0162X10⁴ of the photocatalytic process (Marandi et al., 2012). Applying the natural log to both sides of Eq. S9 to remove the exponent.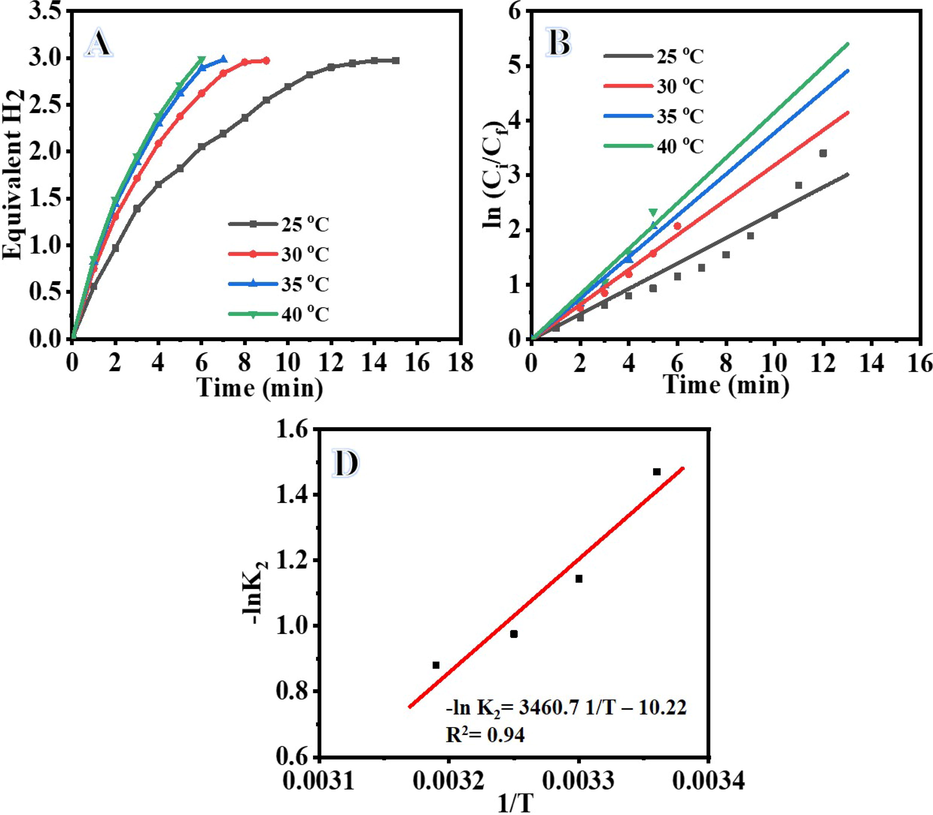
Influence of Temperature on H2 generation (A), ln Ci/Cf vs time (B), and (C) and Arrhenius plot for AB photohydrolysis. (Photocatalyst amount = 0.2 gm L-1, Ci = 0.1 M, and I = 25 W m−2).
3.3.3 Effect of light intensity (I)
Increases in light intensity increase the rate at which H2 is produced by AB photohydrolysis (Wei et al., 2021). The influence of light intensity on AB photohydrolysis is shown in Fig. 7A. According to the results, the photohydrolysis rate of AB improved when the light intensity was increased. Enhanced AB photohydrolysis is likely due to an increase in the number of photons available per unit of time. The rate constant (K3) could be determined from the slope of the straight lines produced from the plot of ln (H2 generation rate) vs time (Fig. 7B) under varying light intensities. With an increase in light intensity, AB photohydrolysis increases, as shown by an increase in K3 from 0.2318 to 0.3131 min−1 between 25 and 40 Wm−2 (Table S1). Since K3 is directly proportional to I, we may determine their relationship by plotting 1/K3 vs I (Fig. 7C) and calculating for I using Eq. S10.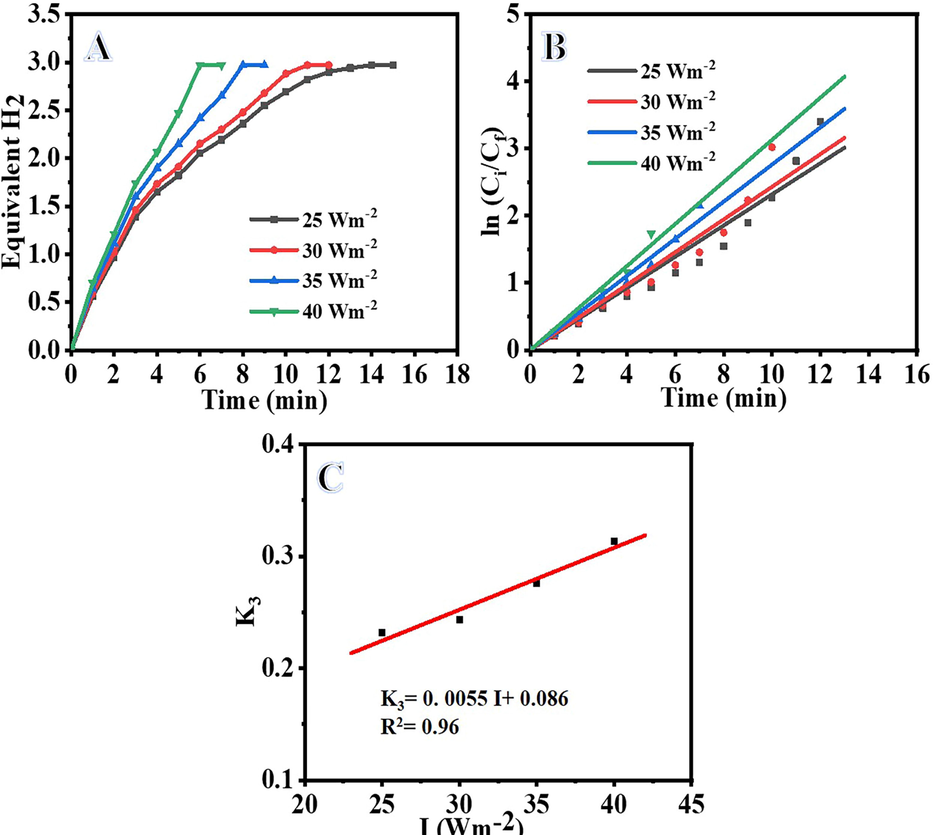
Influence of light intensity on H2 generation (A), ln Ci/Cf vs time (B), and logarithmic value of the H2 generation vs logarithmic value of light intensity (C). (Photocatalyst amount = 0.2 gm L-1, Ci = 0.1 M and T = 298 K).
3.3.4 Effect of photocatalyst dose (FeTiO3/TiO2@CNFs)
H2 production rate vs irradiation time for different FeTiO3/TiO2@CNFs concentrations (0.2, 0.3, 0.4, and 0.5 gm L-1) is shown in Fig. 8A. Increases in the concentration of FeTiO3/TiO2@CNFs result in a higher rate of H2 production, as indicated in the figure. This could be due to the increased surface area of the FeTiO3/TiO2@CNFs facilitates more efficient AB photohydrolysis. The kinetic studies over varying amounts of FeTiO3/TiO2@CNFs are shown in Fig. 8B. When the photocatalyst concentration is increasing from 0.2 to 0.5 gm L-1 (Table S1), the reaction rate (K4) increases from 0.2318 to 0.5533 min−1, showing an enhancement in the AB photohydrolysis. This may be because more adsorption and catalytic sites are available at the surface as a result of the higher concentration of FeTiO3/TiO2@CNFs. Fig. 8C illustrates the relationship between the logarithm of the reaction rate (K4) and the logarithm of the dosage of [FeTiO3/TiO2@CNFs]. According to the best-fit line, the generated H2 follows pseudo-first order kinetics in terms of catalyst concentration, with a slope of 0.9912. The Langmuir-type relationship (Eq. S11) (Ali et al., 2020) was used to determine how the FeTiO3/TiO2@CNFs concentration affected K4 (Fig. 8D).This equation can be transforming to straight line equation (Eq. S12).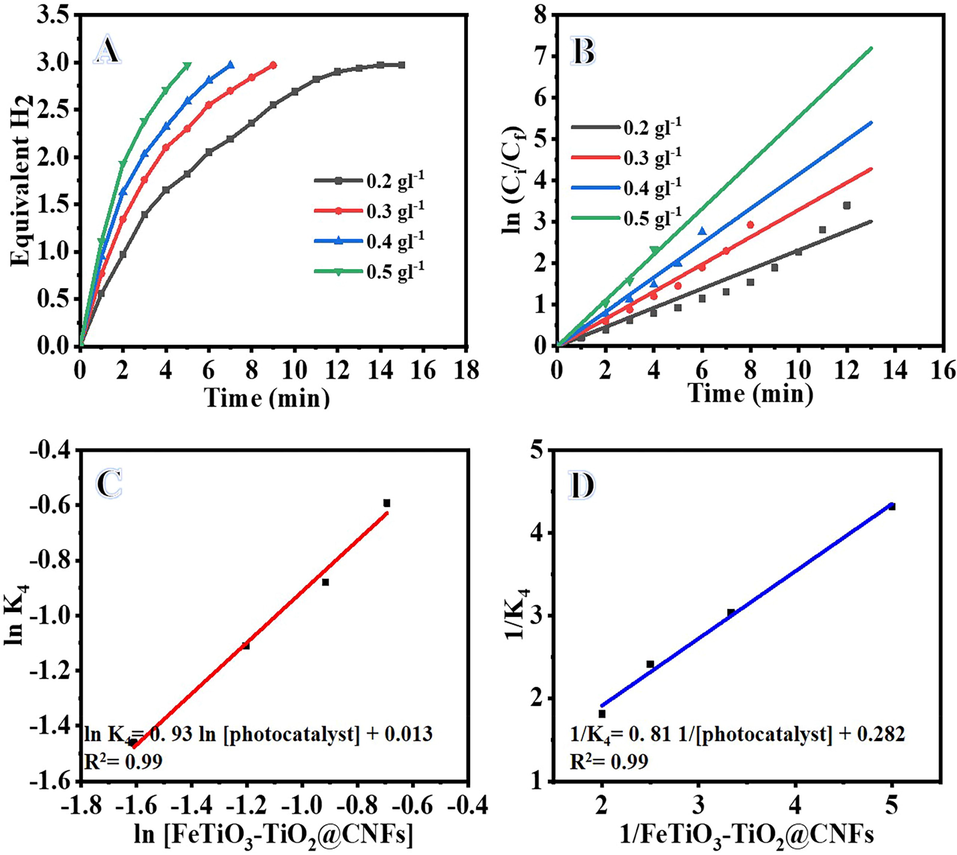
Influence of catalyst amount on H2 generation (A), ln Ci/Cf vs time (B), the logarithmic value of the H2 generation rate vs logarithmic value of photocatalyst amount (C), and Langmuir-type plot for AB photohydrolysis (D). (Ci = 0.1 M, T = 298 K, and I = 25 W m−2).
3.3.5 Development of model rate equation
According to Equations (S7), (S9), (S10), and (S11), the rate constant is a function of the FeTiO3/TiO2@CNFs dose, AB concentration, light intensity, and reaction temperature. Table S2 displays the calculated values of KR, Ea, m, and KNFs using multiple regression analysis. The equation constant k’ was calculated using Eq. S2 by substituting the previous obtained values of Ci, T, I, CNFs and values in Table S2, Kapp can be rewritten as follows:
Fig. 9 depicts a comparison of experimental data and determined Kapp for AB photohydrolysis under various conditions. The obtained plot demonstrated that the experimental data is in good agreement with the model calculated date, confirming the use of the model to predict the reaction rate constant under various operational conditions.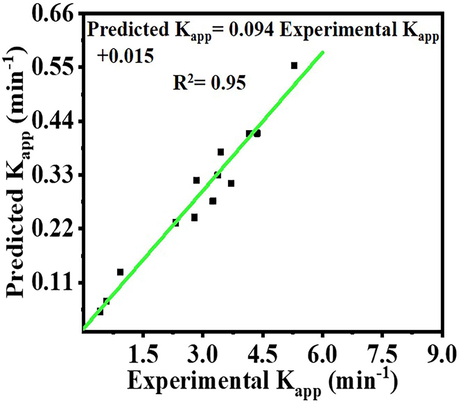
Comparison of experimental kapp and predicted kapp values.
3.3.6 Photocatalytic mechanism
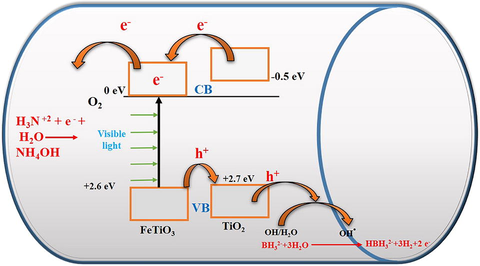
Producing active radicals is the first step in the photocatalytic process. The AB photohydrolysis method for H2 generation over FeTiO3/TiO2@CNFs is shown in Fig. 10. Titanium dioxide, which has a band gap of 3.2 eV, is related to a limitation on the number of active radicals that may exist when illuminated by visible light (Kim et al., 2009). FeTiO3 has a valence band (VB) potential of + 2.6 eV relative to a standard hydrogen electrode (SHE) and a conduction band (CB) potential of −0.2 eV (Moradi et al., 2021). The photogenerated positive hole (h + ) combines with H2O/OH– to form hydroxyl radicals because the VB position of FeTiO3 is so close to that of TiO2 (+2.7 eV), allowing the hole to move from the VB of FeTiO3 to that of TiO2 (Moradi et al., 2021). With visible light irradiation, electrons in the CB of TiO2 can be excited to FeTiO3 CB, as shown in Fig. 10. This suggests that FeTiO3 can be an effective sensitizer when exposed to visible light. Photogenerated electrons in FeTiO3 move freely toward the surface of the CNFs, implying that photogenerated electrons and holes are efficiently separated due to low recombination (Zhang et al., 2012). Rather than recombination with holes on the surface of TiO2, the photogenerated electron in the CB of FeTiO3 can react with an oxidant such as an oxygen molecule (O2) to produce •O2–.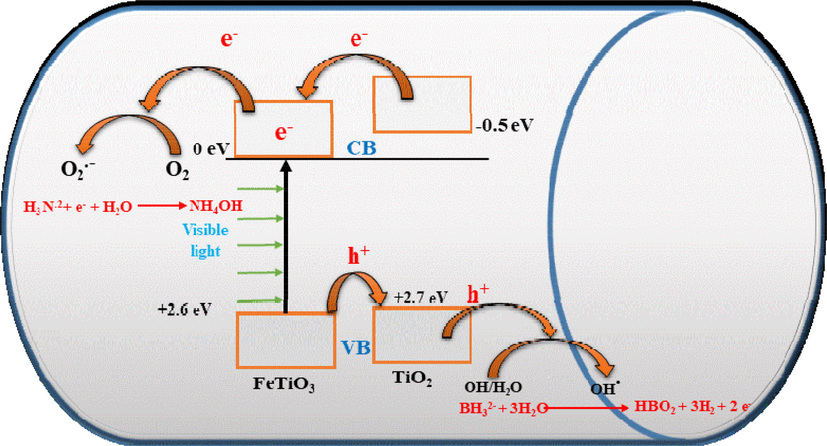
Schematic diagram for the creation and influence of electrons and holes in the hydrolysis of the ammonia borane complex.
4 Conclusion
Successfully preparation of heterojunction FeTiO3/TiO2@CNFs used electrospinning and calcination techniques. Under visible light, FeTiO3/TiO2@CNFs demonstrated fast hydrogen release via photohydrolysis of AB. The measured H2 evolution over TiO2@CNFs and FeTiO3/TiO2@CNFs were 0.38 mol and 0.97 mol in 14 min, respectively. This could be due to the faster electro/hole separation on FeTiO3/TiO2@CNFs, which improves H2 generation from AB photohydrolysis over TiO2@CNFs. It's worth noting that H2 production increased significantly when exposed to visible light versus when exposed to darkness. The mathematical model predicts the reaction rate constant (kapp) by analyzing the effect of various operational conditions. We observed that the experimental data agree well with the model-estimated data.
Acknowledgements
The authors are grateful to be the Researchers supporting Project number (RSP-2022/55), King Saud University, Riyadh, Saudi Arabia for the support.
Declaration of Competing Interest
The authors declare that they have no known competing financial interests or personal relationships that could have appeared to influence the work reported in this paper.
References
- Assessment of nano-FeTiO3/non crystalline silica cold galvanizing composite coating as a duplex corrosion guard system for steel electricity transmission towers in severe aggressive media. Constr. Build. Mater.. 2019;223:705-723.
- [Google Scholar]
- Electrospun carbon nanofibers containing Co-TiC nanoparticles-like superficial protrusions as a catalyst for H2 gas production from ammonia borane complex. Ceram. Int.. 2017;43:15735-15742.
- [Google Scholar]
- Electrospun carbon nanofiber-encapsulated NiS nanoparticles as an efficient catalyst for hydrogen production from hydrolysis of sodium borohydride. Int. J. Hydrogen Energy. 2019;44:21716-21725.
- [Google Scholar]
- Novel Low Temperature Route to Produce CdS/ZnO Composite Nanofibers as Effective Photocatalysts. Catalysts. 2020;10:417.
- [Google Scholar]
- Modeling the photocatalytic reactions of g-C3N4-TiO2 nanocomposites in a recirculating semi-batch reactor. J. Alloy. Compd.. 2020;821:153498
- [Google Scholar]
- Effects of reaction temperature on the photocatalytic activity of TiO2 with Pd and Cu cocatalysts. Catalysts. 2021;11:966.
- [Google Scholar]
- Ammonia borane, a material with exceptional properties for chemical hydrogen storage. Int. J. Hydrogen Energy. 2017;42:9978-10013.
- [Google Scholar]
- Hoffmann, M.R., S.T. Martin, W. Choi, et al., 1995. Environmental applications of semiconductor photocatalysis. 95, 69-96.
- Heterojunction of FeTiO3 nanodisc and TiO2 nanoparticle for a novel visible light photocatalyst. J. Phys. Chem. C. 2009;113:19179-19184.
- [Google Scholar]
- Structure and photoluminescence study of TiO2 nanoneedle texture along vertically aligned carbon nanofiber arrays. J. Phys. Chem. C. 2008;112:17127-17132.
- [Google Scholar]
- Kinetic modeling of photocatalytic degradation of an azo dye using nano-TiO2/polyester. Environ. Eng. Sci.. 2012;29:957-963.
- [Google Scholar]
- Preparation and photocatalytic activity of composite metal oxides derived from Salen-Cu (II) intercalated layered double hydroxides. Korean J. Chem. Eng.. 2017;34:2331-2341.
- [Google Scholar]
- Ultrasound-assisted synthesis of FeTiO3/GO nanocomposite for photocatalytic degradation of phenol under visible light irradiation. Sep. Purif. Technol.. 2021;261:118274
- [Google Scholar]
- Characterization of nano-sized TiO2 suspensions for functional modification of polyester fabric. Surf. Coat. Technol.. 2013;226:68-74.
- [Google Scholar]
- TiO2-based photocatalysts for controllable hydrogen evolution from ammonia borane. Catal. Today. 2021;379:149-158.
- [Google Scholar]
- CeVO4/CeO2 Heterostructure-Supported Co Nanoparticles for Photocatalytic H2 Production from Ammonia Borane under Visible Light. ACS Applied Nano Materials.. 2021;4:4800-4809.
- [Google Scholar]
- Photocatalytic reduction of CO2 on FeTiO3/TiO2 photocatalyst. Catal. Commun.. 2012;19:85-89.
- [Google Scholar]
- Photoelectrochemical cell using dye sensitized zinc oxide nanowires grown on carbon fibers. Appl. Phys. Lett.. 2008;93:133116
- [Google Scholar]
- Fabrication of iron titanium oxide thin film and its application as opto-electronic humidity and liquefied petroleum gas sensors. Opt. Laser Technol.. 2014;57:181-188.
- [Google Scholar]
- Visible-light-enhanced catalytic hydrolysis of ammonia borane using RuP2 quantum dots supported by graphitic carbon nitride. Int. J. Hydrogen Energy. 2021;46:3811-3820.
- [Google Scholar]
- Growth of carbon nanofibers through chemical vapor deposition for enhanced sodium ion storage. Mater. Res. Bull.. 2021;133:111049
- [Google Scholar]
- Efficient hydrogen production by an rGO/TiO2 composite material from ammonia borane hydrolysis in a photocatalytic reactor. Energy Fuel. 2021;35:16065-16074.
- [Google Scholar]
- Yousef, A., N. A. Barakat, K. A. Khalil, et al., 2012. Photocatalytic release of hydrogen from ammonia borane-complex using Ni (0)-doped TiO2/C electrospun nanofibers. 410, 59-65.
- Encapsulation of CdO/ZnO NPs in PU electrospun nanofibers as novel strategy for effective immobilization of the photocatalysts. Colloids Surf. A Physicochem. Eng. Asp. 2012;401:8-16.
- [Google Scholar]
- Photocatalytic release of hydrogen from ammonia borane-complex using Ni (0)-doped TiO2/C electrospun nanofibers. Colloids Surf. A Physicochem. Eng. Asp. 2012;410:59-65.
- [Google Scholar]
- Electrospun Cu-doped titania nanofibers for photocatalytic hydrolysis of ammonia borane. Appl. Catal. A. 2013;467:98-106.
- [Google Scholar]
- Cu0-doped TiO2 nanofibers as potential photocatalyst and antimicrobial agent. J. Ind. Eng. Chem.. 2015;26:251-258.
- [Google Scholar]
- One pot synthesis of Cu-doped TiO2 carbon nanofibers for dehydrogenation of ammonia borane. Ceram. Int.. 2015;41:6137-6140.
- [Google Scholar]
- One-step synthesis of Co-TiC-carbon composite nanofibers at low temperature. Ceram. Int.. 2017;43:5828-5831.
- [Google Scholar]
- Electrospun CoCr7C3-supported C nanofibers: effective, durable, and chemically stable catalyst for H2 gas generation from ammonia borane. Mol. Catal.. 2017;434:32-38.
- [Google Scholar]
- Electrospun Co-TiC nanoparticles embedded on carbon nanofibers: Active and chemically stable counter electrode for methanol fuel cells and dye-sensitized solar cells. Int. J. Hydrogen Energy. 2017;42:10407-10415.
- [Google Scholar]
- Synthesis of Cu–S-Codoped TiO2 nanoparticles supported on carbon nanofibers for simultaneous adsorption and photocatalytic decomposition of reactive black 5. J. Nanosci. Nanotechnol.. 2017;17:3998-4004.
- [Google Scholar]
- Hierarchical heterostructures of Bi2MoO6 on carbon nanofibers: controllable solvothermal fabrication and enhanced visible photocatalytic properties. J. Mater. Chem.. 2012;22:577-584.
- [Google Scholar]
Appendix A
Supplementary material
Supplementary data to this article can be found online at https://doi.org/10.1016/j.jksus.2022.102538.
Appendix A
Supplementary material
The following are the Supplementary data to this article:


