

Translate this page into:
Synchronization of zinc and boron application methods and rates for improving the quality and yield attributes of Mangifera indica L. on sustainable basis
⁎Corresponding authors at: Department of Soil Science, Faculty of Agricultural Sciences and Technology, Bahauddin Zakariya University, Multan 60800 Pakistan (N. Ahmed); Pesticide Quality Control Laboratory, Multan, 60000 Punjab, Pakistan (A.A. Rahi); Hainan Key Laboratory for Sustainable Utilization of Tropical Bioresource, College of Tropical Crops, Hainan University, Haikou 570228, China (S. Fahad). niaz.ahmad@bzu.edu.pk (Niaz Ahmed), shah_fahad80@yahoo.com (Shah Fahad), sd96850@gmail.com (Subhan Danish)
-
Received: ,
Accepted: ,
This article was originally published by Elsevier and was migrated to Scientific Scholar after the change of Publisher.
Peer review under responsibility of King Saud University.
Abstract
Deficiency of micronutrients is a major hurdle for achieving good quality mango fruit and sustainable optimum yield. High soil pH and phosphorus fertilizers are major causes that restrict the bioavailability of micronutrients, such as zinc (Zn) and boron (B). In addition, low or no micronutrient application may create severe Zn and B deficiency in fruits, especially mango. The judicious use of Zn and B is critical to overcoming this problem. Application of both nutrients in the form of soil and foliar application can increase the uptake of Zn and B and the yield of mango fruit on a sustainable basis. However, time is needed to synchronize micronutrients to application methods. Therefore, the current experiment was conducted to explore the best application rate of both micronutrients to the application method in mango orchards. There were 14 treatments applied with three replications. For micronutrient application, soil and foliar methods were chosen. Results showed that 75SB + 0.8FB + 150SZn + 1.0FZn perform significantly best for the improvement in the fruit length (62 %), fruit width (57 %), pulp fresh weight (92 %), stone weight (72 %). Furthermore, a significant increase in total soluble solids (45 %) and a decrease in acidity (50 %) confirmed the imperative functioning of 75SB + 0.8FB + 150SZn + 1.0FZn over control. Furthermore, a significant reduction in total phenolic contents and juice pH validated the effectiveness of 75SB + 0.8FB + 150SZn + 1.0FZn over control in mango. In conclusion, Zn and B soil and foliar application is a better approach for achieving good quality mango fruit. Treatment 75SB + 0.8FB + 150SZn + 1.0FZn is best for mango growers to achieve maximum fruit yield. However, more investigation is suggested in different climatic zones to declare 75SB + 0.8FB + 150SZn + 1.0FZn as the best application amendment to maximize the yield and quality of mango.
Keywords
Acidity
Micronutrients
Phenolics contents
Total soluble solids
Juice pH
Yield

- Zn
-
Zinc
- B
-
Boron
- OM
-
Organic Matter
- EC
-
Electrical Conductivity
- K
-
Potassium
- P
-
Phosphorus
- TSS
-
Total Soluble Solids
Abbreviations
1 Introduction
Micronutrients are essential for the achievement of sustainable yield in different crops. These micronutrients are involved in the assimilation and biosynthesis of photosynthate and the activation of many enzymes. Besides global deficiency of micronutrients in soils, Pakistan's soils are also deficient in zinc (Zn) and boron (B). Less uptake of Zn and B can severely damage the quality and production of fruits (Ahmed et al. 2020). In addition, B and Zn severe deficiency resulted in poor fruit setting, low quality and dropping of fruits at different developmental stages (Siddiq et al. 2017).
Most farmers apply imbalance phosphatic fertilizers that create Zn deficiency symptoms in plants (Brennan 1991; Fageria et al. 2009; Randall and Bouma 1973; Tahir et al. 2018). Furthermore, higher pH is another major cause of B and Zn deficiency. It has been documented that soil's phosphorus contents decrease Zn mobilisation (Bibi et al. 2020; Ova et al. 2015). Besides, soil texture, contents of calcium carbonate, structure, iron and aluminium oxides, nutritional status, organic matter, soil fauna, flora, bicarbonate, sulfur, soil redox potential, poor irrigation and management practices restrict the translocation and accumulation of micronutrients in consumable parts of crops subsequently reducing the yield (Bibi et al. 2019; White and Broadley 2001).
Insufficient availability of Zn induces abnormalities and stresses at the physiological stage of plants, due to which deficiency symptoms appear on the leaves. Small leaves, stunted growth, less fertile spikelet’s, and chlorosis are some of the major symptoms that usually appear due to the deficiency of Zn in the different crops (Cakmak et al., 1996; McCauley et al., 2009; Randall and Bouma, 1973).
On the other hand, less B availability in floral structure resulted in less fruit setting from flowers. It also minimized percent fruit retention on panicles (Bibi et al. 2019). Optimum B uptake increases the thickness of the cell wall through specific complexes. In addition, an increase in flower number and retention, germination, pollen tube elongation, seed and fruit development are other benefits associated with balance B uptake. Boron also controls the translocation of photosynthates and less indole acetic acid oxidation (Bibi et al. 2019; Dutta 2004; Jatav et al. 2020; Moheyuddin et al. 2013; Rashid et al. 1997). To overcome the deficiency of B and Zn, scientists mostly suggest the application of inorganic fertilizer in the soil and on mango trees as foliar. These fertilizers compensate for the deficiency pool of micronutrients in soil created due to intensive agriculture and imbalance in the application of inorganic fertilizers (Rajendran et al. 2009).
Mango (Mangifera indica L.) is a fruit crop of the family Anacardiaceae. Tropical and subtropical areas of the world are most suitable for its cultivation. Delicious flavour, taste and lovely fragrance are a major cause of its position as king in fruits. However, low fruit retention, setting and poor quality of fruits are serious problems in mango. The role of micronutrients is very important in this regard. Their acute deficiencies sometimes cause lower fruit yield and quality of mango (Patil et al. 2018). Therefore, the current study aimed to examine the improvement in mango quality and yield attributes by selecting the best application method and rate of B and Zn fertilizer. It is hypothesized that combining B and Zn, i.e., foliar and soil, can improve mango quality and yield characteristics. The current study will help the farming community manage B and Zn in mango trees to achieve better fruit quality and yield.
2 Materials and methods
2.1 Experimental design and treatments
A field experiment was conducted based on a randomized complete block design for optimal use of micronutrients in improving the productivity of mango fruit. The climatic data of experimental site is provided in Fig. 1. The soil was calcareous in nature with pHs = 8.20, electrical conductivity (ECe) = 2.14 dS m−1, organic matter (OM) = 0.45 %, total nitrogen = 0.0225 %, available phosphorus (P) = 6.32 mg/kg dry soil, extractable potassium (K) = 111 mg/kg dry soil, extractable zinc (Zn) = 0.30 mg/kg dry soil and extractable boron (B) = 0.25 mg/kg dry soil.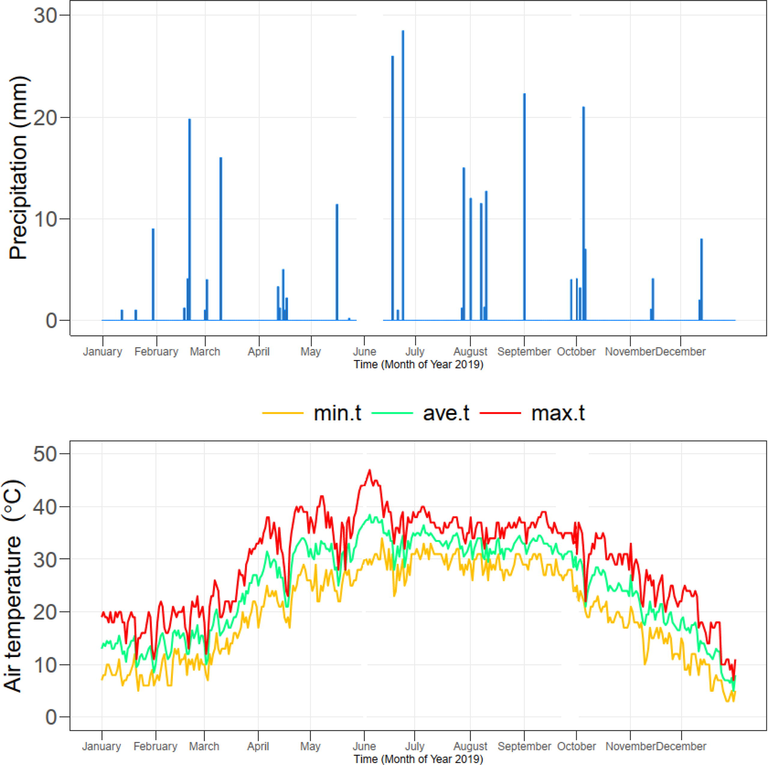
The daily minimum, maximum and average temperature and rainfall in Multan, Pakistan, during 2019 (Majid et al. 2020).
Fourteen treatments with three replications were evaluated in this research. Each treatment was applied on 4 healthy plants that make one block (594 sq. feet). The treatments include: T1 = control, T2 = 75 g Borax plant−1 (75SB), T3 = 0.8 % H3BO3 plant -1 foliar (0.8 FB), T4 = 150 g ZnSO4 plant−1 (150SZn), T5 = 1.0 % ZnSO4 plant−1 foliar (1.0FZn), T6 = 75SB + 150SZn, T7 = 75SB + 1.0FZn, T8 = 0.8FB + 150SZn, T9 = 0.8FB + 1.0FZn, T10 = 75SB + 0.8FB + 150SZn, T11 = 75SB + 0.8FB + 1.0FZn, T12 = 75SB + 150SZn + 1.0FZn, T13 = 0.8FB + 150SZn + 1.0FZn and T14 = 75SB + 0.8FB + 150SZn + 1.0FZn. All the suggested doses of Zn and B are optimal doses which were selected based on previous screening experiments.
2.2 NPK application
Based on the soil test of the study area, micronutrients of N, P and K were used in the ratio of 1.5, 1.0 and 1.0 kg per plant per year, respectively. Total required phosphorus was used at the end of July, and then nitrogen and potassium were added (½ at the end of July and the other ½ before 1st week of February), respectively.
2.3 Boron and zinc application
Soil application of B and Zn was done before flowering. Foliar spraying of B and Zn was done twice a year (total of 24 L/tree applied in 2 splits), once at the time of emergence of inflorescence and the second time when the fruit reached the size of a pea. At the end of the experiment, soil and leaf samples were collected, stored and processed for further analysis (Bibi et al. 2019).
2.4 Irrigation practices
The trench was made with a radius 1 (r1) = 12 feet and a radius 2 (r2) 14 feet apart from the tree's main trunk. The depth of the trench was 2 feet. A total of eight irrigations were applied to each tree with trench during the growing period of mango at the experimental site.
2.5 Plant sampling
To prepare leaf samples, 15 healthy mango plants (age 10 years ± 5 months) were randomly introduced from the garden. About 20 grown leaves (4–6 months old) were randomly collected from each side of the mango canopy from fruiting and non-fruiting branches. Collect of samples was performed during July and August. Then leaves were washed with distilled water and then dried, placed in an oven at a temperature of 70 °C for 48 h. After Taking out the samples from the oven, they were ground with the help of John Wiley mill and then passed through a 40-mesh screen.
2.6 Plant analyses
The leaf samples were digested in a di-acid mixture with a B concentration (Gaines and Mitchell 1979). Zinc and iron were also measured using atomic absorption spectrophotometer (Hettiarachchi et al. 2004). P content of leaves was determined using the spectrophotometer (Benton et al. 1991) and K and Na by flame photometer (Pratt, 1965). Finally, nitrogen analysis was performed using the Kjeldhal’s method (Bremner, 1996).
2.7 Fruit retention
A 1.0 square meter area was identified from the four sides of the tree to evaluate the fruit holding rate. Fruit retention was observed between mustard and marble stages with standard protocol adoption.
2.8 Acidity
The titratable acidity was evaluated as the percentage of citric acid in fresh mango juice. Sample titration was performed at pH 8.2 with sodium hydroxide (0.1 N)(Rangana 1979).
2.9 Total soluble solids (TSS)
“Medline Scientific ltd., digital hand refractometer model SELECT045”, was used for total soluble solids (Brix◦). Twenty grams of the pulp of each fruit was extracted and homogenized in 80 ml of distilled water for 60 s. Finally, 1 ml of homogenate was placed on a refractometer to evaluate TSS (Drake et al. 1988).
2.10 Sugar contents
The total amount of mango pulp sugar was determined calorimetrically using the Antron method (Jayaraman and Jayaraman 1981).
2.11 Total phenolic contents and Vitamin C
The total phenolic content of the liqueurs was determined by the spectrophotometric method with Folin-Ciocalteu (“Colorimetry of total phenolics with phosphomolybdic phosphotungstic acid reagents.,” 1965). Vitamin C content in mango fruit was determined by adopting the methodology of Spencer et al. (1956).
2.12 Statistical analysis
Data analysis was conducted by applying homogeneity of variance and normality of distribution followed by an analysis of variance (ANOVA). The means were compared by using Fisher LSD test at p-value of 0.05. A statistical computer software package (Origin 2020b) was used for the statistical analysis (Steel et al. 1997).
3 Results
Effect of treatments were significant on fruit length, fruit width, pulp fresh weight and stone weight of mango (Table 1). Application of control, 75SB, 0.8FB, 150SZn and 1.0FZn remained statistically alike to each other for fruit length. Treatments 75SB + 150SZn, 75SB + 1.0FZn, 0.8FB + 150SZn, 0.8FB + 1.0FZn differed significantly over control, 75SB, 0.8FB, 150SZn and 1.0FZn for fruit length. It was noted that 75SB + 0.8FB + 150SZn, 75SB + 0.8FB + 1.0FZn, 75SB + 150SZn + 1.0FZn, 0.8FB + 150SZn + 1.0FZn also gave significantly better results for the improvement in fruit length over control, 75SB, 0.8FB, 150SZn and 1.0FZn. Maximum significant increase of 62 % in fruit length was noted in 75SB + 0.8FB + 150SZn + 1.0FZn from control. For fruit width 75SB, 0.8FB, 150SZn and 1.0FZn did not differ significantly over control. A significant enhancement in fruit width was observed in 75SB + 150SZn, 75SB + 1.0FZn, 0.8FB + 150SZn, 0.8FB + 1.0FZn over control. Application of 75SB + 150SZn and 75SB + 1.0FZn gave significantly better fruit width over 0.8FB + 150SZn, 0.8FB + 1.0FZn. Highest fruit width was observed in 75SB + 0.8FB + 150SZn + 1.0FZn (57 %) followed by 75SB + 0.8FB + 150SZn (31 %), 75SB + 0.8FB + 1.0FZn (29 %), 75SB + 150SZn + 1.0FZn (45 %), 0.8FB + 150SZn + 1.0FZn (49 %) than control. No significant change was noted in pulp fresh and stone weight where control, 75SB, 0.8FB, 150SZn and 1.0FZn were applied. An increasing trend of was noted in pulp fresh and stone weight where treatments 75SB + 150SZn, 75SB + 1.0FZn, 0.8FB + 150SZn, 0.8FB + 1.0FZn were applied. Maximum pulp fresh and stone weight was noted in 75SB + 0.8FB + 150SZn + 1.0FZn followed by 75SB + 0.8FB + 150SZn, 75SB + 0.8FB + 1.0FZn, 75SB + 150SZn + 1.0FZn, 0.8FB + 150SZn + 1.0FZn.
Treatments
Fruit Length
(cm)Fruit Width
(cm)Pulp Fresh Weight (g)
Stone DryWeight
(g)
Control
9.36 ± 0.06 g
4.87 ± 0.009i
195 ± 1.8i
142 ± 0.5i
75SB
9.48 ± 0.01 g
4.92 ± 0.006hi
199 ± 0.6i
145 ± 0.2hi
0.8FB
9.53 ± 0.01 g
4.95 ± 0.003hi
201 ± 0.7i
145 ± 0.3hi
150SZn
9.54 ± 0.01 g
4.98 ± 0.009hi
204 ± 0.7i
146 ± 0.2hi
1.0FZn
9.56 ± 0.02 g
5.02 ± 0.065 h
204 ± 0.9i
149 ± 0.8 h
75SB + 150SZn
10.96 ± 0.04f
5.29 ± 0.018 g
216 ± 2.3 h
162 ± 1.9 g
75SB + 1.0FZn
11.25 ± 0.15e
5.94 ± 0.033f
240 ± 2.9 g
174 ± 1.2f
0.8FB + 150SZn
11.31 ± 0.12e
6.00 ± 0.023ef
257 ± 4.3f
184 ± 2.3e
0.8FB + 1.0FZn
12.51 ± 0.08d
6.11 ± 0.018e
278 ± 1.4e
203 ± 1.9d
75SB + 0.8FB + 150SZn
13.32 ± 0.17c
6.39 ± 0.026d
288 ± 1.8d
204 ± 2.2d
75SB + 0.8FB + 1.0FZn
13.57 ± 0.06c
6.30 ± 0.131d
280 ± 2.6de
205 ± 3.4d
75SB + 150SZn + 1.0FZn
14.15 ± 0.10b
7.09 ± 0.087c
316 ± 2.0c
225 ± 2.2c
0.8FB + 150SZn + 1.0FZn
14.27 ± 0.12b
7.26 ± 0.045b
335 ± 5.2b
233 ± 1.3b
75SB + 0.8FB + 150SZn + 1.0FZn
15.20 ± 0.10a
7.66 ± 0.061a
374 ± 8.0a
244 ± 0.9a
According to the results, experimental treatments significantly affected the number of flowers per panicle, number of fruits matured per panicle, average fruit weight, and yield (Table 2). Among the treatments, the highest and lowest number of flowers per panicle equal to 800 and 595 were observed from 75SB + 0.8FB + 150SZn + 1.0FZn and control, respectively, which were significantly different from each other. Treatment 75SB + 0.8FB + 150SZn + 1.0FZn increased the number of flowers per panicle by 25.70 % compared to the control. In examining the number of fruits matured per panicle, treatments of control, 75SB, 0.8FB, 150SZn and 1.0FZn were not significantly different from each other. Subsequently, a significant increase in the number of fruits matured per panicle was observed where treatments of 75SB + 150SZn, 75SB + 1.0FZn, 0.8FB + 150SZn were applied. The highest number of fruits matured per panicle was observed with application 75SB + 0.8FB + 150SZn + 1.0FZn followed by 0.8FB + 150SZn + 1.0FZn, 75SB + 150SZn + 1.0FZn and 0.8FB + 1.0FZn. The average fruit weight was not affected by any of the treatments of control, 75SB, 0.8FB, 150SZn and 1.0FZn. While 75SB + 150SZn, 75SB + 1.0FZn, 0.8FB + 150SZn and 0.8FB + 1.0FZn caused a slight improvement in the average fruit weight. Application of 75SB + 0.8FB + 150SZn + 1.0FZn had the highest average fruit weight. Mango yield is affected by its components, and there is a direct relationship between yield and number of flowers per panicle, number of matured fruits per panicle and average fruit weight. Application of control, 75SB, 0.8FB, 150SZn and 1.0FZn did not significantly affect mango yield. The highest mango yield was obtained with the application of 75SB + 0.8FB + 150SZn + 1.0FZn and increased the mango yield by 50.75 % compared to the control.
Treatments
No. of Flowers
(Panicle-1)No. of Fruits Matured
(Panicle-1)Average Fruit Weight (g)
Yield
(kg Tree-1)
Control
592 ± 1.4j
1.22 ± 0.01j
438 ± 0.58j
134 ± 0.70 k
75SB
602 ± 1.5i
1.25 ± 0.01ij
441 ± 0.88ij
136 ± 0.76i-k
0.8FB
602 ± 4.7i
1.30 ± 0.01ij
440 ± 0.33j
139 ± 0.43ij
150SZn
606 ± 2.6i
1.33 ± 0.01i
437 ± 1.20j
139 ± 0.46i
1.0FZn
608 ± 2.4hi
1.35 ± 0.02i
445 ± 2.03i
135 ± 0.97jk
75SB + 150SZn
616 ± 2.2 h
1.93 ± 0.04 h
453 ± 1.45 h
161 ± 1.49 h
75SB + 1.0FZn
640 ± 3.2 g
2.10 ± 0.03 g
463 ± 1.73 g
171 ± 0.79 g
0.8FB + 150SZn
650 ± 1.5f
2.28 ± 0.02f
474 ± 2.19f
172 ± 2.25 g
0.8FB + 1.0FZn
688 ± 4.4e
3.11 ± 0.08d
488 ± 1.53e
179 ± 0.69f
75SB + 0.8FB + 150SZn
707 ± 3.8d
2.75 ± 0.03e
526 ± 1.76d
196 ± 2.23d
75SB + 0.8FB + 1.0FZn
712 ± 4.3d
2.76 ± 0.03e
525 ± 3.18d
188 ± 1.50e
75SB + 150SZn + 1.0FZn
761 ± 4.0c
3.25 ± 0.05c
541 ± 2.08c
202 ± 2.35c
0.8FB + 150SZn + 1.0FZn
793 ± 2.6b
3.44 ± 0.05b
559 ± 3.48b
225 ± 1.67b
75SB + 0.8FB + 150SZn + 1.0FZn
815 ± 2.2a
3.70 ± 0.03a
567 ± 1.53a
232 ± 1.60a
Traits shelf life, total sugars, reducing sugars, and non-reducing sugars were affected by experimental treatments (Table 3). In the study, shelf life, treatments of control, 75SB, 0.8FB, 150SZn and 1.0FZn had no significant effect on this trait. Application of 75SB + 150SZn, 75SB + 1.0FZn and 0.8FB + 150SZn significantly increased shelf life, and these three treatments were not statistically different. Maximum shelf life was obtained in 75SB + 0.8FB + 150SZn + 1.0FZn, which was no different from 0.8FB + 150SZn + 1.0FZn and is followed by 75SB + 150SZn + 1.0FZn, 75SB + 0.8FB + 150SZn, 75SB + 0.8FB + 1.0FZn and 0.8FB + 1.0FZn. All treatments except control caused a significant increase in total sugars. Treatments 75SB + 0.8FB + 150SZn + 1.0FZn, 0.8FB + 150SZn + 1.0FZn and 75SB + 150SZn + 1.0FZn had the highest total sugars, respectively, and there was no statistical difference with each other. Among the studied factors, treatments of control, 75SB, 0.8FB and 1.0FZn did not significantly reduce sugars. Treatment of 75SB + 0.8FB + 150SZn + 1.0FZn had the highest reducing sugars (22 %) and was significantly different from other treatments. In the study of non-reducing sugars, it was observed that the most non-reducing sugars were obtained from 75SB + 0.8FB + 150SZn + 1.0FZn, and there was no significant difference with 0.8FB + 150SZn + 1.0FZn and 75SB + 150SZn + 1.0FZn; the lowest non-reducing sugars were obtained from the control treatment.
Treatments
Shelf Life
(Days)Total Sugar
(%)Reducing Sugar (%)
Non-Reducing Sugar (%)
Control
7 ± 0.02f
16.63 ± 0.63f
13.68 ± 0.34 h
7.04 ± 0.04e
75SB
7 ± 0.01f
18.37 ± 0.32e
14.29 ± 0.29gh
7.48 ± 0.29de
0.8FB
7 ± 0.01f
18.74 ± 0.26e
14.64 ± 0.32f-h
7.82 ± 0.18 cd
150SZn
7 ± 0.03f
18.74 ± 0.63e
14.71 ± 0.36 fg
7.83 ± 0.19 cd
1.0FZn
8 ± 0.02f
18.73 ± 0.27e
14.65 ± 0.33f-h
7.83 ± 0.17 cd
75SB + 150SZn
10 ± 0.25e
19.88 ± 0.48d
15.38 ± 0.25ef
8.14 ± 0.18 cd
75SB + 1.0FZn
10 ± 0.30e
21.21 ± 0.21c
15.82 ± 0.43de
8.41 ± 0.30c
0.8FB + 150SZn
10 ± 0.04e
21.31 ± 0.16c
16.63 ± 0.32d
8.38 ± 0.20c
0.8FB + 1.0FZn
12 ± 0.28d
21.33 ± 0.33c
17.67 ± 0.34c
8.55 ± 0.29c
75SB + 0.8FB + 150SZn
13 ± 0.15 cd
22.41 ± 0.30b
18.05 ± 0.58c
9.33 ± 0.16b
75SB + 0.8FB + 1.0FZn
12 ± 0.97d
22.67 ± 0.33b
19.48 ± 0.29b
9.96 ± 0.55b
75SB + 150SZn + 1.0FZn
13 ± 0.43bc
23.99 ± 0.01a
19.96 ± 0.04b
11.63 ± 0.32a
0.8FB + 150SZn + 1.0FZn
14 ± 0.55ab
24.27 ± 0.27a
20.17 ± 0.44b
11.85 ± 0.15a
75SB + 0.8FB + 150SZn + 1.0FZn
15 ± 0.32a
24.73 ± 0.37a
21.42 ± 0.30a
12.34 ± 0.33a
The effect of treatments was significant on plant physiological traits such as photosynthetic rate, stomatal conductance, and transpiration rate (Table 4). The plant's photosynthetic rate was affected by experimental factors, and the highest photosynthetic rate was observed from 75SB + 0.8FB + 150SZn + 1.0FZn. The lowest photosynthetic rates were observed from control and 75SB, respectively, and there was no significant difference with each other. No significant change was observed in stomatal conductance where control, 75SB, 0.8FB, 150SZn, and 1.0FZn were applied. An increasing trend in stomatal conductance was observed where 75SB + 150SZn, 75SB + 1.0FZn, and 0.8FB + 150SZn were applied. The highest stomatal conductance was observed in 75SB + 0.8FB + 150SZn + 1.0FZn, which was in a statistical group with 0.8FB + 150SZn + 1.0FZn. The results showed that mango transpiration rate was affected by the treatments. The control treatment had the lowest transpiration rate and had no statistical difference with 75SB. A significant increase in transpiration rate was observed from 1.0FZn that with 75SB + 150SZn, 75SB + 1.0FZn and 0.8FB + 150SZn, which were placed in a statistical group. The highest transpiration rate was also observed with application 75SB + 0.8FB + 150SZn + 1.0FZn.
Treatments
Photosynthetic Rate
(μmol/m/s)Transpiration Rate
(mmol/m/s)Stomatal Conductance
(mol/m/s)
Control
13.96 ± 0.08i
4.28 ± 0.04i
0.18 ± 0.003 g
75SB
14.30 ± 0.30i
4.34 ± 0.02hi
0.20 ± 0.003 fg
0.8FB
14.94 ± 0.13 h
4.48 ± 0.02gh
0.21 ± 0.003f
150SZn
15.11 ± 0.07gh
4.57 ± 0.04 g
0.22 ± 0.003f
1.0FZn
15.40 ± 0.16 g
5.27 ± 0.16f
0.21 ± 0.003f
75SB + 150SZn
16.23 ± 0.13f
5.08 ± 0.09f
0.25 ± 0.006e
75SB + 1.0FZn
16.79 ± 0.05de
5.16 ± 0.05f
0.26 ± 0.009e
0.8FB + 150SZn
16.91 ± 0.04de
5.22 ± 0.04f
0.27 ± 0.022e
0.8FB + 1.0FZn
16.63 ± 0.05e
5.48 ± 0.05e
0.31 ± 0.009d
75SB + 0.8FB + 150SZn
17.13 ± 0.07d
5.86 ± 0.09d
0.34 ± 0.012 cd
75SB + 0.8FB + 1.0FZn
17.95 ± 0.05c
6.04 ± 0.03 cd
0.36 ± 0.010c
75SB + 150SZn + 1.0FZn
18.04 ± 0.11c
6.20 ± 0.03c
0.39 ± 0.006b
0.8FB + 150SZn + 1.0FZn
18.76 ± 0.13b
6.53 ± 0.06b
0.41 ± 0.009ab
75SB + 0.8FB + 150SZn + 1.0FZn
19.27 ± 0.16a
6.77 ± 0.07a
0.43 ± 0.009a
The effect of treatments on acidity, juice pH, total soluble solids and total phenols were significant (Table 5). Among the treatments studied, control, 75SB, 0.8FB, 150SZn, and 1.0FZn increased mango acidity were not significantly different from each other. A significant reduction in acidity was observed through application of 75SB + 150SZn followed by 75SB + 1.0FZn, 0.8FB + 150SZn, 0.8FB + 1.0FZn, 75SB + 0.8FB + 150SZn, 75SB + 0.8FB + 1.0FZn, 75SB + 150SZn + 1.0FZn, 0.8FB + 150SZn + 1.0FZn, and 75SB + 0.8FB + 150SZn + 1.0FZn. Most of the juice pH was obtained by application 75SB, which was not significantly different from 0.8FB, and 150SZn. The lowest juice pH was obtained from 75SB + 0.8FB + 150SZn + 1.0FZn, and which was in a statistical group with 0.8FB + 150SZn + 1.0FZn whilst other treatments were not significantly different from each other. Application of 75SB + 0.8FB + 150SZn + 1.0FZn, and 0.8FB + 150SZn + 1.0FZn remained statistically alike to each other for total soluble solids. The control treatment also had the lowest total soluble solids. The highest total phenols content was obtained by control, 75SB, 0.8FB, 150SZn, and 1.0FZn. A significant decreasing trend was observed with the application of 75SB + 150SZn, which was statistically similar to 75SB + 1.0FZn. The lowest total phenols were observed from 75SB + 0.8FB + 150SZn + 1.0FZn, which was in a statistical group with 0.8FB + 150SZn + 1.0FZn, 75SB + 150SZn + 1.0FZn, and 75SB + 0.8FB + 1.0FZn.
Treatments
Acidity
(%)Juice
pHTSS
(°Brix)TP
(mg/100 g fw)
Control
0.28 ± 0.006a
4.50 ± 0.3b-e
20.43 ± 0.4 h
180 ± 5.9bc
75SB
0.28 ± 0.003a
5.05 ± 0.1a
21.96 ± 0.5 g
185 ± 2.6ab
0.8FB
0.29 ± 0.009a
4.70 ± 0.1a-c
22.66 ± 0.3 fg
187 ± 3.0ab
150SZn
0.28 ± 0.003a
4.83 ± 0.1ab
23.52 ± 0.3ef
191 ± 2.9ab
1.0FZn
0.29 ± 0.006a
4.58 ± 0.2b-d
23.71 ± 0.3e
192 ± 4.5a
75SB + 150SZn
0.24 ± 0.006b
4.29 ± 0.2c-e
25.10 ± 0.5d
169 ± 6.1 cd
75SB + 1.0FZn
0.21 ± 0.006c
4.50 ± 0.1b-e
24.96 ± 0.0d
158 ± 5.9de
0.8FB + 150SZn
0.20 ± 0.006 cd
4.48 ± 0.1b-e
25.63 ± 0.4d
156 ± 6.3ef
0.8FB + 1.0FZn
0.18 ± 0.006de
4.39 ± 0.1c-e
25.32 ± 0.3d
150 ± 3.1e-g
75SB + 0.8FB + 150SZn
0.16 ± 0.009ef
4.19 ± 0.1de
26.72 ± 0.3c
145 ± 2.7f-h
75SB + 0.8FB + 1.0FZn
0.16 ± 0.012ef
4.32 ± 0.2c-e
27.84 ± 0.2b
140 ± 2.7 g-i
75SB + 150SZn + 1.0FZn
0.16 ± 0.009ef
4.22 ± 0.1de
28.75 ± 0.3b
136 ± 3.7 h-i
0.8FB + 150SZn + 1.0FZn
0.15 ± 0.007 fg
4.12 ± 0.1ef
28.79 ± 0.2ab
139 ± 1.9 g-i
75SB + 0.8FB + 150SZn + 1.0FZn
0.14 ± 0.009 g
3.76 ± 0.2f
29.72 ± 0.3a
130 ± 3.0i
4 Discussion
Balance uptake of micronutrients in fruiting trees increases crop growth and yield and enhances fruits' quality (Ahmed et al. 2020; Marschner 2011; Rafiullah et al. 2020; Rahi et al. 2021). In the current experiment, it is clear from the control treatment plants that micronutrients are important in the growth and yield aspects. The control shows minimum fruit length, fruit width, pulp fresh weight, and stone weight among all the treatments. A significant increase in the fruit length, pulp fresh weight and stone weight was observed where combined B and Zn were applied using swine and their applications. Many scientists documented that proper update of B played an imperative role in forming a pollen tube, developing anther and pollen germination. Improvement in the number of flowers through B significantly enhances the yield of fruiting trees (Bibi et al. 2019; Mozafar 1989). Previous investigations also concluded that Zn is very important for tryptophan biosynthesis. This tryptophan acts as a precursor for the manufacturing of indole acetic acid (Ali et al. 2012). In the current study, significant improvement in the fruit length, fruit width, pulp fresh weight and stone weight might be due to improvement in the biosynthesis of indole acetic acid regulated by the balance uptake of Zn. The higher activity of dehydrogenase and proteinase enzyme also becomes slow due to the balance uptake of Zn. These enzymes induced early maturity in the fruits, resulting in less retention and poor quality (Chandra and Singh 2015). Boron improves polyphenol oxidase activity which decreases browning incidence in fruits. This reduction in browning incidence is a major indicator of improvement in post-harvest fruit quality (Khalaj et al. 2017). Application of B becomes the part of the plant through phloem filter plates during basipetal sucrose flow. It provides strength to the nuclear membrane and regulates ribonucleic acid metabolism, which played a key role in the sugar contents assimilation (Marschner 2011). Similar findings were also noted in the current study where soil and foliar application of B significantly increased reducing and non-reducing and total sugar contents of the mango fruits. A significant improvement in the gas exchange attributes, i.e., photosynthetic rate, transpiration rate and stomatal conductance was also noted where Zn was applied through foliar and soil applications. The improvement pass might be due to balance uptake of Zn.
Many enzymes activation in photosynthesis required, zinc as a cofactor. These enzymes accelerate photosynthesis' metabolic functioning, which results in the improvement of gas exchange attributes (Kazemi 2013). It has been observed that B has a key role in phenolic metabolism. It activates the enzyme phenylalanine ammoniumlyase (PAL) under deficiency conditions which significantly increases phenolic. Higher accumulation of phenolic is catalytically oxidized by the activity of polyphenoloxidase (PPO) enzyme. Such oxidation results in the production of quinones that decrease the integrity of the cell membrane (Camacho-Cristóbal et al. 2002). The current study findings also signify that phenolic contents were decreased by increasing soil and foliar application of B.
The reduction in phenolic might be due to better uptake of B and alleviation of B deficiency in mango plants. In-plant cell wall, deficiency of B also decreases glycoproteins. Most surface proteins bind with the membrane through glycosylphosphatidylinositol anchors such as arabinogalactan proteins (AGP). These glycosylphosphatidylinositol anchors, such as arabinogalactan proteins (AGP) provide bindings sites for putative B-binding structures (Goldbach and Wimmer 2007; Redondo-Nieto et al. 2007). Similar results were also noted in the current study, where B and Zn balance application significantly decreased the phenolic content in the mango fruits compared to the control treatment. Furthermore, a significant decrease in the fruit's acidity and an increase in the total soluble solids indicate time parity functioning of combined use of B and Zn via foliar and soil application.
5 Conclusions
It is concluded that both B and Zn are necessary for maximizing mango yield. Quality attributes in mango can be improved through the combined use of B and Zn. Farmers are recommended to apply combined B and Zn through the soil and foliar methods to improve mango's growth, quality, and yield attributes. More investigations of different climatic conditions are needed to declare 75SB + 0.8FB + 150SZn + 1.0FZn as the best treatment for mango.
Acknowledgment
The authors extend their appreciation to the Researchers supporting Project number (RSP-2021/15), King Saud University, Riyadh, Saudi Arabia.
Declaration of Competing Interest
The authors declare that they have no known competing financial interests or personal relationships that could have appeared to influence the work reported in this paper.
References
- Micronutrients status of mango (Mangifera indica) orchards in Multan region, Punjab, Pakistan, and relationship with soil properties. Open Agric.. 2020;5:271-279.
- [Google Scholar]
- Diversification of rice-based cropping systems to improve soil fertility, sustainable productivity and economics. J. Anim. Plant. Sci.. 2012;22:108-112.
- [Google Scholar]
- Benton JJ, B. Wolf, H.A. Mills (1991) Plant Analysis Handbook: A Practical Sampling, Preparation, Analysis, and Interpretation Guide - AbeBooks - Jones, J. Benton, Jr.; Wolf, Benjamin; Mills, Harry A.: 1878148001, 1st edn. Micro-Macro Publishing Inc., , USA.
- Bibi F, Ahmad I, Bakhsh A, Kiran S, Danish S, Ullah H (2019) Effect of Foliar Application of Boron with Calcium and Potassium on Quality and Yield of Mango cv. Summer Bahisht (SB) Chaunsa. Open Agric 4:98–106.
- Bibi F, Saleem I, Ehsan S, Jamil S, Ullah H, Mubashir M, Kiran S, Ahmad I, Irshad I, Saleem M, Rahi AA, Khurshid MR, Danish S (2020) Effect of various application rates of phosphorus combined with different zinc rates and time of zinc application on phytic acid concentration and zinc bioavailability in wheat. Agric Nat Resour 54:265–272. https://doi.org/10.34044/j.anres.2020.54.3.05.
- Bremner M (1996) Nitrogen-Total. In: Sumner DL, A.L. S, P.A. P, R.H. H, N. LP, A. SM, T. TC, E. JM (eds) Methods of Soil Analysis Part 3. Chemical Methods-SSSA Book Series 5. John Wiley & Sons, Inc., Madison, WI, USA, pp 1085–1121.
- Brennan RF (1991) Effectiveness of zinc sulfate and zinc chelate as foliar sprays in alleviating zinc deficiency of wheat grown on zinc-deficient soils in Western Australia. Anim Prod Sci 31:831–834. https://doi.org/10.1071/EA9910831
- Zinc deficiency as a critical problem in wheat production in Central Anatolia. Plant Soil. 1996;180(2):165-172.
- [Google Scholar]
- Changes in phenolic metabolism of tobacco plants during short-term boron deficiency. Plant Physiol. Biochem.. 2002;40:997-1002.
- [CrossRef] [Google Scholar]
- Foliar application of zinc sulphate, magnesium sulphate and copper sulphate on the yield and quality of aonla (Emblica officinallis Gaerth L.) cv. “ NA-7 ” under Garhwal Himalaya. J. Med. Plants Stud.. 2015;3:42-45.
- [Google Scholar]
- Maturity, storage quality, carbohydrate, and mineral content of Goldspur apples as influenced by rootstock. J. Am. Soc. Hortic. Sci.. 1988;113:949-952.
- [Google Scholar]
- Effect of foliar boron application on panicle growth, fruit retention and physico-chemical characters of mango cv. Himsagar. Indian J. Hortic.. 2004;61:265-266.
- [Google Scholar]
- Boron determination in plant tissue by the azomethine H method. Commun. Soil Sci. Plant Anal.. 1979;10:1099-1108.
- [CrossRef] [Google Scholar]
- Boron in plants and animals: Is there a role beyond cell-wall structure? J. Plant Nutr. Soil Sci.. 2007;170:39-48.
- [Google Scholar]
- Na2EDTA Enhances the Absorption of Iron and Zinc from Fortified Rice Flour in Sri Lankan Children. J. Nutr.. 2004;134:3031-3036.
- [CrossRef] [Google Scholar]
- An Overview of Micronutrients: Prospects and Implication in Crop Production. In: Aftab T., Hakeem K.R., eds. Plant Micronutrients : Deficiency and Toxicity Management. Cham, Switzerland: Springer Nature; 2020. p. :4-5.
- [Google Scholar]
- Laboratory manual in biochemistry (1st edn.). India: Wiley Eastern Delhi; 1981.
- Effects of Zn, Fe and their Combination Treatments on the growth. Bull. Environ. Pharmacol. Life Sci.. 2013;3:109-114.
- [Google Scholar]
- Improvement of postharvest quality of asian pear fruits by foliar application of boron and calcium. Horticulturae. 2017;3:15.
- [CrossRef] [Google Scholar]
- Mitigation of Osmotic Stress in Cotton for the Improvement in Growth and Yield through Inoculation of Rhizobacteria and Phosphate Solubilizing Bacteria Coated Diammonium Phosphate. Sustainability.. 2020;12:10456.
- [Google Scholar]
- Marschner’s Mineral Nutrition of Higher Plants (3rd edn.). Cambridge, MA, USA: Academic Press; 2011.
- Plant Nutrient Functions and Deficiency and Toxicity Symptoms. Nutrient Management Module. 2009;9:1-16.
- [Google Scholar]
- Effect of Zinc and Boron Fertilizers Application on Some Physicochemical Attributes of Five Rice Varieties Grown in Agro-Ecosystem of Sindh, Pakistan. Am. J. Agric. Environ. Sci.. 2013;13:433-439.
- [CrossRef] [Google Scholar]
- High phosphorus supply reduced zinc concentration of wheat in native soil but not in autoclaved soil or nutrient solution. Plant Soil. 2015;393:147-162.
- [CrossRef] [Google Scholar]
- Role of zinc, copper and boron in fruit crops: A review. Int. J. Chem. Stud.. 2018;6:1040-1045.
- [Google Scholar]
- Pratt PF (1965) Potassium. In: Norman AG (ed) Methods of Soil Analysis: Part 2 Chemical and Microbiological Properties, 9.2. John Wiley & Sons, Ltd, pp 1022–1030.
- Effect of micronutrients foliar supplementation on the production and eminence of plum (Prunus domestica L.) Qual. Assur. Saf. Crop Foods. 2020;12(SP1):32-40.
- [Google Scholar]
- Yield Enhancement and Better Micronutrients Uptake in Tomato Fruit through Potassium Humate Combined with Micronutrients Mixture. Agriculture. 2021;11:357.
- [CrossRef] [Google Scholar]
- Nutritional and physiological disorders in crop plants. Jodhpur, India: Scientific Publishers; 2009.
- Zinc deficiency, carbonic anhydrase, and photosynthesis in leaves of spinach. Plant Physiol.. 1973;52:229-232.
- [CrossRef] [Google Scholar]
- Titratable Acidity in Manual of Fruit and Vegetable Products. New Delhi: Tala McGraw. Hill Pub. Cp. Ltd.; 1979.
- Micronutrient deficiencies in rainfed calcareous soils of pakistan. III. Boron nutrition of sorghum. Commun. Soil Sci. Plant Anal.. 1997;28:441-454.
- [CrossRef] [Google Scholar]
- Developmentally regulated membrane glycoproteins sharing antigenicity with rhamnogalacturonan II are not detected in nodulated boron deficient Pisum sativum. Plant, Cell Environ.. 2007;30:1436-1443.
- [CrossRef] [Google Scholar]
- Handbook of mango fruit: Production, postharvest science, processing technology and nutrition. Oxford, UK: Wiley and Sons; 2017.
- Vitamin C Concentration in Developing and Mature Fruits of Mango (Mangifera indica L.) Plant Physiol. 1956;31:79-80.
- [CrossRef] [Google Scholar]
- Principles and Procedures of Statistics: A Biometrical Approach (3rd edn.). Singapore: McGraw Hill Book International Co.; 1997.
- Effect of various application rate of zinc fertilizer with and without fruit waste biochar on the growth and Zn uptake in maize. Int. J. Biosci.. 2018;13:159-166.
- [CrossRef] [Google Scholar]
- Chloride in Soils and its Uptake and Movement within the Plant: A Review. Ann. Bot.. 2001;88:967-988.
- [CrossRef] [Google Scholar]


