

Translate this page into:
A multinomial approach to sustainable and improved agricultural technologies vis-a-vis socio-personal determinants in apple (Malus domestica) cultivation
⁎Corresponding authors. s.zahoor37@gmail.com (Zahoor Ahmad Shah), arifsayar21@gmail.com (Arif Hussain Bhat)
-
Received: ,
Accepted: ,
This article was originally published by Elsevier and was migrated to Scientific Scholar after the change of Publisher.
Peer review under responsibility of King Saud University.
Abstract
Background
Extreme poverty is widespread among farm families in the rural areas of developing countries including India. Farmers toil hard in their fields to meet the growing demands of their families. Different techniques and technologies have been generated at different research institutes, experimental stations, and farm science centers. However the same technology is not properly disseminated to the farmers and the farmers usually follow traditional practices at their farms leading to low production, productivity, and yield of major crops grown worldwide, hence threatening the livelihoods and food security of the world population in a general and farming community in particular.
Methods
The present study described the socio-personal characteristics, identified the stages and categories of technology adoption with help of multinomial logistic regression. A multistage sampling procedure was adopted to collect the data from the concerned apple growers. The study used mixed methods, combining focus group discussions, key informant interviews, and a household survey.
Results
The study found that only nine out of fifteen technologies disseminated in the area have been fully adopted with a greater proportion (42.5 %) of the apple growers classified as early adopters of the recommended sustainable and intensified improved practices. The adoption of scientific technology is always the central focus of policymakers and planners in the developing world. Important to note is that the growers are in their active (42 years) farming age and have acquired 22 years’ experience which is long enough to understand that traditional practices are not as productive compared to the recently improved/recommended practices. The study also revealed that the determinants of technology adoption are age, experience, level of education, annual income, extension contact, and scientific orientation.
Conclusion
The study, recommends that policymakers should capitalize on the determinants to design better programs relating to the adoption of sustainable improved technologies that will help in alleviation of poverty and ensure food security.
Keywords
Apple
Improved
Multinomial
Sustainable
Technology
Socio-personal

1 Introduction
Nearly 11 % of the 7.42 billion world population is extremely poor and is concentrated mostly in the rural areas of Southern Asia and sub-Saharan African countries, of which a major portion (78 %) rely on agriculture and allied sectors for their livelihoods (World Bank, 2018; United Nations, 2018). As the majority of the rural poor depend on agricultural and allied sectors for their livelihoods, agricultural growth can have a paramount impact on the alleviation of rural poverty. In fact, as per World Bank, 2008, agricultural GDP (Gross Domestic Product) growth is at least twice as effective in reducing poverty as GDP growth in other sectors. That means if a 1 % increase in GDP in any non-farm sector can lead to a reduction of poverty by 1 %, the poverty reduction will be 2 % with 1 % growth in the agricultural GDP. Because of its profound impacts on poverty alleviation, ensuring agricultural growth is the center of the development policies, particularly in poverty-stricken agrarian developing countries like India (Mottaleb, 2018).
However, sustainable growth of the agricultural sector critically depends on the adoption of improved, scale-appropriate, and eco-friendly technologies, including new disease-resistant and climate-adjusted seeds, modern management practices, and conservation of resources using scale-appropriate new agricultural machinery. The adoption of new technology in agriculture is, therefore, at the core of agricultural growth and, thus, rural poverty alleviation. Unfortunately, the adoption of new agricultural technology, including agricultural machinery, is seldom rapid (Pierpaoli et al., 2013), as a large number of factors can affect the adoption process (Rogers, 1983; Lambur et al., 1985; Dunlap, and Martin, 1983; Nowak, 1992; Dimara and Skuras, 2003; Waller et al., 1998; Feder et al., 1986). This is because new agricultural technologies are often correlated with risks and uncertainties about a proper application, scale appropriateness, suitability with the prevailing environment, and importantly with farmers’ perceptions and expectations (World Bank, 2008).
An increase in agricultural production and productivity through the adoption and diffusion of improved technologies and practices has been considered one of the viable means for achieving economic growth, and agricultural transformation in the face of natural resource scarcity and climate uncertainty in developing countries including India (Evenson and Gollin, 2003a; Gollin, 2010). A large number of improved agricultural technologies have been generated, developed, and promoted in recent decades to address the diverse set of goals that directly benefit farmers (growers) (World Bank, 2007); these include genetic improvements (Evenson and Gollin, 2003b), irrigation management techniques (Pereira et al., 2002), improved/integrated pest management strategies (Pingali and Rosengrant, 1994; Susmita et al., 2007), and climate-resilient (climate-smart) technologies (Khatri-Chhetri et al., 2019). There has been significant interest in the factors affecting the adoption of these technologies and practices, the diffusion of information, and the impact of interventions that promote them (Kumar et al., 2020).
It is believed that simultaneous achievement of sustainability, profitability, and productivity in the agricultural sector requires the development and utilization of appropriate technologies derived from agricultural research and the extension of technological innovations (Sarcheshmeh et al., 2018). Agriculture remains to be a great player in the generation of revenue and a source of food for many people all over the world. Over the past years, this sector has seen a lot of changes and advancements in different farming approaches and techniques.
In the majority of developing countries including India agriculture as well as the horticultural sector is considered to be the driving force for economic development. About 60 % of the population are rural dwellers; who depend either directly or indirectly on agriculture for their livelihood and survival (SRID, 2013) and in India, fifty-five percent of the rural population depends directly or indirectly on agriculture. This indicates that agriculture plays a critical role in promoting economic growth, food security, poverty reduction, livelihoods, and rural development (Savadogo et al., 1995). To promote economic growth, food security, and poverty reduction in the rural populace in a general and farming community, in particular, India has witnessed a voluminous increase in horticulture production over the last few years. Significant progress has been made in area expansion resulting in higher production. Over the last decade, the area under horticulture grew by about 2.7 % per annum and annual production increased by 7.0 % (Devi and Jawaharlal, 2017). Horticulture occupies a very important position in the predominantly agricultural economy of western Himalayas, among all the fruits grown in the Kashmir, Apples are the most widely planted and are commercially the most important fruit crop (Malik and Choure, 2014). Apples are the edible fruit produced by the apple tree Malus domestica. The apple tree is cultivated worldwide and is the most widely grown species in the genus Malus. It originates from Central Asia and first began to grow in Central Asia. It is today grown in many regions of the world where the air temperature is cooler (Azizah, 2020). It is one of the best-loved fruit in many parts of the world and is one of the oldest fruits known to man (Negi, 2013).
World production of apples for the year 2019/20 was estimated to rise from nearly 5.0 million metric tons to 75.8 million as China rebounds from last year’s frost. China occupies the top position in terms of production which is expected to jump from 8.0 million tons to a near-record level of 41.0 million tons as good growing conditions were experienced in most of the major growing provinces. Despite disruptions due to COVID-19, exports were estimated to exceed 1.0 million tons, returning China to the position of a top exporter. European Union production is anticipated to drop from 11.5 million tons to 3.6 million as combinations of frost, drought, heat, and hail cause losses. United States (U.S) production is estimated to up over 300,000 tons to 4.8 million. India’s production is estimated to remain unchanged at 2.4 million tons as late monsoon rains inhibited higher output (USDA, 2020). Jammu and Kashmir (India’s northernmost regions) have immense scope for horticultural development owing to its topography, climate, and enormous diversity of agro-climatic niches (Swarup and Sikka 1987). It has the highest average yield and accounts for approximately 2/3rd of total apple production in India (Masoodi, 2003). Apple industry is the backbone of the economy of Kashmir valley, particularly in the Shopian district. Due to its good backward and forward linkages, it employs 60 % of the population and as the main source of livelihood for many households (Bhat and Choure, 2014). The area under apple cultivation in apple-producing regions of Jammu and Kashmir is estimated to be the second-largest in the world and the second-largest producer in Asia, thereby making it the largest contributor to the state GDP (Shah et al., 2020).
Jammu and Kashmir are rightly known as the apple state of India and are India’s main apple basket, as almost 89 % of the horticulture land in Kashmir is under apple cultivation. With more than Rs. 9000 crore turnover, the apple cart is the main mover and shaker of Kashmir’s economy (Ashraf, 2018). It was estimated that the area and production of apples in the Kashmir division during the year 2018–19 were 146,327 ha and 1,851,723 metric tonnes respectively (Anonymous, 2019). As the apple growers mostly rely on the traditional practices, which their forefathers were doing for generations, and do not adopt the recommended innovative technology, the production and productivity of apples in the state are not up to mark. So the importance of harnessing innovation to address structural problems of poverty, inequality, and unemployment has to be acknowledged in the horticultural sector in general and apple growers of developing countries in particular. Keeping in view the importance and need to examine the adoption level of apple growers, it clamored the researcher(s) to undertake the present study while paying kin attention to the apple growers’ socio-personal characteristics, ascertained the stages and categories of technology adoption, and the determinants of technology adoption that are relevant to improve apple productivity in India. This study is conceptualized to follow these paths.
2 Materials and methods
The present study was conducted in the state of Jammu and Kashmir, the northernmost state of India. It extends from 32°-17′ to 37°-05′ N latitude and 72°-20′ to 80°-30′ E longitude. The altitude ranges from 215 to 7012 m above mean sea level. Three districts from Kashmir valley namely district Shopian from the Southern region, district Budgam from the Central region, and district Baramulla from the Northern region were selected purposively due to the dominance of apple growers in the area.
A multi-stage sampling technique was employed to collect data for the study. In the first stage, the list of apple growers (orchardists) with a population of 3380 orchardists was obtained from concerned horticultural development offices. A Taro Yamane sample size determination adapted from Otabor and Obahiagbon (2016) was used to calculate the sample size: where: N = total population, n = sample size, (e) = level of significance, 1 = constant. Note: (e) = 0.05.
In stage two; three horticultural zones from each district that has a maximum area under apple cultivation were purposively selected from where one village was randomly selected from each zone, the stratum sample allocation adopted from Sajjad et al. (2012); Ali et al. (2013) and Farooq & Khan (2019) was used in allocating the strata: where: n = total sample size, ni = number of farmers in each location, N = total population of the apple growers, Ni = strata allocation.
The structured, closed-end, interview schedule (research tool) was prepared in consultation with a scientist of State Agricultural University (SKUAST Kashmir), farm Science Centers (KVK’s), and extension functionaries of line departments (horticultural department). The validity of the research tool was confirmed by several extension specialists in the region. The reliability of the research tool was measured by employing the test–retest method. The correlation coefficient (r = 0.82) was found to be highly significant at 0.01 level of probability indicating a high degree of dependability of the instrument for measuring knowledge of apple growers. The apple growers were personally interviewed by the investigators and 3 recruited, trained, and equipped enumerators. It was made sure that the questions which were not correctly understood by the apple growers were repeated whenever necessary, the field survey lasted twenty-one (21) working days. Apple growers were contacted at home as well as at their farms (apple orchards) during their convenient times to get the information. The qualitative data were converted into quantitative data by giving scores. The scores obtained by each apple grower in respect of a particular characteristic under the study were worked out. Different formulae of indexes and statistical tools were employed to obtain different results. At the end of the survey, only 300 respondents which represent 83.3 % of the sample size were interviewed.
2.1 Data analysis
The study used a combination of analytical tools like descriptive statistics, 5 points Likert scale, adoption index, multinomial logistics regression, and t-test (inferential statistics) to operationalize the study objectives. Objective one (describe the socio-personal characteristics) was achieved with descriptive statistics; this tool was used due to its simplicity and need to understand the frequency, percentage, mean, and standard deviation of apple growers in the study. Objective two (to ascertain the stages of technologies adopted) was achieved with the help of a 5-point Likert scale; the choice of this tool rest on the fact that there are five stages (awareness, interest, evaluation, trial, and adoption) that leads to technologies adoption in extension information dissemination. Objective three (classify or categorize technology adoption) was achieved from the descriptive mean time taken to fully adopt all the technologies, these were categorized as a laggard, late majority, early majority, early adopters, and innovators; this technique was adopted as the best tool to show the percentage of apple growers that adopted the technologies from the list of extension packages delivered to the farmers in the study. Objective four (find out the determinants of technology adoption that are relevant to improving apple productivity in India) was achieved with the help of multinomial logistics regression; this tool was used because it allow the researcher(s) to identify the particular socio-personal variables that influenced a particular stage of adoption in the study.
2.2 Analytical model
Multinomial is a specialized statistical method to analyze categorical data, EL-Habil (2012) believed that multinomial logistic regression (MLR) is a specialized case of generalized linear models (GLM) which has proven effective to analyse response variables that are composed of more than two categories. Garson (2009) noted that the MLR model can simultaneously compare more than one contrast; estimate the log odds of three or more covariates simultaneously. This is to say that the impact of predictor variables is usually explained in terms of odds ratios (El-Habil, 2012). One important aspect is that MLR applies maximum likelihood estimation to transform the dependent variable into a logit variable, while changes are calculated in the log odds of the dependent and not in the dependent itself as will by the ordinary least square. The model uses Pseudo R2 statistics to summarize the strength of the relationship between the dependent and independent variables.
MLR has less stringent requirements unlike the linear regression that assume linearity of the relationship between the independent and dependent variable, required the variables to be normally distributed, and that homoscedasticity must exist. In the classification table of logistic regression to check for the correctness or incorrectness of the dichotomous, ordinal, or polytomous dependent, the goodness of fit tests (likelihood ratio test) is checked for the significance of individual independent variables that should be retained in the further analysis of the model. The MLR adopted from EL-Habil (2012) is defined as:
Where all the π’s add to unity, then the reduced model is reduced to:
MLR uses a reference or baseline category and the predicted probability of estimate is defined as:
Since the awareness stage will be taken as the baseline group, the probability of each stage of adoption is predicted from:
3 Results and discussion
3.1 Personal and socio-economic characteristics of apple growers with their descriptive statistics
Information on personal, social, and economic characteristics (age, education, annual income, land holdings, innovative proneness, and experience in apple cultivation, risk orientation, scientific orientation, and economic motivation) of apple growers in the research area was important to determine different aspects of apple cultivation and their impact on the adoption of recommended innovative technologies and practices. From Table 2, it was evident that a greater proportion (49.7 %) of the apple growers were middle-aged farmers with a medium level of experience (51.0 %) in apple cultivation. The results revealed that the average age and experience of apple growers are 42.16 and 22.13 respectively, this suggests that the apple growers are young and in their active farming age with over two decades of experience. The results were in line with the research findings reported by Cavane (2011), Gangaiah et al. (2006), and Joseph and Easwaran (2006) whose farmers in their study were young and active.
Most (27.7 %) of the apple growers were illiterate in the study. Less than twenty percent of apple growers (18.0 %) had attained secondary education and a minimal percentage of apple growers (6.7 %) were above graduate and are engaged in apple cultivation. The low educational status of apple growers was due to the traditional base of rural people, the majority of who do not prefer to send their children to school, rather wanting them to assist in their farm and household activities. They do not realize the influence of formal education in one’s life besides, the illiteracy of the parents might have come in the way of getting a better education for their children. The long distance between the villages and schools besides the lack of transport facilities may also be a hindrance to better educational status. Furthermore, the villages were having educational facilities only up to primary and secondary school level and for getting higher studies one has to go to cities and apple growers do not prefer to migrate to nearby cities due to limited resources. As a result, the education level of the people, in general, is restricted and the same was reflected in apple growers. As education is an important aspect of the personal, social, and economic development of a person, low production as well as productivity of major crops in different regions of the world is due to the low educational status of the people associated with the farming sector, resulting in low adoption of innovative technologies and recommended practices at their farms. The priority of different service providers (Government and NGOs) should be to educate the farming community through informal means and community classes besides providing other services to them. A similar type of finding was noticed by Manay and Farzana (2000) and Rao (2005).
A medium level of income was found in 50.0 % of the apple growers in the study with an average annual income of 310,718.33 Rs. Poor economic condition was the main reason for the low income of apple growers besides having marginal land holding, lack of technical guidance about apple cultivation, and low risk-taking ability with poorly established orchards were the other reasons for low income of the growers. Similar findings were noticed by Ekale et al. (2015) who proposed that increase in population leads to fragmentation of ancestral land from generation to generation. Besides in the Kashmir region, the majority (76.7 %) of the farmers have less than one hectare of land for cultivation purposes and the same is the case with apple cultivation.
Apple growers have different levels of innovative proneness; 40.0 % had medium level innovative proneness, 32.0 % had high-level innovative proneness, and the remaining 28.0 % has low-level innovative proneness. Innovation proneness of apple growers could be resulting in extension contact and over decades of experience in apple cultivation. Similar findings were reported by Barman and Gogoi (2000).
Risk orientation, scientific orientation, and economic motivation of apple growers are the driving factors for higher production, productivity, and yield in apple fruit, and all these driving forces were not found satisfactory in the study. The expectation of economic returns from well-established orchards can improve the apple growers’ motives for these factors, besides innovative proneness, the adoption of scientific technologies and recommended practices of apple growers could also serve as a reason to improve the values. These findings were similar to the findings of Ganesan and Seetalakshmi (2002); Joshi et al. (2002).
3.2 Technology adoption by apple growers in the study
Table 3 shows the results of the adoption of innovative agricultural technologies disseminated to apple growers in the study area. The adoption of these productive or innovative technologies was captured in 5-point Likert scales as awareness (1), interest (2), evaluation (3), trial (4), and adoption (5). The results were scaled and weighted to suit the five stages of adoption. Fifteen (15) technologies were delivered to the apple growers and nine of them have been fully adopted and are being practiced by the orchardist in the study area. The result of the adoption threshold presented in Table 3 adapted the pattern used in Obianefo et al. (2020). The study, therefore, revealed that preparation of land and planting, pruning of young non-bearing trees, thinning and rejuvenation of unproductive orchards, irrigation and drainage, pollination and pre-harvest fruit drop, organic manures (fully decomposed FYM), inorganic fertilizers, methods of fertilizer application, and packaging and storage are the successful technologies adopted by the apple growers. Obianefo et al. (2020) viewed agricultural technologies disseminated to the farmers as eco-friendly technologies aimed at improving the farmers’ productivity.
The three technologies under the trial stage of adoption are training and pruning of dwarf trees, cultivation and mulching and pest, and disease management. Equally, pruning of bearing trees, and methods to overcome nutritional deficiencies are being evaluated. Only harvesting and picking techniques disseminated to the apple growers are under the interest stage of adoption. These techniques must be good enough to arouse the farmers’ interest. Often time, extension practitioners have advised that a demonstration farm or plot should be sited closer to the farmers’ farm to arouse their interest. In comparing the productiveness of the demo plot, the farmers can choose to evaluate the technology before giving it a trial that will lead to the eventual adoption of the technology if proven gainful.
3.3 Classification of adoption in the study area
The apple growers that adopted the agricultural technologies delivered in the study were classified into adoption types to further inform the readers on the possibility of attaining sustainability in apple production in the Kasmir area of India. Singha and Baruah (2011) noted that the adoption of best practices is the best way to control the risk and uncertainties associated with agriculture. Deepak et al. (2019) classified or categorized adoption based on the time taken to fully adopt all the practices preached to farmers, though this depends mainly on how long the technology dissemination lasted because most agricultural programs are time-bound. Whatever the time it took to adopt all the technologies; it is important to bear in mind that the five categories are laggard, late majority, early majority, early adopters, and innovators (Rogers and Shoemaker, 1971), the innovators often act as focal points of information to farmers which can lead to quick diffusion of adoption information. Rogers and Shoemaker (1971) used two parameters (average time and standard deviation taken to adopt all the technology) to calculate the time of adoption. For the sake of the study, Five years window was given to the apple growers to fully adopt the technologies and the author(s) classified these orchardists based on the five years available for the implementation of most agricultural projects; laggard (5 years), late majority (4 years) early majority (3 years) early adopters (2 years) and innovators (1 year).
The study, therefore, revealed that a greater proportion (42.5 %) of the apple growers are early technology adopters (Fig. 1). These set of apple growers are open-minded and immediate extension target on these set of farmers produced immediate result of full adoption, also 30.5 % of the apple growers are an early majority, and 18.0 % of the apple growers are the late majority, Rogers, and Shoemaker (1971); and Deepak et al. (2019) noted that the communication between farmers is the channels that influence late adopters, they chose to monitor the performance of technology before adopting it. Equally, 7.0 % of the apple growers are laggard; this set of apple growers are the last to adopt any technology, most of them do after the life of the project by observing the resultant impact on fellow farmers. The remaining 2.0 % of the farmers are innovators, these set of apple growers receive information about recent developments in technology and swim into action immediately. Though Deepak et al. (2019) contend that the education of farmers is what motivate them to become innovator, they receive the information, understand and process it, and started the implementation with an expectation to achieve the desired changes.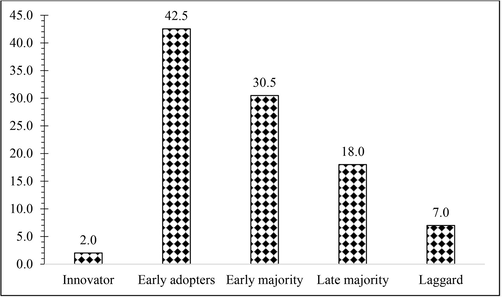
Classification of adoption in the Study area.
3.4 Determinants of technology adoption by apple growers in the study
Multinomial logistic regression (MLR) analysis was used to identify the variables that determined the adoption of the technologies delivered to apple growers in the study. Several diagnostic checks were implemented to ensure the best-fitted model. The chance accuracy computed from the case processing summary (Table 1) had a value of 0.006. El-Habi (2009) submitted that the benchmark value for the MLR is 25 % which is only established when the overall chance accuracy is greater than the manually computed value. However, the overall chance accuracy had a value of 48 % (Table 2) which is greater than the computed 0.006 % which makes MLR accurate for the analysis. Again; the Akaike information criterion (AIC) and Bayesian information criterion (BIC) values of 954.599 and 969.414 respectively are close to the log-likelihood value of 946.599 (Table 3) which means that the fitted explanatory values are close to the expected value. The Nagelkerke value of 0.515 represents the highest Pseudo R-square (Table 4) which explained 51.5 % variation in the adoption of technologies disseminated to the apple growers as determined by the joint action of socio-personal characteristics. Also; the Likelihood ratio test (Appendix 1; Table 5) shows the explanatory variables included in the model are adequate. On the other hand, the significant Chi-square value of 204.1 (significant at 1 % level of probability) implies the general significance of the entire model. Source: Field Survey, 2019–2020. Source: Field Survey, 2019–2020. Source: Field Survey, 2019–2020. Note: reference category = awareness; (***) Sig. @ 1 %. Source: Field Survey, 2019–2020.
Region
District
Horticultural
ZoneVillage
No. of orchardists
Proposed orchardists to be studied
Orchardists successfully studied
South
Shopian
Shopian
Wathoo
234
25
21
Imam Sahab
D K Pora
412
44
37
Zaina pora
Chitragam
488
52
43
Total (A)
1134
121
101
Central
Budgam
Khag
Ichahama
162
17
14
Kanir
Sursyar
541
58
48
Beerwah
Lalpora
269
29
24
Total (B)
972
104
86
North
Baramulla
Wagoora
Nowpora Jagir
639
68
57
Baramulla
Singpora
73
8
6
Sopore
Nowpora
562
60
50
Total (C)
1274
136
113
Grand Total (A + B + C)
3380
360
300
Sn.
Socio-personal variables
Frequency (n = 300)
Percentage (%)
Min.
Max.
Mean
Std. Dev.
1
Age Group:
12
80
42.16
17.70
Young
79
26.3
Middle
149
49.7
Old
72
24.0
2
Level of Education:
0
6
2.09
1.16
Illiterate
83
27.7
Primary
39
13.0
Middle
45
15.0
Matric
54
18.0
10 + 2 (12th)
34
11.3
Graduate
27
9.0
Above graduate
20
6.7
3
Annual Income:
40,0000
2,000,000
310,718
227,864
Low
71
23.7
Medium
150
50
High
79
26.3
4
Land Holding:
1
140
14.04
10.48
Marginal (Upto 1 Hectare)
230
76.7
Small (1.01–2 Hectares)
39
13
Medium (2.01–4 Hectares)
20
6.7
Large (Above 4 Hectares)
11
3.7
5
Innovative Proneness:
1
12
2.59
1.73
Low
84
28
Medium
120
40
High
96
32
6
Experience:
2
50
22.13
10.47
Low
88
29.3
Medium
153
51
High
59
19.7
7
Risk Orientation:
3
45
18.83
5.38
Low
102
34
Medium
98
32.7
High
100
33.3
8
Scientific Orientation:
5
30
18.90
5.99
Low
88
29.3
Medium
127
42.3
High
85
28.3
9
Economic Motivation:
2
28
17.52
5.56
Low
104
34.7
Medium
130
43.3
High
66
22
ID
Awareness
Interest
Evaluation
Trial
Adoption
Total
Mean
Decision
A.
Preparation of land and planting
0
2
63
320
990
1375
5
Adopted
B
Training and pruning of apple trees:
1
Pruning of young non-bearing trees
0
20
39
360
935
1354
5
Adopted
2
Pruning of bearing trees
20
100
360
300
175
955
3
Evaluation
3
Training and pruning of dwarf trees
30
40
123
480
445
1118
4
Trial
C
Orchard Management:
1
Cultivation and Mulching
10
24
57
356
850
1297
4
Trial
2
Thinning and rejuvenation of unproductive orchards:
0
20
60
320
950
1350
5
Adopted
3
Irrigation and drainage
0
0
60
320
1000
1380
5
Adopted
4
Pollination and pre-harvest fruit drop:
0
16
60
320
960
1356
5
Adopted
D
Nutrient Management:
1
Organic manures (Fully decomposed FYM):
0
6
9
520
820
1355
5
Adopted
2
Inorganic fertilizers
0
0
18
476
875
1369
5
Adopted
3
Methods of fertilizer application
10
14
63
176
1090
1353
5
Adopted
4
Methods to overcome nutritional deficiencies
50
42
228
400
265
985
3
Evaluation
E.
Pest and disease management
49
18
72
480
490
1109
4
Trial
F.
Harvesting and picking
82
108
360
136
50
736
2
Interest
G.
Packaging and storage
10
4
30
316
995
1355
5
Adopted
Interest stage
Evaluation stage
Trial stage
Adoption stage
Parameter Estimates
B
Wald
Exp(B)
B
Wald
Exp(B)
B
Wald
Exp(B)
B
Wald
Exp(B)
Intercept
−0.940
0.67
−2.500
4.39
−7.098
27.500
−10.56
57.74
Age (year)
0.033
5.99***
1.033
0.034
6.44***
1.035
0.068
22.95***
1.071
0.088
38.91***
1.092
Experience (year)
0.037
2.89***
1.037
0.062
8.10***
1.064
0.137
32.84***
1.147
0.136
34.68***
1.146
Level of education
0.697
14.36***
2.008
0.589
9.70***
1.803
0.480
5.09***
1.616
0.846
18.66***
2.329
Annual income (Rs.)
0.000
11.36***
1.000
0.000
22.78***
1.000
0.000
31.80***
1.000
0.000
28.58***
1.000
Extension contact
0.219
6.39***
1.244
0.312
13.07***
1.366
0.440
22.23***
1.553
0.353
15.19***
1.424
Scientific orientation
−0.180
18.45***
0.836
−0.160
14.36***
0.853
−0.137
9.36***
0.872
0.000
0.00
1.000
Chi-square
204.1
Pseudo R-square (Nagelkerke)
0.515
Explanatory variables
Xi
B (Interest)
B (Evaluation)
B (Trial)
B (Adoption)
Intercept
−0.943
−2.495
−7.098
−10.56
Age
42.16
0.033
0.034
0.068
0.088
Experience
22.13
0.037
0.062
0.137
0.136
Education
2.09
0.697
0.589
0.48
0.846
Annual Income
310718.33
0.000
0.000
0.000
0.000
Extension Contact
3.66
0.219
0.312
0.44
0.353
Scientific Orientation
18.90
−0.179
−0.158
−0.137
0.000
Predicted response estimation
0.145
−0.300
−1.173
−0.776
Probability
0.315
0.202
0.084
0.126
The coefficient of age was positive and significant at 1 % level of probability for the four categories shown in Table 5, this implies that a marginal or unit increase in age of apple growers will increase the odds ratio or exponential value of the response variable. This is to say that technology adoption increased in stages by 1.033 units (interest stage), 1.035 units (evaluation stage), 1.071 units (trial stage), and 1.092 units (adoption stage). The result indicates that older farmers are more adoptive of agricultural technologies in the study area.
The coefficient of farming experience was positive and significant at 1 % level of probability for the four categories shown in Table 5, this implies that a marginal or unit increase in apple growing experience will increase the odds ratio or exponential value of the response variable. This is to say that technology adoption increased in stages by 1.037 units (interest stage), 1.064 units (evaluation stage), 1.147 units (trial stage), and 1.146 units (adoption stage). The result further shows that experienced apple growers tried more of the technologies disseminated in the study area. Though adoption stage came second in the odds ratios to mean that adoption of agricultural technologies has not attained sustainability in the study. As was expected in a priori expectation, older and experienced growers would have seen the need to change their old and unproductive practices in apple production which was expected to influence their choice of adoption. This result is in agreement with Uchemba et al. (2021) who also found a significant and positive relationship between cassava production and technology adoption.
The coefficient of the level of education was positive and significant at 1 % level of probability in all the four categories as shown in Table 5, this implies that a marginal change or advancement in the level of education acquired by the apple growers will increase the odds ratio or exponential value of the response variable. This is to say that technology adoption increased in stages by 2.008 units (interest stage), 1.803 units (evaluation stage), 1.616 units (trial stage), and 2.329 units (adoption stage). The result, therefore, revealed that educated apple growers are more technology adopters in the study. Though the interest stage of technology adoption came second in the odds ratio which could mean that the sustainability of agricultural technologies adoption in the study is doubtful. Education was expected to reduce the difficulty of technology adoption as part of the information would have been taught in school during college days. This result is in agreement with Onugu et al. (2019) and Ironkwe et al. (2016) who found a significant and positive relationship between agricultural production and technology adoption.
The coefficient of annual income was positive and significant at 1 % level of probability in all the four categories as shown in Table 5, a unit increase in annual income resulted in constant odd ratios. EL-Habil (2012) and Garson (2009) noted that an odd ratio close to one implies that a change in the explanatory variable does not lead to a change in the response variable. This result indicates that an increase in annual income resulting from sales of more apples does not necessarily guarantee increased technology adoption. Apple growers could be in the business to raise money and divert to other businesses they termed more lucrative in the area, as such lesser attention will be paid to technology adoption.
The coefficient of extension contact was positive and significant at 1 % level of probability in all the four categories as shown in Table 5, this implies that a unit increase in the number of extension contact or meetings between extension agents and apple growers will increase the odds ratio or exponential value of the response variable. This is to say that technology adoption increased in stages by 1.244 units (interest stage), 1.366 units (evaluation stage), 1.553 units (trial stage), and 1.424 units (adoption stage). The results further indicate that continuous meeting of apple growers and extension workers made more of the farmers attempt new technology different from what they are used to in the study. This extension of teaching will lead to successful adoption of the technologies which is second in odd ratio as found in the study. This result is in agreement with Alarima et al. (2020) who noted that extension agents are the medium through which agricultural technologies are disseminated to the farmers in rural farming communities.
The coefficient of scientific orientation was negative and significant at 1 % level of probability in three categories as shown in Table 5, this implies that a unit increase in the number of apple growers that are less oriented scientifically will reduce the odds ratio or exponential value of the response variable. This is to say that technology adoption reduces in stages by 0.836 units (interest stage), 0.853 units (evaluation stage), and 0.872 units (trial stage). The results have proven that apple growers need to be scientifically oriented to handle the issues of agricultural technology adoption. At present, technology adoption has graduated from the evaluation stage to the trial stage haven witnessed that the trial stage records the highest odd ratio in the study.
Furthermore, the probability of apple growers advancing to a particular stage of technology adoption was later estimated for better argument and novelty. Table 6 revealed the results of the prediction. It was seen that the probability of advancing to the interest stage of technology adoption has the highest probability value of 0.315 or 31.5 %. Most of the farmers have developed an interest in the technologies disseminated to them. Also. The probability of transiting to the evaluation stage has a value of 0.202 or 20.2 %. The trial stage has the least probability value of 0.084, furthermore, the probability of adopting the technologies has a probability of 0.126. This revealed that the adoption of agricultural technologies by apple growers in the study has not attained sustainability. Efforts should be there be intensified by the extension workers to ensure proximity and timeliness in delivering services to the farmers till they have fully adopted all the technologies presented to them.
4 Conclusions
This study on the assessment of socio-personal determinants of improved technology adoption by apple growers adopted several analytical techniques to come up with empirical evidence to support the claim of technology adoption on apple productivity. Technology adoption has been identified as a way to control the risk and uncertainty inherent in the agricultural sector, this should encourage the farmers to brace for early adoption of agricultural technologies. These early adopters formed the channel through which diffusion of innovation is sustained. Haven used a combination of statistical tools to operationalize the study objectives aimed at identifying those socio-personal variables that influenced the adoption and sustainability of recommended innovative practices to improve apple productivity which will help to strategize and design a policy action plan to further implement the technology dissemination agenda.
The study, however, found that there is an urgent need to improve the education level of the farmers to further strengthen the sustenance of the nine technologies (preparation of land and planting, pruning of young non-bearing trees, thinning and rejuvenation of unproductive orchards, irrigation and drainage, pollination and pre-harvest fruit drop, organic manures (fully decomposed FYM), inorganic fertilizers, methods of fertilizer application, and packaging and storage) adopted. Since all the technologies have gone beyond the awareness stage of adoption, it becomes necessary that the extension personnel should consolidate their service delivery to the apple farmers. For a better implementation of service delivery on innovative technology, every program should be centered on age, experience, level of education, annual income, extension contact, and scientific orientation (determinants) since these variables influenced the apple growers’ responses to the recommended technologies. Some vital information in this study should be replicated in some quarters, if similar findings were observed, generalization should then be recommended.
Acknowledgements
The authors extend their appreciation to the Deanship of Scientific Research at King Khalid University for funding this work through Larg Groups Project under grant number RGP. 2/200/43.
Declaration of Competing Interest
The authors declare that they have no known competing financial interests or personal relationships that could have appeared to influence the work reported in this paper.
References
- Effect of information sources on farmers’ adoption of sawah eco-technology in Nigeria. J. Agric. Extension. 2020;24(1):64-72.
- [Google Scholar]
- Technical Efficiency of Sugarcane Production in District Dera Ismail Khan. Sarhad J. Agric.. 2013;29(4):585-590.
- [Google Scholar]
- Anonymous, 2019. Directorate of Horticulture, Planning and Marketing Government of J&K, Agriculture Production Department, Jammu and Kashmir.
- Ashraf, 2018. Eighty nine percent of horticulture land under apple cultivation in Kashmir: Rising Kashmir-The local English daily published on May 20.
- Review of Phytochemical and Pharmacological Effects of Apple. Int. J. Res. Rev.. 2020;7(9):231-237.
- [Google Scholar]
- Correlates of farmers reading habit – A study on Assamese daily. J. Extension Educ.. 2000;11(4):2926-2931.
- [Google Scholar]
- Status and strength of apple industry in Jammu and Kashmir. Int. J. Res.. 2014;1(4):277-283.
- [Google Scholar]
- Farmers’ attitude and adoption of improved maize varieties and chemical fertilizers in Mozambique. Indian Res. J. Extension Educ.. 2011;11:1-5.
- [Google Scholar]
- Regression Analysis by Example. John Wiley & Sons; 2006.
- Deepak, V., Pramod, K.J. and Devesh, R., 2019. Identifying Innovators and Early Adopters of Agricultural Technology. A Case of Wheat Varieties in Rajasthan, India. IFPRI Discussion Paper 01808. Available online at: https://www.researchgate.net/publication/335977428_Identifying_Innovators_and_Early_Adopters_of_Agricultural_Technology_A_Case_of_Wheat_Varieties_in_Rajasthan_India#fullTextFileContent.
- Horticulture and Indian Economy. Kurukshetra – A Monthly J. Rural Dev.. 2017;65(6):14-15.
- [Google Scholar]
- Adoption of Agricultural Innovations as a Two-Stage Partial Observability Process. Agric. Econ.. 2003;28(3):187-196.
- [Google Scholar]
- Bringing Environment into the Study of Agriculture: Observations and Suggestions Regarding the Sociology of Agriculture. Rural Sociol.. 1983;48:201-218.
- [Google Scholar]
- Knowledge and adoption of soil testing recommendations by the farmers in distress prone districts of Marathwada. AGRESCO Rep. 2015:1-8.
- [Google Scholar]
- An Application on Multinomial Logistic Regression Model. Pak. J. Stat. Oper. Res.. 2012;VIII(2):271-291.
- [Google Scholar]
- Assessing the impact of the green revolution, 1960 to 2000. Science. 2003;300(5620):758-762.
- [Google Scholar]
- Crop Variety Improvement and Its Effect on Productivity: the Impact of International Agricultural Research. UK: CABI Publishing; 2003.
- Knowledge Gap of Improved Management Practices of Sugarcane Growers in Khyber Pakhtunkhwa, Pakistan. Sarhad J. Agric.. 2019;35(2):523-531.
- [Google Scholar]
- Adoption of Agricultural Innovations in Developing Countries: A Survey. Econ. Dev. Cult. Change. 1986;35(2):255-298.
- [Google Scholar]
- Participation pattern of women on IPM in Rice. Agric. Extension Rev.. 2002;14(5):28-30.
- [Google Scholar]
- Impact of Self help groups on income and employment-A case study. Kurukshetra. 2006;54(5):18-23.
- [Google Scholar]
- Logistic Regression with SPSS. North Carolina State University, Public administration Program; 2009.
- Agricultural productivity and economic growth. Handb: Agric. Econ.. 2010;4:3825-3866.
- [Google Scholar]
- Adoption of root and tuber technologies disseminated by the national root crop research institute in Anambra State. J. Agric. Extension. 2016;1(20):42-43.
- [Google Scholar]
- General profile and communication behaviour of contact farmers. Madhya J. Extension Educ.. 2002;4:36-40.
- [Google Scholar]
- Stakeholders prioritization of climate-smart agriculture interventions: evaluation of a framework. Agric. Syst.. 2019;174:23-31.
- [Google Scholar]
- Adoption and diffusion of improved technologies and production practices in agriculture: Insights from a donor-led intervention in Nepal. Land Use Policy. 2020;95:104621
- [Google Scholar]
- Diffusion Theory and Integrated Pest Management: Illustrations from the Michigan Fruit IPM Program. Bull. Entomol. Soc. Am.. 1985;31(3):40-45.
- [Google Scholar]
- Economics of Apple Cultivation “With Special Reference to South Kashmir- India. J. Econ. Sustain. Dev.. 2014;5(9):125-129.
- [Google Scholar]
- Socio-economic characteristics of rural families. Maharashtra J. Extension Educ.. 2000;19:325-328.
- [Google Scholar]
- Agriculture in Jammu and Kashmir problems of apple industry in J&K with special reference to Sopore town. Int. J. Manage. Social Sci.. 2003;2(3):33-46.
- [Google Scholar]
- Perception and adoption of a new agricultural technology: Evidence from a developing country. Technol. Soc.. 2018;55:126-135.
- [Google Scholar]
- A Survey of Growth Prospects of Apple Production in Kinnaur District of Himachal Pradesh. Int. J. Manage. Soc. Sci.. 2013;4(2):11-17.
- [Google Scholar]
- Mediation effect of adoption of good agronomic practice in rice productivity in Anambra State, Nigeria. Int. J. Agric. Rural Dev.. 2020;23(1):4913-4926.
- [Google Scholar]
- Constraints to adoption of good agronomic practice among rice farmers in Anambra State value chain development programme. In: Proceedings of the 2nd International Conference on Food Security and Hidden Hunger. 2019. p. :55-61.
- [Google Scholar]
- Statistical approach to the link between internal service quality and employee job satisfaction: A Case Study. Am. J. Appl. Math. Statistics. 2016;4(6):178-184.
- [CrossRef] [Google Scholar]
- Irrigation management under water scarcity. Agric. Water Manag.. 2002;57(3):175-206.
- [Google Scholar]
- Drivers of precision agriculture technologies adoption: a literature review. Procedia Technol.. 2013;8:61-69.
- [Google Scholar]
- Confronting the environmental consequences of the rice Green revolution in Asia: IFPRI Discussion Paper Series 2, Environment and Production Technology Division (EPTD). Washington, DC: International Food Policy Research Institute; 1994.
- Building cooperative entrepreneurship through dairy cooperative in Ajmer. The Co-operator. 2005;43(5):231-234.
- [Google Scholar]
- Diffusion of Innovations. New York: The Free Press, MacMillan; 1983. p. :453.
- Technical Efficiency Analysis of Milk Production in Khyber Pakhtunkhwa Province: A stochastic frontier approach. Pakistan J. Life Soc. Sci.. 2012;11(4):36-41.
- [Google Scholar]
- Adoption Behaviour Towards the Use of Nuclear Technology in Agriculture: A Causal Analysis. Technol. Soc.. 2018;55:175-182.
- [Google Scholar]
- Mechanization And Agricultural Supply Response in the Sahel: A Farm-Level Profit Function Analysis. J. Afr. Econ.. 1995;4(3):336-377.
- [Google Scholar]
- Media Exposure of Apple Growers about Recommended Apple Production Technology. Indian J. Extension Educ.. 2020;56(3):48-53.
- [Google Scholar]
- Farmers’ Adoption Behaviour in Rice Technology: An Analysis of Adoption Behaviour of Farmers in Rice Technology under Different Farming Systems in Assam. J. Hum. Ecol.. 2011;35(3):167-172.
- [Google Scholar]
- SRID, 2013. Agricultural Production Estimates’: Ministry of Food and Agriculture, Statistics, Research and Information Directorate (SRID) published on February.
- Is environmentally friendly agriculture less profitable for farmers? Evidence on integrated pest management in Bangladesh. Rev. Agric. Econ.. 2007;29(1):103-118.
- [Google Scholar]
- Production and marketing of apples. In: An economic study of Himachal Pradesh. New Delhi: Mittal Publications; 1987.
- [Google Scholar]
- Adoption of Improved Cassava Production Technologies among Small-Scale Farmers in Anambra State, Nigeria. J. Plant Sci.. 2021;9(4):119-127.
- [Google Scholar]
- United Nations, (2018): Sustainable Development Goals, The United Nations, New York https://www.un.org/sustainabledevelopment/hunger/ 2018 Available from: Accessed date: 14 May 2018.
- USDA, 2020. Fresh Apples, Grapes, and Pears: World Markets and Trade: Foreign Agricultural Service; United States Department of Agriculture, Global Market Analysis: 01-10.
- Matching Innovations With Potential Users, A Case Study of Potato IPM Practices. Agric. Ecosyst. Environ.. 1998;70:203-215.
- [Google Scholar]
- World Bank, 2007. World Development Report 2008: Agriculture for Development: World Bank, Washington, DC.
- World Bank, 2008. Agriculture for Development. World Development Report 2008, World Bank, Washington D.C, 2008 Available from: https://siteresources.worldbank.org/INTWDR2008/Resources/WDR_00_book.pdf, Accessed date: 4 April 2018.
- World Bank, 2018. Understanding Poverty, The World Bank, Washington D.C, 2018 Available from: http://www.worldbank.org/en/topic/poverty/overview, Accessed date: 14 May 2018.


