

Translate this page into:
Feasibility of variable rate application of diammonium phosphate fertilizer to wheat crop under center pivot irrigation system
⁎Corresponding author. azeyada@ksu.edu.sa (Ahmed M. Zeyada)
-
Received: ,
Accepted: ,
This article was originally published by Elsevier and was migrated to Scientific Scholar after the change of Publisher.
Peer review under responsibility of King Saud University.
Abstract
A study was conducted, on a 30 ha wheat field under a solar energy powered center pivot irrigation system in a commercial farm located 400 km north of Khartoum, Sudan, to evaluate the feasibility of variable rate fertilizer application of Diammonium Phosphate (DAP) on wheat crop based on variable soil phosphorus content. Soil phosphorus content was divided into three categories (low: 3.75 to 4.50 ppm, medium: 4.51 to 5.25 ppm and high: 5.26 to 6.00 ppm) and a GIS soil phosphorus content map of the experimental field was generated. Three variable application rates (200 kg ha−1, 160 kg ha−1 and 120 kg ha−1) of granular DAP fertilizer were determined to fit the low, medium and high soil phosphorus contents, respectively. The the DAP fertilizer rate of 200 kg ha−1 was the rate practiced for wheat production in the experimental farm.
The normalized Difference Vegetation Index (NDVI), measured at different wheat growth stages using sentinel-2 satellite images, and wheat grain yield were used to evaluate the response of wheat crop to the variable DAP fertilizer application rates. Excluding the tillering stage, the results showed significant differences in the NDVI values among different soil phosphorus levels and DAP fertilizer application rates at other growth stages, including stem elongation, grain filling and maturity stages. Moreover, wheat yield results showed significant differences among different soil phosphorus contents (P > F = 0.0001) and DAP fertilizer application rates (P > F = 0.0457). On the average, the highest yield of 2.449 t ha−1 was recorded in the field areas treated with the high DAP fertilizer application rate (200 kg ha−1), where the second highest yield of 2.441 t ha−1 was observed in field areas under the medium DAP fertilizer application rate (160 kg ha−1); however, no significant differences between these two yield values. Based on these results, the total savings of the DAP fertilizer was estimated to be 792 kg (equivalent to 475.2 $) in the experimental field (30 ha), only when the medium DAP fertilizer rate (160 kg ha−1) was used in the medium and high soil phosphorus zones, saving 15.84 $ ha−1 without affecting production.
Keywords
Soil Phosphorus
DAP
Variable rate application
Wheat
NDVI
Sentinel-2
Yield

1 Introduction
Conventional agricultural practices do not take into consideration the spatial variations existing in the fields, but rather treat them as homogeneous units. Ignoring the spatial field variability can result in over-application of agricultural inputs or practices in some areas of the field and under-application in others, which will lead to poor application of inputs and/or practices (Ghosh and Mandal, 2000). Precision agriculture (PA) is an ever-evolving technology that aims at avoiding the poor application of agricultural inputs and practices by using geo-referenced data for better management of agricultural inputs through the application of accurate amounts in the right locations and at the optimum time (Dong et al., 2012; Mulla 2013).
Variable rate technology (VRT) is a key component of PA, as it is used to apply agricultural inputs (e.g. fertilizers, pesticides, irrigation water, planting, and tillage) at the desired rates to meet the requirements of different field locations based on spatial variability in the field characteristics (Diacono et al., 2013). The major components of VRT include Global Positioning System (GPS), computers and software programs, and applicators (El Nahry et al., 2011). In the conventional applications, fertilizers are commonly applied at an average uniform rate across the whole field based on soil and crop requirements. However, the application of fertilizers at constant rates is ineffective and causes poor application of fertilizers that fails to achieve the appropriate rates of fertilizers required for soil and crop in some areas of the field (Chandel et al., 2016). Therefore, using the spatial variability information to apply the recommended nutrient amounts according to the requirements of each field zone can maximize the economic return or profit (Yang et al., 2001).
Phosphorus (P) is considered as the second largest limiting element after nitrogen for crop growth, where unbalanced application of phosphorus on agricultural fields can negatively affect the wheat yield (Rowse and Stone, 1981). Also, Maqbool et al. (2012) reported that application of the phosphorus fertilizer with the crop seeds at the time of sowing produced higher number of fertile tillers and taller plants, which was attributed to the fact that fertilizer was in immediate contact with the emerging roots during seedling growth.
The DAP is one of the most important sources of phosphorus (P) fertilizers worldwide and accounts for most of the consumption of P2O5 (Cedrez et al., 2020; Patel et al., 2020). It is commonly used as a main source of phosphorus for crop production in Sudan (Fadul et al., 2018). Mutar and Musleh (2020) also noted that phosphorus element converted to the pre-cooked version of the DAP fertilizer was better used by plants than other phosphate fertilizers.
Therefore, distributing fertilizers within agricultural fields based on site-specific needs of soil and plants is essential to optimize crop yields and reduce the cost of inputs (Fitzgerald et al., 2010). The optimum application of DAP fertilizer is important economically and environmentally to conserve the phosphate resources in the world (Gokmen and Sencar, 1999).
Nowadays, the use of remote sensing technology to monitor the crop growth and production has become essential for the management of agricultural practices (Al-Gaadi et al., 2014). Therefore, remote sensing applications based on the measurement and interpretation of the spectral reflectance of agricultural crops are among the most important tools for the assessment of crop growth and yield performance (Aparicio et al., 2000). Several studies demonstrated the potential for using vegetation indices as fast and cost-effective tools for monitoring crop growth status and predicting crop yield (Becker et al., 2010; Nebiker et al., 2016). The normalized difference vegetation index (NDVI) is one of vegetation indices that has been widely and successfully used to monitor crop growth and to estimate crop yield (Durgun et al., 2020). Ren et al. (2008) reported that NDVI was one of the good vegetation indices for crop growth monitoring, and was defined as being the combination of the measured reflectance in both, red and near infrared parts of the spectrum. Moreover, NDVI is a highly sensitive indicator that can detect variations in small scale fields (Wang et al., 2004).
Based on the importance of variable rate applications of fertilizers, this study was conducted to assess the response of spring wheat to variable rates of Diammonium Phosphate (DAP) fertilizers applied based on field soil phosphorus levels. The specific objectives, however, include (i) generation of a map of soil phosphorous levels for the experimental field, (ii) application of variable rates of DAP fertilizer using a variable rate applicator, (iii) studying the performance and yield of wheat crop under different DAP application rates and phosphorus levels, and (iv) assessment of the economic feasibility of variable rate application of DAP fertilizer.
2 Materials and methods
2.1 Experimental site
The study was conducted, in the period from November 2018 to March 2019, on a 30 ha field (ID: S1-3) in Al-Kafaa commercial farm of Al-Rajhi International Investment Company, located in the Northern region of Sudan between the latitudes of 18°10′8.503″ and 18°11′37.837″ N and the longitudes of 34°0′26.021″ and 34°11′18.415″ E (Fig. 1). The experimental field was planted with spring wheat (variety Imam) under a solar-powered center pivot irrigation system. The wheat crop was planted on November 10th, 2018 using a Calydon seed drill (T4.8 hybrid model) with a spacing of 11 cm between rows. The soil of the experimental field, which was characterized as a sandy loam soil, had an EC ranging between 0.37 and 0.47 dS cm−1, a pH values between 7.64 and 8.78, soil nitrogen values ranging between 0.15% and 0.20% and CaCo3 ranging between 14.10% and 25.10%. Weather in the farm was very hot in the summer (44 ± 2 °C) and cold to moderate in the spring (16 ± 2 °C) with an annual rainfall of about 37 mm.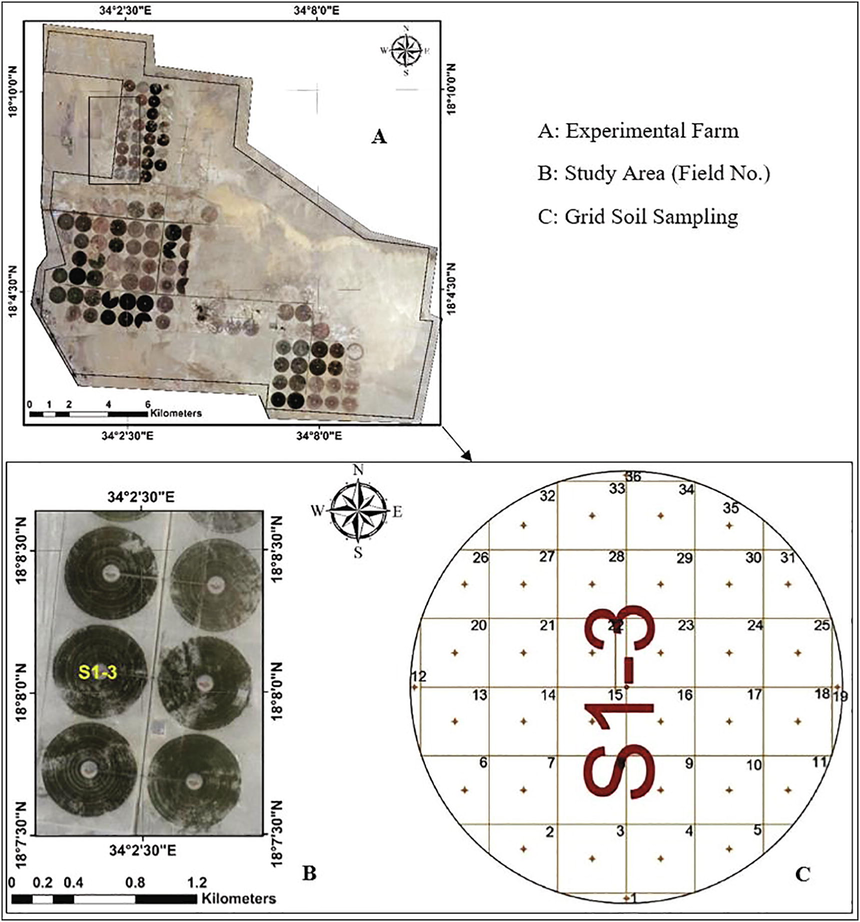
Location map of the experimental site.
2.2 Description of the equipment
Implementation of variable rate DAP fertilizer was achieved using an automatic control system developed by Ag Leader Technology (https://www.agleader.com). A New Holland tractor (140 hp, T7060 model) was used to pull a granular fertilizer spreader (brand Sulky, XT100 model) of 24 m spreading width. The variable rate fertilizer application system included: (a) RTK guidance system that provided the geographical position and speed of the spreader to the system with an accuracy of 2.5 cm, (b) variable-rate module and auto shut-off installed directly into the spreader, (c) 400 MHz RTK- GPS Base station for auto-correction of GPS signal to less than 2.5 cm and (d) AgFiniti for data exchange between the base station and machines in the central office.
The variable rate applicator was designed to primarily operate on the basis of a prescription GIS map (management map) prepared using soil and plant parameters, along with GPS coordinates and desired input rates. The GPS was used by the control system in the applicator to determine, in real time, the location of the applicator in the field, interrogate the GIS management map for the desired application rate at the current location and automatically change the application rate by changing the rotational speed of the conveyor belt of the spreader to apply the desired rate at the current spreader field location.
2.3 Soil parameters
Geo-referenced soil samples, from 36 locations across the experimental field, were collected from the top soil layer at a depth of 0–25 cm using an auto soil sampler (Model: Wintex 2000). The soil samples were collected using a systematic grid sampling approach with grids of 100 m × 100 m following the sampling strategy described by Franzen (2011). The collected soil samples were analyzed in the laboratory for soil phosphorus following the procedure reported by Estefan et al (2013).
2.4 Fertilizer type
The granular fertilizer used in this study was the diammonium phosphate (DAP), which was the only source of phosphorus element that was commonly used in the study farm. Therefore, variable rates of DAP fertilizers were applied based on soil phosphorus content; where, soil nitrogen in the experimental field was found almost homogeneous (ranging from 0.15% to 0.20%). The studied DAP fertilizer rates (120 and 160 kg ha−1) and the conventional rate practiced in the farm (200 kg ha−1) were added at the sowing stage of the wheat crop, based on the prescription map prepared on the basis of the soil phosphorus variations. Mixing the phosphate fertilizer with wheat seed at the time of planting enhances the P element availability in soil, thus increases the total dry matter and grain production, even in soils with medium to high levels of available P (Alessi and Power, 1980).
2.5 Prescription map
Georeferenced grid data points (grid size of 2 m × 2 m) were interpolated and mapped by using geostatistical procedures (i.e. kriging) available in ArcGIS software program (ver. 10.7.1). Based on soil phosphorus concentrations data from the 36 data points, a prescription management map of the study field was developed using the ArcGIS software. The developed prescription map was divided into three equal interval classes based on soil phosphorus content in the experimental field (low: 3.75 to 4.50 ppm, medium: 4.51 to 5.25 ppm and high: 5.26 to 6.00 ppm). Management zones were delineated in the management map based on the soil phosphorus classes (categories).
2.6 Statistical analysis
Split plot design analysis was employed with the three soil phosphorus levels as the main treatments and the three DAP fertilizer application rates as the sub-treatments with three replicates. The ANOVA (analysis of variance) procedure, within the Statistical Analysis System (SAS for Windows v. 9.4), was used to determine the interaction effects of the management zones and the DAP application rates on the yield of wheat crop.
2.7 Wheat growth
Wheat growth status was monitored using the Normalized Difference Vegetation Index (NDVI) extracted from periodic sets of Sentinel-2 satellite images (10 m × 10 m pixel size). The NDVI, as an indicator of crop growth performance, was calculated using Equation (1) (Rouse et al., 1974). Four Sentinel -2 satellite images were downloaded at different growth stages of the wheat crop (tillering stage, stem elongation, grain filling and maturity stages). NDVI was selected as an indicator of crop growth performance because it was efficient in crop analysis for crops with unclear flowers and simply “green-up” and then “green-down” after entering the reproductive growth stages, such as wheat and maize (Vallentin et al., 2021). In addition, Ren et al. (2008) reported a considerable linear correlation between spatial accumulation of NDVI and wheat yield at different growth stages with R2 values ranging between 0.61 and 0.86.
2.8 Wheat yield
The wheat crop of the experimental field (S1-3) was harvested on March 24th, 2019 (134 days after sowing) using a New Holland combine harvester (TC5.70 model). To estimate wheat yield, 81 wheat samples were randomly collected from the experimental field (3 samples × 3 phosphorus levels × 3 DAP rates × 3 replicates). The collected samples were weighed and converted into t ha−1. Subsequently, the collected yield data was used to generate wheat yield map for the experimental field.
3 Results and discussion
3.1 System accuracy
The static calibration of the variable rate applicator was carried out by measuring the density of the DAP fertilizer (kg m−3), adjusting the feed gate opening (cm) and weighing the actual output fertilizer (kg). The calibration results indicated that setting the gate opening at 2.0 cm, using a DAP fertilizer with a density of 984.1 kg m−3, produced a fertilizer flow rate of 4.12 kg rev-1. The response time of the spreader to change between two fertilizer application rates was determined in the field. Results revealed that the average response time and the signal lag time was ≤ 2.63 s.
3.2 Soil phosphorus
Analysis of soil samples showed significant spatial variations in phosphorus concentrations across the study field that ranged between 3.75 ppm and 6.00 ppm. Using the ArcGIS software program, concentrations of soil phosphorus for the 36 collected samples were tagged to the corresponding coordinates to generate a map of soil phosphorus spatial variability across the experimental field. The generated soil phosphorus map was classified into three zones, namely, (a) a low soil phosphorus zone (3.75 to 4.50 ppm) that occupied an area of 10.2 ha, (b) a medium soil phosphorus zone (4.51 to 5.25 ppm) that occupied an area of 14.7 ha, and (c) a high soil phosphorus zone (5.26 to 6.00 ppm) that occupied an area of 5.1 ha. The classified soil phosphorus map was used as a base for the experimental design utilized for the implementation of the proposed treatments of variable rate DAP fertilizer. Three DAP fertilizer rates (120, 160 and 200 kg ha−1) were applied on the experimental field. Soil phosphorus levels and layout of the applied variable DAP fertilizer rates are shown in Fig. 2.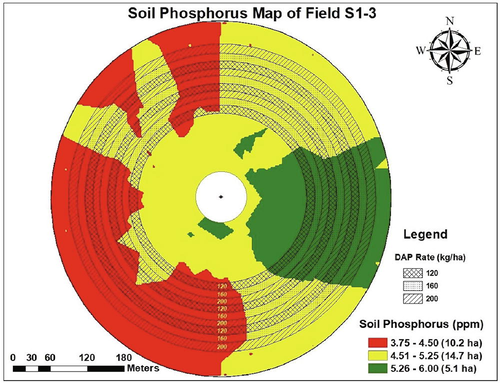
Soil phosphorus zones and variable DAP fertilizer rates in the study field.
3.3 Wheat growth performance
3.3.1 NDVI measured at 50 days after sowing
Table 1 summarized the NDVI values calculated from Sentinel-2 satellite data at a crop age of 50 days (tillering stage). At this stage, a maximum NDVI value of 0.345 was recorded under medium phosphorus and high DAP fertilizer application rate (200 kg ha−1). On the other hand, the minimum NDVI value of 0.333 was recorded for the low DAP fertilizer application rate (120 kg ha−1) in the low and the medium phosphorus zones. The difference between the maximum and minimum recorded NDVI values was 0.012 (not significant). The ANOVA results showed no significant differences in the NDVI values at this stage of wheat growth (at age of 50 days) resulted neither from different DAP application rates nor due to different soil phosphorus concentrations. This may be due to the balance between the availability of DAP fertilizer in the soil and the small needs of wheat in the early stage, which made the NDVI values seem to be homogeneous. The same has been reported by Khan et al. (2010), where plants at the first stage depended mainly on their seed reserves, with little effect from external supply on plant growth.
Phosphorus zone
DAP fertilizer rate
Mean
120
160
200
Low
0.333
0.336
0.337
0.335
Medium
0.333
0.340
0.345
0.339
High
0.338
0.340
0.344
0.341
Mean
0.335
0.339
0.342
0.339
Statistical Analysis
P > F
LSD0.05
Phosphorus (P)
0.310
NS
Fertilizer Rate (F)
0.157
NS
F at same P
0.926
NS
3.3.2 NDVI measured at 75 days after sowing
Table 2 summarizes the recorded NDVI values at 75 days after wheat sowing (stem elongation stage). A maximum mean NDVI value of 0.487 recorded under high soil phosphorus zone was significantly higher than that under both the medium (0.465) and low (0.453) soil phosphorus zones. However, there was no significant differences in the NDVI values between low and medium soil phosphorus zones. The ANOVA results showed significant differences in the NDVI values as a result of variable DAP fertilizer rates. The highest mean NDVI value of 0.478 was recorded at a DAP fertilizer rate of 200 kg ha−1, which was not statistically significant compared to the medium DAP level of 160 kg ha−1 with a maximum NDVI value of 0.477. However, significant differences were recorded in the NDVI mean values between the low (120 kg ha−1) and medium (160 kg ha−1) DAP fertilizer application rates. An NDVI map at 75 days after wheat sowing was generated to illustrate the spatial variations in NDVI values within the experimental field (Fig. 3).
Phosphorus zone
DAP fertilizer rate
Mean
120
160
200
Low
0.428
0.459
0.472
0.453
Medium
0.461
0.475
0.459
0.465
High
0.460
0.497
0.504
0.487
Mean
0.449
0.477
0.478
0.468
Statistical Analysis
P > F
LSD0.05
Phosphorus (P)
0.008
0.017 S
Fertilizer Rate (F)
0.011
0.019 S
F at same P
0.260
NS
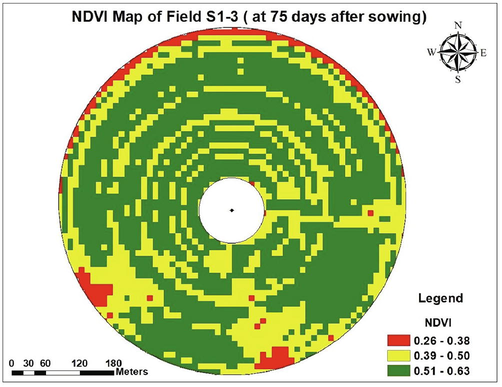
NDVI measured at 75 days after sowing.
3.3.3 NDVI measured at 95 days after wheat sowing
Table 3 summarizes the recorded NDVI values at 95 days after wheat sowing (grain filling stage). A maximum mean NDVI value of 0.420 was recorded in the high soil phosphorus zone, which was significantly higher than that in both, the low (0.305) and medium (0.314) soil phosphorus zones. However, no significant differences were observed in the NDVI between the low and medium soil phosphorus zones. Also, the results showed significant differences in the NDVI values resulted from the applied variable DAP application rates. The highest mean NDVI value of 0.372 was recorded at the medium DAP fertilizer application rate of 160 kg ha−1, which was significantly different compared to the value at the low DAP fertilizer application rate of 120 kg ha−1 (0.3134). However, there was no significant differences in the NDVI values between the medium (160 kg ha−1) and the high (200 kg ha−1) DAP fertilizer application rates.
Phosphorus zone
DAP fertilizer rate
Mean
120
160
200
Low
0.295
0.306
0.315
0.305
Medium
0.301
0.313
0.327
0.314
High
0.345
0.498
0.419
0.420
Mean
0.313
0.372
0.354
0.346
Statistical Analysis
P > F
LSD0.05
Phosphorus (P)
<0.0001
0.017 S
Fertilizer Rate (F)
0.0035
0.030 S
F at same P
0.0071
0.052 S
3.3.4 NDVI at 125 days after wheat sowing
Table 4 summarizes the recorded NDVI values at 125 days after wheat sowing (maturity stage). A maximum mean NDVI value of 0.140 was recorded in the high soil phosphorus zone, which was significantly higher than that in the low (0.128) and in the medium (0.131) soil phosphorus zones. Results also showed significant differences in NDVI values resulted from variable DAP application rates. The highest mean NDVI value of 0.135 was recorded for the high fertilizer application rate of 200 kg ha−1, which was not statistically significant compared to that of the medium application rate of 160 kg ha−1 (0.134). However, there was a significant difference in the mean values of NDVI between the low (120 kg ha−1) and the high (200 kg ha−1) application rates.
Phosphorus zone
DAP fertilizer rate
Mean
120
160
200
Low
0.126
0.128
0.131
0.128
Medium
0.129
0.131
0.132
0.131
High
0.138
0.141
0.142
0.140
Mean
0.131
0.134
0.135
0.133
Statistical Analysis
P > F
LSD0.05
Phosphorus (P)
<0.0001
0.0014 S
Fertilizer Rate (F)
0.0002
0.0014 S
F at same P
0.4634
NS
3.4 Wheat yield
Wheat yield (t ha−1) of the experimental study field was determined for the different soil phosphorus zones and variable DAP fertilizer application rates (Fig. 4) and evaluated using the statistical analysis presented in Table 5. Results revealed significant differences in wheat yield as a result of soil phosphorus levels and variable DAP fertilizer application rates. Optimum wheat yield was observed at high soil phosphorus level with a mean value of 2.541 t ha−1, which was statistically significant compared to that under low soil phosphorus zone (2.332 t ha−1). However, no significant differences were observed in wheat yield between the high (2.541 t ha−1) and the medium (2.425 t ha−1) phosphorus zones. Wheat yield results under variable DAP fertilizer application rates showed that the highest yield was recorded at the high DAP fertilizer application rate (200 kg ha−1) with a mean value of 2.449 t ha−1, followed by that at the medium application rate (160 kg ha−1) of 2.441 t ha−1, with no significant differences between them. Significant differences were observed between wheat yields under the low (2.407 t ha−1) and the high (2.449 t ha−1) fertilizer application rates. The results were at the same trend of the NDVI values of wheat at the tilliering, stem elongation and maturity stages.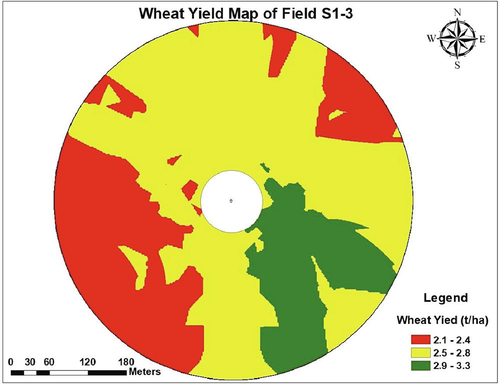
Wheat yield map of the experimental field.
Phosphorus Level
DAP Rate (kg ha−1)
Mean
120
160
200
Low
2.290
2.337
2.369
2.332
Medium
2.418
2.427
2.430
2.425
High
2.514
2.560
2.549
2.541
Mean
2.407
2.441
2.449
2.433
Statistical Analysis
P > F
LSD0.05
Phosphorus level (P)
0.0001
0.1249
DAP rate (F)
0.0457
0.0329
These results are in agreement with the findings of Sultana et al. (2014) at the maturity stage. As illustrated in Table 5, the highest wheat yield (2.560 t ha−1) was recorded at the medium application rate in the medium soil phosphorus zone. Therefore, adding more DAP fertilizer would not be useful in improving wheat yield because only 20 to 30% of phosphorus fertilizers was effectively used by crops, while the remaining would leach down to groundwater, or get fixed within the soil (Rowse and Stone, 1981).
Results of this study was in agreement with the findings reported by Rowse and Stone (1981), where the highest yield in the low soil phosphorus zone was recorded at the high DAP fertilizer application rate; however, the highest yield in the high soil phosphorus zone was obtained at the medium DAP fertilizer application rate. However, the application of uniform DAP fertilizer rates practiced in the study area would not improve the yield of wheat crop, but would only increase the cost of production.
Based on the results of this study, wheat yield wasn’t significantly improved, but the decrease in the amount of DAP fertilizer, without affecting the yield, led to reduction in the total cost. Moreover, reduction in DAP would reduce the negative impacts on the environment by applying only the required fertilizer rates on each zone of the field. Excessive use of fertilization causes the accumulation of heavy metals in the soil and plants, which leads to pollution of water, soil and air (Savci, 2012). This considered as one of the advantages of variable rate technology that can provide farmers with a better understanding of soil fertility variables within the field to optimize fertilizer application rates; thus, reducing the negative effects of excessive application, such as environment degradation, crop damage and yield losses (Azhagesan and Ravikumar, 2016). Results of this study can be extended to develop reasonably fast and accurate models for predicting crop yields using machine learning or deep learning techniques, such as that described by Mudunuru et al. (2021).
3.5 Economic feasibility of variable rate application of DAP fertilizer
As indicated in Table 6, the economic feasibility of variable rate application was studied based on the results of statistical analysis. The analysis showed that there were no significant differences in wheat yield between the DAP fertilizer rates of 160 and 200 kg ha−1 in high and medium phosphorus zones. Therefore, the DAP fertilizer rate of 160 kg ha−1 was considered as the optimum rate for wheat production in the high and medium phosphorus zones of the study area. However, the DAP fertilizer of 200 kg ha−1, which was significant with other rates, was considered as the optimum rate for the low soil phosphorus zones. The total DAP amount for the conventional rate (200 kg/ha), practiced in the study area, for the total area of the experimental field (30 ha) was 6000 kg, at a cost of 3600 $. Likewise, the total amount DAP fertilizer for the rate of 160 kg ha−1 in the medium and high phosphorus areas (19.8 ha) was 3168 kg, at a cost of 1900.8 $. Also, the total DAP amount for the rate of 200 kg ha−1 in the low soil phosphorus zone (10.2 ha) was 2040 kg, at a cost of 1224 $. The total amount of 6000 kg of DAP fertilizer was required for the uniform application rate in the experimental field compared to 5208 kg when practicing variable rate application. This results in savings of 792 kg of DAP fertilizer at a cost of 475.2 $ for the experimental 30 ha field (i.e. 15.84 $ ha−1). *1.0 kg DAP = 0.60 $ (https://www.indexmundi.com/commodities/?commodity=dap-fertilizer&months=60).
Amount/Cost of DAP fertilizer
Variable rates
Uniform Rate (200 kg ha−1)
Soil Phosphorus Zones
Area (ha)
DAP Rate (kg ha−1)
Amount (kg)
Cost* ($)
Amount (kg)
Cost* ($)
Savings in DAP (kg)
Savings in DAP ($)
Low
10.2
200
2040
1224
2040
1224
Medium
14.7
160
2352
1411.2
2940
1764
High
5.1
160
816
489.6
1020
612
Total
30
5208
3124.8
6000
3600
792
475.2
4 Conclusions
A field study was conducted to evaluate the feasibility of applying variable DAP fertilizer rates to wheat crop, under a solar energy powered center pivot irrigation system, based on soil phosphorus levels in the experimental field. The specific conclusions of this study could be summarized as follows:
-
There were no significant differences in the NDVI values between the studied soil phosphorus levels and variable DAP fertilizer application rates at the crop tillering stage.
-
Results showed high significant differences in the wheat yield (P > F = 0.0001) and variable application rates. However, low significant differences (P > F = 0.0457) were observed between the soil phosphorus levels and the different fertilizer application rates.
-
High DAP fertilizer application rate of 200 kg ha−1 was found to be optimum for the areas of low soil phosphorus level. However, the low application rate of 160 kg ha−1 was found to be the optimum for the areas of high and medium soil phosphorus levels.
-
Savings in the DAP fertilizer of 792 kg can be achieved by applying the medium DAP fertilizer rate to the medium and high soil phosphorus zones, resulting in equivalent savings of 475.2 $ for the 30 ha experimental field (i.e. 15.84 $ ha−1).
Authors’ contributions
Ahmed M. Zeyada: the conception and design of the study, acquisition of data, analysis and interpretation of data, drafting the article, final approval of the version to be submitted.
Khalid A. Al-Gaadi: the conception and design of the study, revising the article critically for important intellectual content, final approval of the version to be submitted.
ElKamil Tola: the conception and design of the study, revising the article critically for important intellectual content, final approval of the version to be submitted.
Ali S. Amrir: the conception and design of the study, acquisition of data, analysis and interpretation of data, final approval of the version to be submitted.
Rangaswamy Madugundu: analysis and interpretation of data, revising the article critically for important intellectual content, final approval of the version to be submitted.
Samy A. Marey: analysis and interpretation of data, revising the article critically for important intellectual content, final approval of the version to be submitted.
Ahmed A. Alameen: acquisition of data, analysis and interpretation of data, final approval of the version to be submitted.
Acknowledgements
The authors are grateful to the Deanship of Scientific Research, King Saud University for funding this study through the Vice Deanship of Scientific Research Chairs. The unlimited cooperation and support extended by Al Rajhi International for Investment (RAII) in carrying out the research work are gratefully acknowledged.
Declaration of Competing Interest
The authors declare that they have no known competing financial interests or personal relationships that could have appeared to influence the work reported in this paper.
References
- In-Season assessment of wheat crop health using vegetation indices based on ground measured hyper spectral data. Am. J. Agri. Biol. Sci.. 2014;9(2):138-146.
- [Google Scholar]
- Effects of banded and residual fertilizer phosphorus on dryland spring wheat yield in the northern plain. J. Soil Sci. Soc. Am.. 1980;44:792-796.
- [Google Scholar]
- Canopy Reflectance Indices: A New Tool for Assessing Durum Wheat LAI and Yield. Durum Wheat Improvement in the Mediterranean Region: New Challenges. Zaragoza: CIHEAM; 2000. p. :117-119.
- A study on precision farming technologies and adoption in Tamil Nadu. Int. J. Manage. Res. Rev.. 2016;6(8):1123-1131.
- [Google Scholar]
- A generalized regression-based model for forecasting winter wheat yields in Kansas and Ukraine using MODIS data. Remote Sensing Environ.. 2010;114(6):1312-1323.
- [Google Scholar]
- Digital map-based site-specific granular fertilizer application system. Res. Commun., Curr. Sci.. 2016;111(7):1208-1213.
- [Google Scholar]
- Autonomous precision agriculture through integration of wireless underground sensor networks with center pivot irrigation systems. Ad Hoc Netw.. 2012;11(7):1975-1987.
- [Google Scholar]
- Precision nitrogen management of wheat. A review. Agronomy Sustain. Develop.. 2013;33:219-241.
- [Google Scholar]
- Study on trade-offs between spatial resolution and temporal sampling density for wheat yield estimation using both thermal and calendar time. Int. J. Appl. Earth Obs. Geoinf.. 2020;86
- [Google Scholar]
- Methods of Soil, Plant and Water Analysis: Laboratory Manuals (3rd ed.). International Center for Agricultural Research in the Dry Areas (ICARDA); 2013. p. :100-105.
- An approach for precision farming under pivot irrigation system using remote sensing and GIS techniques. Agric. Water Manag.. 2011;98(4):517-531.
- [Google Scholar]
- Comparative performance of wheat on response to nitrogenous and phosphatic fertilizers grown on third terrace of Northern State, Sudan. Sudan J. Desertification Res.. 2018;10(1):62-74.
- [Google Scholar]
- Franzen, D.W. Collecting and Analyzing Soil Spatial Information Using Kriging and Inverse Distance. “Chapter 4” in GIS Applications in Agriculture: David, EC, John FS, editors. CRC Press; 2011:61–80.
- Measuring and predicting canopy nitrogen nutrition in wheat using a spectral index-the canopy chlorophyll content index (CCCI) Field Crop Res.. 2010;116(3):318-324.
- [Google Scholar]
- Precision farming - The emerging concept of agriculture for today and tomorrow. Curr. Sci.. 2000;79(12):1644-1647.
- [Google Scholar]
- Effects of phosphorus fertilizer and application methods on the yield of wheat grown under dryland conditions. Turk. J. Agric. For.. 1999;23:393-399.
- [Google Scholar]
- Effect of different phosphatic fertilizers on growth attributes of wheat (Triticum aestivum L.) J. Am. Sci.. 2010;6(12):1256-1262.
- [Google Scholar]
- Mutar, H.M., Musleh, M.H. Effect of DAP fertilizer on yield and components of soft wheat cultivars effect of DAP fertilizer on yield and components of soft wheat cultivars. J. Phys. Conf. Series. 2020. (DOI:10.1088/1742-6596/1664/1/012108).
- Twenty five years of remote sensing in precision agriculture: key advances and remaining knowledge gaps. J. Biosystems Eng.. 2013;114:358-371.
- [Google Scholar]
- Optimizing the method and source of phosphatic nutrition for wheat (Triticum astivum L.) under agro-climate of Gera Ghazi Khan, Pakistan. Pakistan J. Nutr.. 2012;11(9):885-890.
- [Google Scholar]
- Mudunuru, M.K., Son, K., Jiang, P., Chen, X. SWAT Watershed Model Calibration using Deep Learning. arXiv:2110.03097v1 [cs.LG]. 2021. (https://arxiv.org/pdf/2110.03097.pdf).
- Light-weight multispectral UAV sensors and their capabilities for predicting grain yield and detecting plant diseases. In: Proceedings of the ISPRS-International Archives of the Photogrammetry, Remote Sensing and Spatial Information Sciences. 2016. p. :963-970. Prague, Czech Republic
- [Google Scholar]
- Development and testing of tractor operated variable depth fertilizer applicator on application of granular urea in wheat crop planted on beds. Int. J. Chem. Stud.. 2020;8(5):989-996.
- [Google Scholar]
- Rowse, H.R., Stone, D.A. Deep cultivation of a sandy loam. Effects on growth, yield and nutrient content of potatoes, broad beans, summer cabbage and red beet. Soil Tillage Res. 1981; (1):57–68.
- Regional yield estimation for winter wheat with MODIS-NDVI data in Shandong, China. Int. J. Appl. Earth Obs. Geoinf.. 2008;10(4):403-413.
- [Google Scholar]
- Rouse, J.W., Haas, R.H., Schell, J.A., Deering DW. Monitoring vegetation systems in the great plains with erts. Proceedings of the Third Earth Resources Technology Satellite-1 Symposium, NASA Spec. 1974;(1).
- Normalized difference vegetation index as a tool for wheat yield estimation: a case study from Faisalabad. Pakistan. Sci. World J.. 2014;13
- [CrossRef] [Google Scholar]
- Investigation of effect of chemical fertilizers on environment. APCBEE Proc., ICESD, Hong Kong.. 2012;1:287-292.
- [Google Scholar]
- Suitability of satellite remote sensing data for yield estimation in northeast Germany. Int. J. Adv. Precision Agri. 2021
- [CrossRef] [Google Scholar]
- Relations between NDVI and tree productivity in the central Great Plains. Int. J. Remote Sens.. 2004;25(16):3127-3138.
- [Google Scholar]
- Comparison of uniform and variable rate nitrogen and phosphorus fertilizer application for grain sorghum. Trans. ASAE, Am. Soc. Agri. Eng.. 2001;44(2):201-209.
- [Google Scholar]


