

Translate this page into:
Haplotype diversity of palm weevil in Saudi Arabia through ITS gene sequencing
⁎Corresponding author. Ma.alshehri@ut.edu.sa (Mohammed Ali Alshehri)
-
Received: ,
Accepted: ,
This article was originally published by Elsevier and was migrated to Scientific Scholar after the change of Publisher.
Peer review under responsibility of King Saud University.
Abstract
The red palm weevil, Rhynchophorus ferrugineus (Olivier 1790) caused a high economic loos in date palm in gulf region especially in Saudi Arabia. Previous estimations of palm weevil haplotype diversity in Saudi Arabia was not satisfactory because of choice of marker and small sampling area. Assessing haplotype diversity using COI gene was found ineffective. The present study was carried out to estimate the haplotypes of R. ferrugineus using internal transcribed spacer (ITS) sequences. Results showed 3 haplo-groups, among which, the haplotype UT9 was a singleton haplotype. The haplotypes UT16, UT2, UT6 UT10, UT14 and UT5 formed the second haplo-group whereas the remaining haplotypes were clustered as third group. K2P distance varied between 0 and 0.06 among the sequenced haplotypes and the maximum distance was recorded between two sets of haplotypes; viz; UT4 and UT3, UT4 and UT8. The overall distance of all the sequenced haplotypes were 0.02. Tajima’s neutrality value was < 0 indicating the potentiality for further haplotype diversification. Median joining haplotype network diagram reveals the presence of 10 haplotypes and most mutations were at 244th and 381st nucleotide positions. Overall, total number of mutations leading to the evolution of the documented 10 haplotypes was 34. Through genetic data, we have provided a strong evidence that there were multiple haplotypes of R. ferrugineus which were bound to expand its diversity. Higher nucleotide diversity and Tajima’s neutrality test values suggest that there were higher movement of infested palm trees, as desserts were natural barriers for movement of H. ferrugineus. The findings of this study will be useful for pest controlling agencies and to the workers involved in infested date palm quarantining.
Keywords
Palm weevil
ITS
Haplotype network
Genetic diversity

1 Introduction
The red palm weevil, Rhynchophorus ferrugineus (Olivier 1790) (Family: Curculionidae) is native to Southeast Asia and Melanesia. Larvae of R. ferrugineus were known to destroy palm trees worldwide since its accidental introduction into USA, Caribbean, Mediterranean basin and Middle East (Rugman-Jones et al., 2013a; Rugman-Jones et al., 2013b; Rugman-Jones et al., 2013c). R. ferrugineus has pheromone receptors RferOR1 that are responsible for long-range orientation towards palm trees, according to a recent study (Antony et al., 2021). More than 16 genera and 26 various palm tree species were attacked by R. ferrugineus and hence been classified in A2 list as per European and Mediterranean Plant Protection Organization (EPPO, 2002). For example, Arabian gulf alone losses US$ 25.92 million during 2009 alone in data palm (Phoenix dactylifera) production, which is 30% of world's annual date palm production (El-Sabea et al., 2009). Over 25 million Saudi Arabian date palms were at risk during 2010 (Ministry of Agriculture, 2010). Usually, disease when detected is beyond remediation as infestation symptoms were visible only after severe damage of the palm tree. Hence early detection of larvae could be useful to stop the migration of the larvae to heart of the date palm vascular system to initiate infestation (Giblin-Davis, 2001). Many studies are focusing on using advanced technology to detect R. ferrugineus larvae sooner (Mao et al., 2021; Kurdi et al., 2021; Wang et al., 2021).
Identifying an organism based on a standardised gene sequences is called DNA barcoding and the gene used is commonly referred as a barcode gene (Hebert et al., 2004; Joly et al., 2014; Kress et al., 2015). DNA barcoding will allow easy and precise identification of R. ferrugineus and its early larval stages, as DNA barcodes from adult specimens have widely proven to be useful in identifying its early larval stages (Alcántar-Escalera et al., 2013; Khan et al., 2014; Steinke et al., 2016; Chu et al., 2019).
Previous estimations of palm weevil haplotype diversity in Saudi Arabia (Al-Ayied et al., 2006; Sadder et al., 2015a; Sadder et al., 2015b) revealed small diversity values reciprocating small sampling sizes. Recently, Sukirno et al. (2020a), Sukirno et al. (2020b) sequenced 297 palm weevil for COI genes sampling from 308 date palm plantations distributed in nine regions of Saudi Arabia and found 221 haplotypes grouped into 3 groups. When assessing haplotype diversity, COI were consider inferior as only few haplotypes were reported from previous studies (El-Mergawy et al., 2011a; El-Mergawy et al., 2011b; Rugman-Jones et al., 2013a; Rugman-Jones et al., 2013b; Rugman-Jones et al., 2013c). The present study aims to estimate the haplotypes of R. ferrugineus from different regions of Saudi Arabia using internal transcribed spacer (ITS) gene sequences.
2 Materials and methods
2.1 Sample collection and preservation
Twenty samples of palm weevil, R.ferrugineus were collected across Saudi Arabia between June to October 2018. Sampling was done across multiple cities in 10 provinces of Saudi Arabia viz., Medina, Tabuk, Hail, Riyadh, Al-Qassim Region, Aljobail, Almoterfy in Al-Ahsa'a, Al-Shoiba, Al Aqiq and Bisha (Fig. 1). The exact geographical locations of individual samples with its corresponding geographical co-ordinates are given in Table 1. Adults of R. ferrugineus were hand picked from infested date palm plantations (P. dactylifera L.) and preserved directly into 70% ethanol (Scharlau, Barcelona) contained in 50 mL conical tubes. Coloured ethanol due to pigment diffusion was replaced with fresh 70% ethanol once reached the laboratory. Samples were kept at 4 °C until DNA extraction.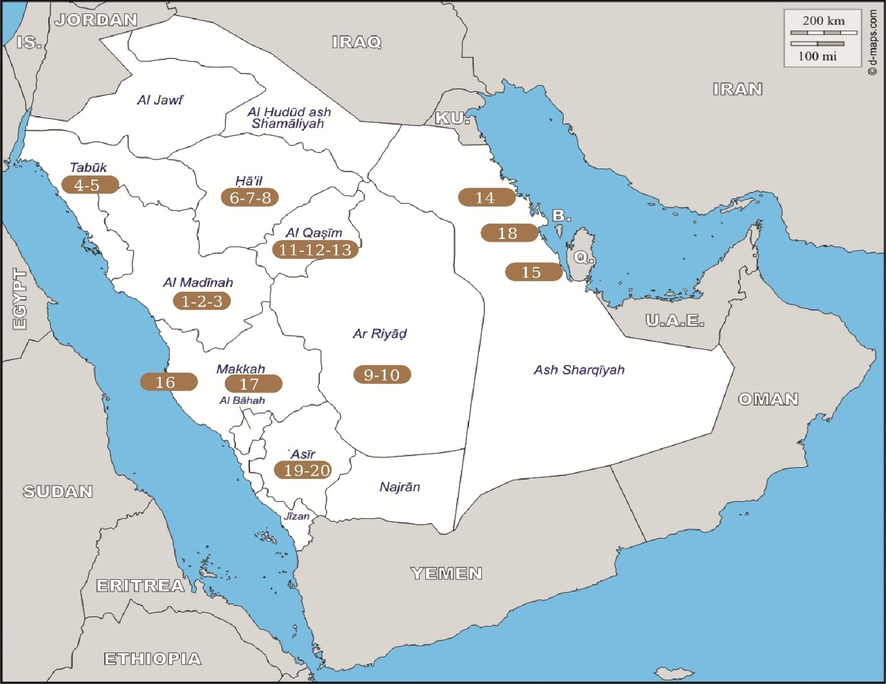
Map reveals sample collection sites across Saudi Arabia. The color integers represents sample number and the position of the integer indicate the approximate area of the respective collected samples. Total of 20 samples were collected from 20 different study area.
S.No
Collection area
Latitude (North)
Longitude (East)
1
Medina
24.60
39.46
2
Medina
24.57
39.60
3
Medina (Alula)
26.62
37.92
4
Tabuk (Al Amir Fahd Ibn Sultan Rd ) (Madinah Rd)
28.38
36.55
5
Tabuk (King Khalid Rd) (Amman Road)
28.39
36.56
6
Hail (Eastern Alkhitah)
27.98
41.80
7
Hail (al- Qaid)
27.88
41.70
8
Hail (Western Alkhitah)
27.95
41.66
9
Riyadh (Alhaeer)
24.41
46.85
10
Riyadh (Aloiayenah)
24.47
46.85
11
Al-Qassim Region (Riyadh Al Khabra)
26.06
43.56
12
Al-Qassim Region(Slaam)
25.66
43.80
13
Al-Qassim Region (Al Bukayrīyah)
26.17
41.13
14
Aljobail (Eastern Region)
27.08
49.54
15
Almoterfy in Al-Ahsa'a (Eastern Region)
25.29
49.48
16
Al-Shoiba (Makkah Region)
21.40
39.78
17
Al Aqiq (Makkah Region) in Taif city
21.53
39.79
18
Saqefah in Khobar (Eastern Region)
24.47
39.60
19
Bisha (Asir Region)
20.03
42.62
20
Bishaaleubla (Asir Region)
19.96
42.59
2.2 DNA isolation and PCR
For DNA isolation, approximately 3 mm2 pronotal muscle was exercised from the preserved specimen using sterilized fine forceps and placed inside 200 µl PCR tubes. Ethanol in the tissues were evaporated either in room temperature or by placing the tubes in concentrator plus (Eppendrof, AG) at 45 °C for 10 min. DNA extraction and purification was carried out using the manufacture’s protocol of DNeasy blood and tissue DNA isolation Kit (Qiagen, USA) excerpt only one by tenth of actual volume of the reagents given were used. The final elution was done in 50 µl elution buffer. The eluted DNA was rinsed trice and repeatedly eluted from the binding column to increase the DNA concentration. The isolation of DNA was confirmed by running 2 µl of elutant in 1.5% agarose gel along with Lamda DNA (Takara Bio) as standard.
During polymerase chain reaction (PCR), internal transcribed spacer (ITS) gene region was amplified using the primer pair; ITS-F: 5′-ATATGCTTAAATTCAGCGGG-3′ and ITS-R: 5′-GGGTCGATGAAGAACGCAGC-3′ (Navajas et al., 1998). 50 µl PCR mixture consisted of 1x PCR buffer (Promega), 15 mM MgCl2, 0.2 mM dNTPs, 20 pM of each primers, 1u of Taq DNA polymerase (GoTaq, Promega), 40 ng DNA and ultra-pure water to a final volume of 50 µl. PCR condition was done with an initial denaturation for 5 min at 94 °C. The, 40 cycles consisted of a denaturation step at 94 °C for 30 sec., an annealing step at 50 °C for 30 sec. and an elongation step at 72 °C for 30 sec. The final extension step was for 7 min at 72 °C. The PCR amplicons were resolved by 1.5% agarose gel electrophoresis with ethidium bromide (0.5ug/ml) in 1X TBE buffer powered at 95 V for 30 min. A 100 bp DNA ladder (Thermo Fisher Scientific) was used as a standard to detect and assess the size of the amplicon. PCR products were visualized under UV light and photographed using a Gel Documentation System (BIO-RAD 2000). The PCR products were purified using QIAquick PCR purification kit (Qiagen, USA).
2.3 Sequencing and analysis
Sequencing was performed in ABI PRISM 3730XL Analyzer (Macrogen, South Korea) using Big Dye TM Terminator Cycle Sequencing kit following manufacture’s instruction. Two way sequencing was performed and the chromatograms were compiled using BioEdit ver. 7.2 (Hall, 1999). Chromas Pro ver. 2.6.6 was used to double check the quality of the sequence chromatograms before compiling. Primer sequences were trimmed off from the final sequences. The sequences were aligned in Clustal X ver. 2.0.6 (Thompson et al., 1997) and the alignment was submitted to GenBank. Sequences could be accessed through GenBank accession numbers: MW575619-MW575638. Kimura-2 parametric distance analysis (Kimura, 1980) was conducted in Molecular Evolutionary Genetic analysis (MEGA) ver. X (Kumar et al., 2018).We calculated Tajima’s Neutrality Test (Tajima, 1989) using segregation and nucleotide data using following equations; m = number of sequences, n = total number of sites, S = Number of segregating sites, ps = S/N, Θ = ps/a1, π = nucleotide diversity, and D is the Tajima’s test statistic. Tajima’s test values reveals the difference between the number of segregation nucleotide sites and the average of pair-wise differences. The analysis was conducted in MEGA ver. X.
DNA sequences were compared with GenBank reference sequences through Basic local alignment search tool (BLAST) (Altschul et al., 1990) using default parameters for searching the entire nucleotide collection using the conditions optimized for highly similar sequences. First five reference sequences of closest match to the query sequences of the present study were extracted and the repeated sequences were removed before being used for the phylogenetic tree construction. Neighbor-Joining tree (Saitou and Nei, 1987) was drawn using Molecular Evolutionary Phylogenetic Analysis software version 10.1.7 (Kumar et al., 2018) to infer the phylogenetic relationship among the sequenced haplotypes.The evolutionary distances were computed using the Kimura 2-parameter method (Kimura et al., 1980). The percentage of replicate trees in which the associated taxa clustered together was calculated using the bootstrap test (100 replicates) (Felsenstein, 1985).Interactive Tree Of Life (iTOL) (Letunic and Bork, 2019) ( https://itol.embl.de/) was used for the better representation of constructed phylogenetic tree.
Median joining haplotype network diagram was drawn using Network ver 10.2. ( https://www.fluxus-engineering.com/sharenet.htm), developed by Fluxus Technology Ltd. Aligned DNA sequences in FASTA format was converted into RDF (Resource Description Framework) format using FAS to RDF convertor tool ( http://fas2rdf.herokuapp.com/) and output file is used as input data to draw the network diagram.
3 Results
3.1 Sequence identification
DNA was recovered from an ethanol-preserved specimen at a concentration of 5.34 ± 2.43 μg/μl. About 700 bp PCR amplicon was produced from all specimens. All sequences shared on average of 98.7% identity (96.06 to 100%) with the ITS sequences of R. ferrugineus in the GenBank (Table 1). While few sequences closely resembles the other ITS sequences previously sequenced from R. ferrugineus captured in Saudi Arabia (n = 4), many (n = 16) shared close identity with R. ferrugineus collected from Greece, India and Israel (Table 1). For better interpretation all haplotypes were named as UT (University of Tabuk) 1–20 and correlated with the corresponding Genbank accession numbers in the Table 2. N = numbers, seq. = sequence, sim. = similarity, acc. = accession, No. = number.
N
Seq. ID
GenBank acc. number
Sim. (%)
Ref. seq. acc. No.
Country
Reference
1
UT1
MW575619
98.77
JX292126
India
El-Mergawy et al., 2011a; El-Mergawy et al., 2011b
2
UT2
MW575620
99.38
KC954631
Saudi Arabia
Unpublished
3
UT3
MW575621
96.22
KM503122
Greece
Unpublished
4
UT4
MW575622
96.32
JX292126
India
El-Mergawy et al., 2011a; El-Mergawy et al., 2011b
5
UT5
MW575623
97.96
HM043673
Egypt
El-Mergawy et al., 2011a; El-Mergawy et al., 2011b
6
UT6
MW575624
98.99
HM043674
Egypt
El-Mergawy et al., 2011a; El-Mergawy et al., 2011b
7
UT7
MW575625
100
KF311695
Israel
Rugman-Jones et al., 2013a; Rugman-Jones et al., 2013b; Rugman-Jones et al., 2013c
8
UT8
MW575626
96.22
KC954638
Saudi Arabia
Unpublished
9
UT9
MW575627
99.13
KC954633
Saudi Arabia
Unpublished
10
UT10
MW575628
98.75
KC954632
Saudi Arabia
Unpublished
11
UT11
MW575629
96.06
KM503122
Greece
Unpublished
12
UT12
MW575630
97.82
KC954638
Saudi Arabia
Unpublished
13
UT13
MW575631
100
KF311695
Israel
Rugman-Jones et al., 2013a; Rugman-Jones et al., 2013b; Rugman-Jones et al., 2013c
14
UT14
MW575632
99.38
KC954638
Saudi Arabia
Unpublished
15
UT15
MW575633
100
KF311695
Israel
Rugman-Jones et al., 2013a; Rugman-Jones et al., 2013b; Rugman-Jones et al., 2013c
16
UT16
MW575634
98.90
KM503122
Greece
Unpublished
17
UT17
MW575635
100
KF311695
Israel
Rugman-Jones et al., 2013a; Rugman-Jones et al., 2013b; Rugman-Jones et al., 2013c
18
UT18
MW575636
100
KF311695
Israel
Rugman-Jones et al., 2013a; Rugman-Jones et al., 2013b; Rugman-Jones et al., 2013c
19
UT19
MW575637
100
KF311695
Israel
Rugman-Jones et al., 2013a; Rugman-Jones et al., 2013b; Rugman-Jones et al., 2013c
20
UT20
MW575638
100
KF311695
Israel
Rugman-Jones et al., 2013a; Rugman-Jones et al., 2013b; Rugman-Jones et al., 2013c
3.2 Haplo-groups and distance analysis
We identified three haplogroups based on the NJ tree analysis which were highlighted through 3 different colors (red, orange and blue) (Fig. 2). The haplotype UT9 was a singleton haplotype in the analysis. The haplotypes UT16, UT2, UT6 UT10, UT14 and UT5 formed the second haplo-group whereas the remaining haplotypes were clustered as third group at the lower end of the phylogenetic tree. Interestingly all reference sequences extracted from GenBank was classified within the third cluster of the Haplo-group. Lack of reference ITS sequences for first and second haplo-groups may be due their new origin and may be specific to Saudi Arabia. Also the members of third haplo-group such as UT13, UT14, UT15, UT17, UT18, UT19, and UT20 did not had even single nucleotide variation and were exactly identical.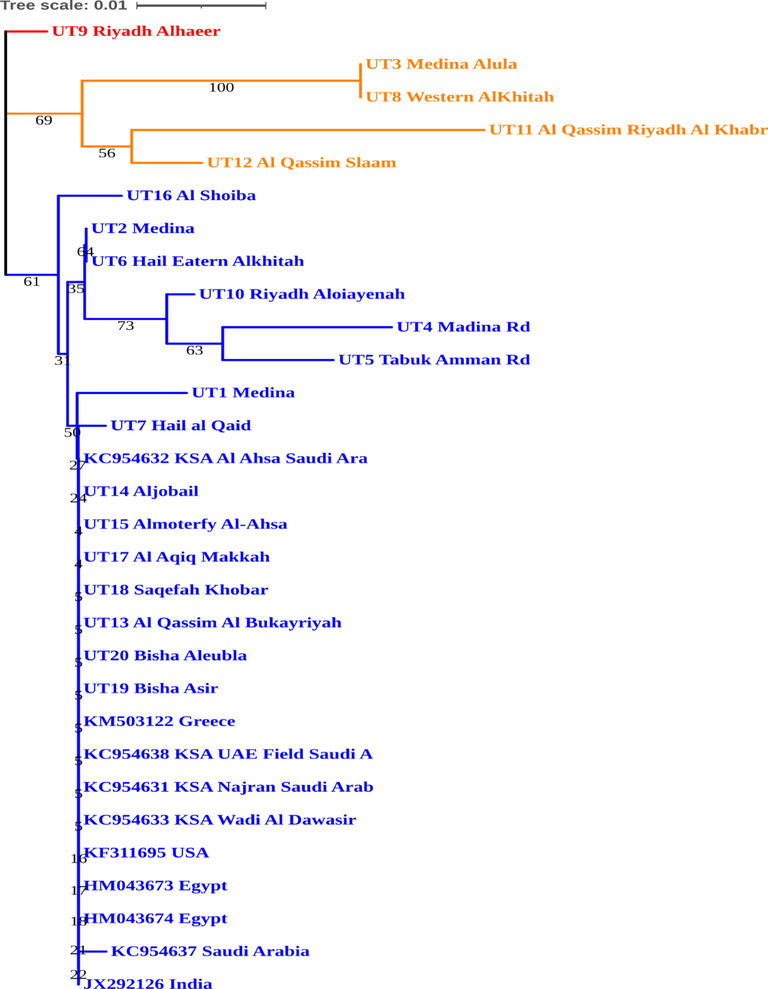
The phylogenetic tree constructed using Neighbor-Joining method for specimens under investigation.
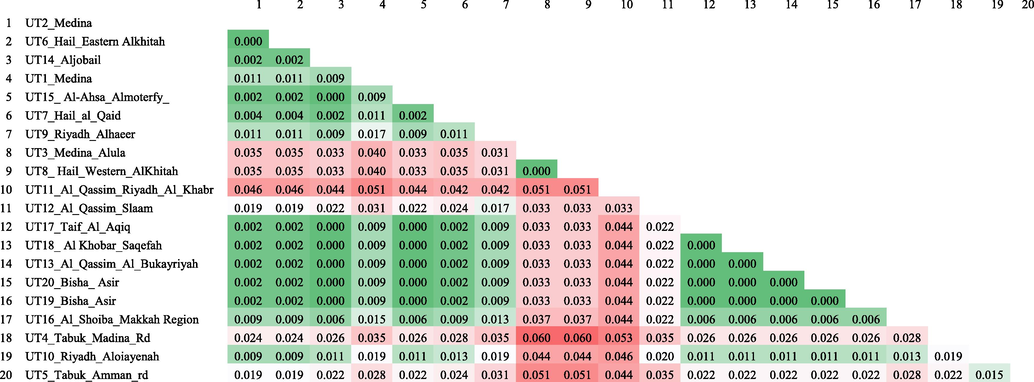
During K2P distance analysis, all nucleotide positions containing gaps and missing data in the alignment were eliminated and there were a total of 468 nucleotide positions in the final aligned dataset.K2P distance varied between 0 and 0.06 among the sequenced haplotypes (Table 3). Maximum distance was recorded between two sets of haplotypes; viz; UT4 and UT3, UT4 and UT8. The overall distance of all the sequenced haplotypes were 0.02.
The optimal tree with the sum of branch length = 0.12658351 is shown. The tree is drawn to scale, with branch lengths in the same units as those of the evolutionary distances used to infer the phylogenetic tree. The evolutionary distances were computed using the Kimura 2-parameter method and are in the units of the number of base substitutions per site. There were a total of 468 positions in the final dataset.
There were a total of 44 segregation sites with overall nucleotide diversity was 0.019 (Table 4). Tajima’s neutrality value was < 0 indicating population expansion in terms of haplotype diversity. n = total number of sites, S = Number of segregating sites, ps = S/N, Θ = ps/a1, π = nucleotide diversity, and D is the Tajima test statistic.
S
Ps
Θ
π
D
20
44
0.094
0.026
0.019
−1.111
3.3 Haplo-type network
Median joining haplotype network diagram reveals the presence of 10 haplotypes (Fig. 3). The haplotypes UT16, UT12, UT10, UT5, UT4 UT1, UT16 and UT11 are unique haplotypes represented by single members in this study. UT2 and UT3 bubbles in the network diagram also contains UT6 and UT8 haplotypes respectively. All remaining haplotypes were aggregated in UT15 bubble of the network diagram and forms the largest haplotype group (n = 9). There were a total of 7 median vectors connecting triplet of the different haplotypes. In the ITS sequences aligned, 244th position was found to be most frequently mutated (n = 6) position followed by 381st position (n = 4). Overall, total number of mutations leading to the evolution of these 10 haplotypes was 34.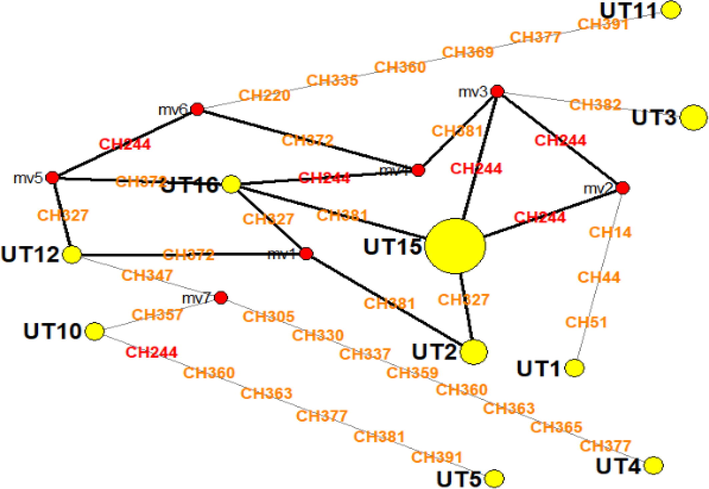
Median joining network diagram showing 10 haplotypes (yellow circles) of R. ferrugineus in this study. Majority consensus generated sequences was indicated by red points (median vectors; mv) which connects triplet of sequences. Mutations in the position of the characters were indicated CH and most frequent mutation (n = 6) was at CH244 position (indicated by red text). Size of the circle corresponds to the number of the haplotypes present.
4 Discussion
Agriculture ministry of Saudi Arabia has tried various measures to control R. ferrugineus and the economic losses incurred on behave.Though multiple pest managing procedures and pheromone-centric trapping protocols were used, R. ferrugineus continue to spread in Saudi Arabia and its surrounding countries. Studying genetic diversity based on the morphology of R. ferrugineus does not yield reliable estimates as environmental factors have profound influence on the morphology. Earlier studies using RAPD markers have shown the presence of 3 haplogroups of R. ferrugineus in Egypt (Salama and Saker, 2002), which is similar to the observation we made in this study using ITS gene sequences. Similarly another study estimating the haplotype diversity of H. ferrugineus acknowledges the presence of three haplogroups in UAE.
Even though mitochondrial cytochrome C oxidase subunit I gene (COI) is used to identify R. ferrugineus (Sukirno et al., 2020a; Sukirno et al., 2020b), the nuclear copies could lead to over estimation of taxonomic or haplotype diversity (Song et al., 2008). However earlier studies with COI have also concluded with the presence of 3 haplogroups (Sukirno et al., 2020a; Sukirno et al., 2020b). Also very few haplotypes (n = 1) were reported from previous studies using COI (El-Mergawy et al., 2011a; El-Mergawy et al., 2011b; Rugman-Jones et al., 2013a; Rugman-Jones et al., 2013b; Rugman-Jones et al., 2013c). However when sampling sizes were increased, increase in COI haplotypes were evidenced (Sukirno et al., 2020a; Sukirno et al., 2020b). A recent study that used a whole genome approach to decode R. ferrugineus haplotype variation identified new chemosensory and neuropeptide genes that could be targeted for pest control (Dias et al., 2021). We used ITS sequences which were proven for precise estimation of molecular diversity of R. ferrugineus (Sadder et al., 2015a; Sadder et al., 2015b). Like the previous studies (Sadder et al., 2015a; Sadder et al., 2015b), the present study also reveals rapid diversification of the pest and Tajima’s test support rapid expansion of territory. Though the present study suffers by not having duplicate samples, 10 haplotypes with potential of further expansion was detected. In general, ITS gene sequences are widely used for identification and assessing the molecular diversity of fungi, plants and animals. Recently this nuclear region of DNA is found efficient for the estimation of diversity and identification of insects such as Coleopterans (Sayed, 2016).
We found that a haplotype from Riyadh region (UT9) was unique and the earlier studies have also declared many unique haplotypes from Riyadh and concluded this site as hot spot of infestation (Sukirno et al., 2020a; Sukirno et al., 2020b). Our observations coincides with the previous study that Riyadh and its surrounding regions would have witnessed multiple introductions of R. ferrugineus from different sources or single introduction of multiple haplotypes (Sukirno et al., 2020a; Sukirno et al., 2020b). Sukirno et al. (2020a), Sukirno et al. (2020b) recognise a third haplotype to be more prevalent in Saudi Arabia, however cross verification of sequences of this study (ITS) with Sukirno et al. (2020a), Sukirno et al. (2020b) (COI) was not possible. We recognise through phylogenetic grouping that, third haplogroup (bottom of the tree) were ubiquitous while first two group were more localised in Saudi Arabia. Since in past few decades, date palms are more rapidly transported across Saudi Arabia (especially from Riyadh regions) (MOA, 2014), rapid infestations and expansions of new territory is possible.
5 Conclusion
Through genetic data, we have provided a strong evidence that there were multiple haplotypes of R. ferrugineus which were bound to expand its diversity. Higher nucleotide diversity and Tajima’s neutrality test values suggest that there were higher movement of infested palm trees, as desserts were natural barriers for movement of H. ferrugineus. The findings of this study will be useful for pest controlling agencies and to the workers involved in infested date palm quarantining.
Acknowledgements
We sincerely thank the Employees in the Ministry of Environment Water & Agriculture in Saudi Arabia for their kind cooperation in the field work. Also, Authors are grateful to Taif University Researches Supporting Project number (TURSP-2020/92), Taif University, Taif, Saudi Arabia, for supporting this study.
Declaration of Competing Interest
The authors declare that they have no known competing financial interests or personal relationships that could have appeared to influence the work reported in this paper.
References
- Evaluation of phylogenetic relationship between three phenotypically different forms of red date palm weevil RhynchophorusferrugineusOliv. Using PCR-based RAPD technique. Arch Phytopathol. Plant Protect. 2006;39(4):303-309.
- [Google Scholar]
- Using DNA barcoding to link cystacanths and adults of the acanthocephalan Polymorphus brevis in central Mexico. Mol. Ecol. Resour. 2013:n/a.
- [CrossRef] [Google Scholar]
- Pheromone receptor of the globally invasive quarantine pest of the palm tree, the red palm weevil (Rhynchophorus ferrugineus) Mol. Ecol.. 2021;30(9):2025-2039.
- [Google Scholar]
- Using DNA Barcodes to Aid the Identification of Larval Fishes in Tropical Estuarine Waters (Malacca Straits, Malaysia) Zool. Stud.. 2019;58:e30
- [CrossRef] [Google Scholar]
- Haplotype-resolved genome assembly enables gene discovery in the red palm weevil Rhynchophorus ferrugineus. Sci. Rep.. 2021;11(1)
- [CrossRef] [Google Scholar]
- Mitochondrial genetic variation and invasion history of red palm weevil, Rhynchophorusferrugineus (Coleoptera: Curculionidae), in the middle-east and Mediterranean Basin. Int. J. Agric. Biol.. 2011;13:631-637.
- [Google Scholar]
- Preliminary Study on Geographical Variation of Cytochrome b gene and ITS2-rDNA among Populations of Rhynchophorusferrugineus. J. Agric. Sci. Technol. B. 2011;1:189-197.
- [Google Scholar]
- The threat of red palm weevil Rhynchophorusferrugineus to date plantations of the Gulf region in the Middle-East: an economic perspective. Outlooks Pest Manag.. 2009;20:131-134.
- [Google Scholar]
- List of biological control agents widely used in the EPPO region. EPPO Bull.. 2002;32:447-461.
- [Google Scholar]
- Confidence limits on phylogenies: An approach using the bootstrap. Evolution. 1985;39:783-791.
- [Google Scholar]
- Giblin-Davis, R. M. Borers of palms. In Insects on Palms (eds. Howard, F. W., Moore, D, Giblin-Davis, R. M., & Abad, R. G.) 267–304. (CABI Publishing, Wallingford, GB, 2001).
- BioEdit: a user-friendly biological sequence alignment editor and analysis program for Windows 95/98/NT. Nucl. Acids. Symp. Ser.. 1999;41:95-98.
- [Google Scholar]
- Ten species in one: DNA barcoding reveals cryptic species in the neotropical kipper butterfly Astraptesfulgerator. Proc. Natl. Acad. Sci. U.S.A.. 2004;101(41):14812-14817.
- [Google Scholar]
- Ecology in the age of DNA barcoding: the resource, the promise and the challenges ahead. Mol. Ecol. Resour.. 2014;14(2):221-232.
- [Google Scholar]
- Linking eggs and adults of Argulus spp. using mitochondrial DNA barcodes. Mitochondrial DNA Part A. 2014;27(6):3927-3931.
- [CrossRef] [Google Scholar]
- A simple method for estimating evolutionary rate of base substitutions through comparative studies of nucleotide sequences. J. Mol. Evolut.. 1980;16:111-120.
- [Google Scholar]
- DNA barcodes for ecology, evolution and conservation. Trends EcolEvol. 2015;30(1):25-35.
- [Google Scholar]
- MEGA X: Molecular Evolutionary Genetics Analysis across computing platforms. Mol. Biol. Evolut.. 2018;35:1547-1549.
- [Google Scholar]
- Kurdi, H., Al-Aldawsari, A., Al-Turaiki, I., & Aldawood, A. S. (2021). Early Detection of Red Palm Weevil, Rhynchophorus ferrugineus (Olivier), Infestation Using Data Mining. In Plants (Vol. 10, Issue 1, p. 95). MDPI AG. Doi: 10.3390/plants10010095
- Monitoring the Red Palm Weevil Infestation Using Machine Learning and Optical Sensing. Optical Fiber Commun. Conf. Exhibit. (OFC). 2021;2021:1-3.
- [Google Scholar]
- Ministry of Agriculture. 2010. Available from: http://www.moa.gov.sa/.
- The current distribution of red palm weevil in the Kingdom of Saudi Arabia. Riyadh: Ministry of Agriculture; 2014.
- Species-wide homogeneity of nuclear ribosomal ITS2 sequences in the spider mite Tetranychusurticae contrasts with extensive mitochondrial COI polymorphism. Heredity. 1998;80(6):742-752.
- [CrossRef] [Google Scholar]
- Rugman-Jones PF, Hoddle CD, Hoddle MS, Stouthamer R (2013) The lesser of two weevils: molecular-genetics of pest palm weevil populations confirmRhynchophorusvulneratus (panzer 1798) as a valid species distinct from R. ferrugineus (Olivier 1790), and reveal the global extent of both. PLoS One 8:e78379.
- Rugman-Jones, P. F., Hoddle, C. D., Hoddle, M. S., Stouthamer, R. (2013) The lesser of two weevils: molecular-genetics of pest palm weevil populations confirm Rhynchophorusvulneratus (Panzer 1798) as a valid species distinct from R. ferrugineus (Olivier 1790), and reveal the global extent of both. PLoS ONE 8, e78379.
- Rugman-Jones, P.F., Hoddle, C.D., Hoddle, M.S. Stouthamer, R. (2013) The Lesser of Two Weevils: Molecular-Genetics of Pest Palm Weevil: Populations Confirm Rhynchophorusvulneratus (Panzer 1798) as a Valid Species Distinct from R. ferrugineus (Olivier 1790), and Reveal the Global Extent of Both. PLoS ONE 8 (10), E78379.
- Phylogeny of red palm weevil (Rhynchophorusferrugineus) based on ITS1 and ITS2. Orient Insects. 2015;49(3-4):198-211.
- [Google Scholar]
- Phylogeny of red palm weevil (Rhynchophorusferrugineus) based on ITS1 and ITS2. Oriental Insects. 2015;49(3–4):198-211.
- [CrossRef] [Google Scholar]
- The neighbor-joining method: A new method for reconstructing phylogenetic trees. Mol. Biol. Evolut.. 1987;4:406-425.
- [Google Scholar]
- DNA fingerprints of three different forms of the red palm weevil collected from Egyptian date palm orchards. Arch. Phytopathol. Plant Protect.. 2002;35(4):299-306.
- [Google Scholar]
- Molecular diversity of the lady beetles, CoccinellaundecimpunctataL. and Hippodamia variegata(Goeze) (Coleoptera: Coccinellidae) in Saudi Arabia. Egyptian Journal of Biological. Pest Control.. 2016;26(2):351-355.
- [Google Scholar]
- Many species in one: DNA barcoding overestimates the number of species when nuclear mitochondrial pseudogenes are coamplified. Proceed. Natl. Acad. Sci.. 2008;105(36):13486-13491.
- [Google Scholar]
- Linking adults and immatures of South African marine fishes. Genome.. 2016;59(11):959-967.
- [CrossRef] [Google Scholar]
- Diversity of red palm weevil, RhynchophorusferrugineusOliv. (Coleoptera: Curculionidae) in the Kingdom of Saudi Arabia: studies on the phenotypic and DNA barcodes. Int. J. Trop. Insc.. 2020;40(4):899-908.
- [CrossRef] [Google Scholar]
- Diversity of red palm weevil, RhynchophorusferrugineusOliv. (Coleoptera: Curculionidae) in the Kingdom of Saudi Arabia: studies on the phenotypic and DNA barcodes. Int. J. Trop. Ins. Sci.. 2020;40(4):899-908.
- [CrossRef] [Google Scholar]
- Statistical methods to test for nucleotide mutation hypothesis by DNA polymorphism. Genetics. 1989;123:585-595.
- [Google Scholar]
- The ClustalX windows interface: flexible strategies for multiple sequence alignment aided by quality analysis tools. Nucl. Acids Res.. 1997;25:4876-4882.
- [Google Scholar]
- Wang, B., Mao, Y., Ashry, I., Al-Fehaid, Y., Al-Shawaf, A., Ng, T. K., Yu, C., & Ooi, B. S. (2021). Towards Detecting Red Palm Weevil Using Machine Learning and Fiber Optic Distributed Acoustic Sensing. In Sensors (Vol. 21, Issue 5, p. 1592). MDPI AG. Doi: 10.3390/s21051592.


