

Translate this page into:
Relationship between precursory signals and corresponding earthquakes using different spectral analysis techniques
⁎Corresponding author at: National Research Institute of Astronomy and Geophysics (NRIAG), Helwan 11722, Egypt. aligamal@ltlab.com (Ali G. Hafez)
-
Received: ,
Accepted: ,
This article was originally published by Elsevier and was migrated to Scientific Scholar after the change of Publisher.
Peer review under responsibility of King Saud University.
Abstract
The origin of precursory signals that precede the P-waves is controversial, as it may be caused by ground effect (seismic nucleation phase) or instrumental effect due to a digitizer. Such signals cause errors in the automatic detection of P-wave arrival times and consequently decrease the accuracy of earthquake parameter estimations. In this paper, we proposed spectral analysis techniques to distinguish between different types of precursory segments, and to find if there is a relation between existence of these precursors and their corresponding earthquakes. These algorithms are applied to 1015 local events recorded by eleven permanent seismic stations belonging to the Egyptian National Seismic Network. Manual inspection of these events reveals the existence of these precursors. The investigations provided evidence that one type of these precursors originated because of an instrumental effect. This study shows the underlying causes of the precursory segment’s appearance prior to P-wave impulses. Many events had similar parameters; however, some of them had such precursors while others did not, in this inspection, multi resolution analysis details of the Discrete Wavelet Transform have been used. When large amplitudes for high frequency P-wave detail exceed counts (1 count = 1 nm/s), the appearance percentage for the precursory segment is 100%.
Keywords
Nucleation phase
Instrument effect
Earthquake precursory signals
Spectral analysis
MRA of wavelets
FIR filter

1 Introduction
Numerous researchers have enhanced the Earthquake Early Warning (EEW) system by using the estimated parameters of seismic events from a single recording station (Caruso et al., 2017; Lockman and Allen, 2005). Hafez et al. (2020) had discussed the use of earthquake precursors in helping the EEW system alarms, where some researchers support this idea and others proved that there is no relation between the magnitude and the duration of the precursors with the magnitude of the corresponding earthquake. An automatic detection algorithm was proposed for one pattern of these signals by (Hafez et al., 2013b); however, they did not determine the reason behind the appearance of these signals. This study introduces three patterns of precursory segments and their types. Identifying the origin of these precursors is an important tool in detection of nano-seismic events which have the same range of amplitudes. The start of small cracks characterize with the same behaviour like these precursors. The seismic nucleation phase is an initial phase that comes from the rupture deformation when the stress changes from static to dynamic (Iio, 2011). Usually, this phase occurs in a micro-seismic wave with a time growth of order where (2 < less than 4 ) according to (Iio, 1995). However, this time growth is not sufficient for large events. Therefore, (Beroza and Ellsworth, 1996) studied both small and large events and found a relationship between the static seismic moment and the duration of the nucleation phase. The seismic stations had to satisfy many conditions to record it. These conditions include a recording station close to the source, a high gain, a high sampling rate for the digitizer in case of a micro-seismic event, a high signal to noise ratio (SNR) and a low attenuation as proposed by (Beroza and Ellsworth, 1996).
Precursory segments caused by the instrument effect are mostly populated from a finite impulse response (FIR) filter block inside the digitizer as mentioned by (Scherbaum, 2013). A digital seismic system, like any digital communication system, requires a transfer of source information (earthquake) from an analogue to a digital format. Egyptian National Seismic Network (ENSN) uses digitizers manufactured by Nanometrics Inc., and the commercial names of these digitizers are (HRD, Trident, and Trident 305). These digitizers operate at an initial sampling rate of 30 kHz and then the data are stored in loggers; then, the FIR filter provides the desired output sampling rate. Because of its linearity, the FIR filter is used in all seismic recording systems, whereas IIR filters are not used since they cause phase distortion. An FIR filter has a symmetric impulse response in a causal system, which leads to a precursory oscillation prior to an event with an impulsive sharp P-wave in the time domain. However, these studies did not ascertain why such precursors disappeared from other events of similar parameters, thereby providing a primary focus for this research. Several spectral analysis techniques are used in this article, which are as follows: Fast Fourier Transform (FFT), Short Time Fourier Transform (STFT), and multi-resolution analysis (MRA) of Discrete Wavelet Transform (DWT). Advantages of DWT over other transforms, the determination of the MRA details and smooth and their frequency ranges can be found in (Hafez et al., 2010, 2013a; Percival and Walden, 2006).
2 Three patterns of precursory segments
Various shapes of precursory signals that preceded the P-wave were detected in ENSN records. Precursory segments have different frequency spectra and power contents compared to normal seismic noise. All the P-wave segments which are employed in this study are
type that has the impulsive feature. Consequently, any segment with lower energy appears just before the impulsive P-wave will be seen as precursory segments. Lower energy means less than the energy of P-wave but a little higher energy than the noise. Four examples of precursory signals are plotted in Fig. 1, where the dashed lines are highlighting the start and the end times of the precursory signals. This end time is the arrival of the P-wave. Automatic and manual pickings, use the start timing of the precursors which are 0.5 s leading the actual
arrival. These 0.5 s cause an error in earthquake parameter determinations which depend mainly on the detection accuracy of the P-wave arrivals. The first is an earthquake without a precursory segment that was recorded at Kotamaya (KOT) station with epicentral distance of 38 km. The second event contains a precursory segment recorded at Hurghada (HRG) station with an epicentral distance of 11 km. In HRG event, amplitudes of the seismic record preceding the P-wave increased gradually, which can be described as a ramping shape precursory segment as named by Scherbaum (1997). This type of precursory segment is named as a first pattern or ramping pattern. Duration of this pattern ranges between 0.04 and 0.33 s at a sampling rate of 100 samples/s. We note that the appearance of the ramping pattern happens at small epicentral distance events (less than 60 km). Among the checked ENSN records, two other precursory patterns were found. These two patterns precede 24 events at three stations, as shown in Fig. 1 and in sections c and d. Section c displays another type of precursory signal that will be called the second pattern that has a duration of 0.22 s at 100 samples/s. This pattern was recorded at Saint Cathrine station (KAT) at an epicentral distance of 60 km. Section d shows a third pattern precursory signal. This pattern precedes the ramping pattern when this event was recorded at New Abu-Dabbab station (NADB) at an epicentral distance of 9.5 km and a duration of 0.49 s. Each pattern of these precursory segments has a unique shape, power, and duration. To differentiate between these patterns, we collected more data for precursory patterns, which will be discussed in the following section.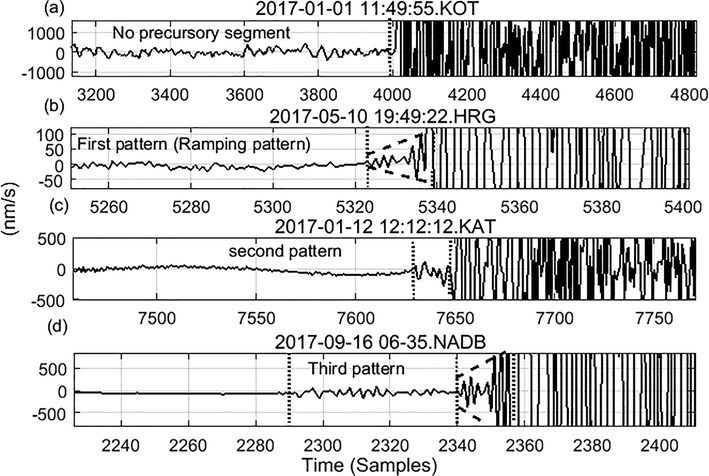
(a) Local event recorded at KOT station without a precursory signal. The other three sections (b, c, d) present three local events that have three types of precursory segments; these segments are marked with dashed lines.
3 Data gathering
In previous section, it was shown that there are three types of precursory patterns. The first pattern (ramping pattern) appeared in many records and was thoroughly checked in various studies such as (Hafez et al., 2013b) and (Scherbaum and Bouin, 1997). Another two patterns were recognized as well; however, their shapes are not regular ramping type patterns. Second pattern directly appears before the P-wave arrival, whereas the third pattern appears prior to the ramping shape pattern. To increase the number of investigations and add robust statistical analysis, large set of data had been used in this study. Therefore, seismic records between (2013 ∼ 2017) at ENSN were monitored to check the existence of these patterns. The first pattern’s occurrence frequency is higher than the other two patterns. Therefore, this paper will focus more on the ramping pattern. The other two patterns were used to explain the differences in spectra of such precursory segments. These ramping patterns were recorded in nine stations belonging to the following regions in Egypt: Dahshour, Gulf of Aqaba, Aswan and Abu-Dabbab. Table 1 lists the distribution of these patterns on the recording stations. Fig. 2 summarizes all data records collected throughout this study. The seismological parameters of these events are as follows: the magnitude range is (Ml= (0.8 ∼ 3.5)), depth (0.1 ∼ 23.2 km), the epicentral distance (3 ∼ 92 km), and the azimuth angle and angle of incidence ranges between (0°,360°) and (48°,180°), respectively. These events were taken from the National Research Institute of Astronomy and Geophysics (NRIAG) bulletin (2013 to 2017). The used seismometers and digitizers in these stations are listed in Table 1s in the supplementary data
Reg/st
No Prec.
Ramp. Pattern
2nd Pattern
3rd Pattern
SUM
Dahshour
–
34
–
–
34
Gulf of Aqaba
104
38
17
–
159
Aswan
48
59
–
–
107
Abu Dabbab
515
189
4
5
713
GRB
–
–
2
–
2
SUM
667
320
23
5
1015
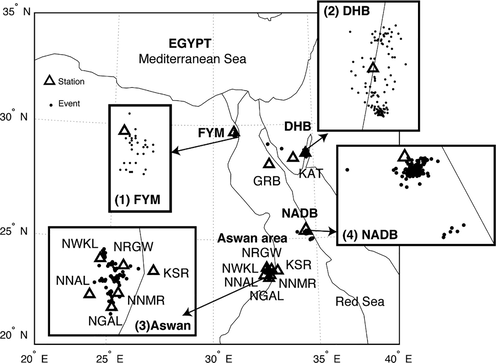
Egypt map displaying eleven stations containing all precursory patterns with their epicentral distances.
4 Comparison with previous studies
Pervious investigations differentiated precursory segments using time domain analysis, such as (Scherbaum and Bouin, 1997; Beroza and Ellsworth, 1996). (Beroza and Ellsworth, 1996) found that
for the nucleation phase, and a relationship of
was found in (Scherbaum and Bouin, 1997) for the FIR effect, where
is the duration of the precursory segment that was determined manually for the first pattern and
is the static seismic moment.
was calculated from equation (3), as mentioned in (Badawy et al., 2006), and the seismic moment values of used events range between (
-
) Nm.
Where the constants for this equation that were calculated for abu-Dabbab in (Ali et al., 2012; Hussein et al., 2011) are as follows:
density (
);
: velocity of p-wave or s-wave;
);
hypocentral distance between the station and event location,
low frequency spectral amplitude; and
: radiation pattern coefficient (0.52). Throughout this study,
and
were calculated for the data collected from the Abu-Dabbab region using the constants of equation (1). The calculated values were plotted together with previous values in one plot in Fig. 3. From this figure the calculated values of this study are closely related to those of (Scherbaum and Bouin, 1997). However, there were many events with a sharp impulsive P-wave arrival and same values of seismic moment that had no precursory segments. Although the previous studies gave detailed information on precursors prior to impulsive P-wave segments, they did not mention why such precursors sometimes do not appear in front of such P-waves of the same origin and parameters of other earthquakes. Thus, we used spectral analysis techniques to identify if the event had a significant parameter on appearance of the precursor or not, as will discussed in section 5.2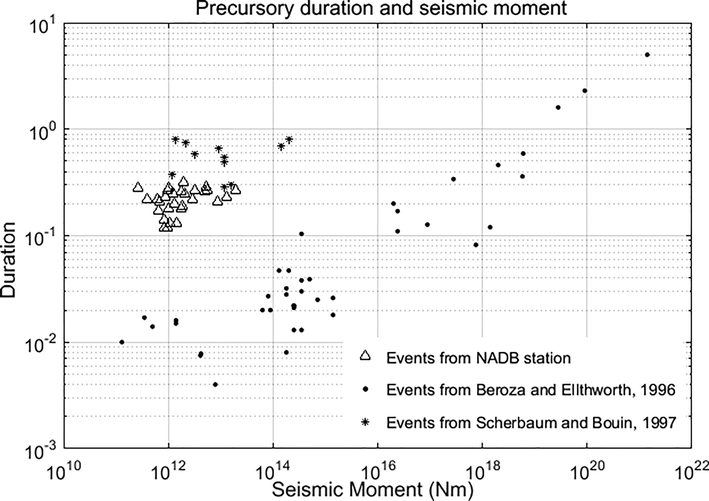
Relationship between the precursory duration and the static seismic moment. Events in this figure are from NADB station, nucleation events from Beroza and Ellsworth, 1996, and FIR events from Scherbaum and Bouin, 1997, with sample rates 100 samples/s, 20–500 samples/s, and 20 samples/s, respectively.
5 Spectral analysis methodology
The target of this research is to identify the origin of precursors, and identify the relationship between the event and the occurrence of the ramping precursors. Such signals cause errors in detecting P-wave arrivals. To reach this target, spectral analysis tools (FFT, STFT, and DWT) were applied on gathered data and were used to discriminate between different shapes of precursory patterns. This discrimination greatly assists in identifying the reasons behind either the existence or disappearance of these patterns prior to impulsive P-wave segments.
5.1 Spectra of the precursors for different regions
From section 2, precursory signals appear at different stations from different regions. Fault type, azimuth angle, angle of incidence and attenuation path changes from one fault to another, therefore the shape of the recorded time series will depend on each fault. Consequently the spectrum of each fault is different from one to another. All these parameters affect the spectra of the recorded seismic events at the station, and the spectra of the precursory signals will likely be affected as well. This section is devoted to comparisons between the spectra of precursory signals recoded at different regions. In this respect, FFT was calculated for 320 records having a ramping pattern and 28 records containing the second and third patterns. The spectra of the first pattern (ramping shape) of all 320 records were almost identical, meaning that the ground parameters of each region did not have effect on the spectra. This investigation shows strong evidence that the ramping pattern may not be caused by the natural ground effect, but it is instrumental effect due to FIR effect. Fig. 4 shows five examples representing five records from different regions. The upper section represents the time domain of these records, and the lower one indicates a corresponding FFT for each of them. The FFT in sub-sections (b-1–5) are, notably, almost identical, whereas the frequency content centered around 45 Hz. The stations used in this figure were NADB stations recording two earthquakes, the NRGW, DHB, and FYM stations. The epicentral distances of all events are 11.5, 47.7, 9.99, 12.94, and 23.3 km, respectively.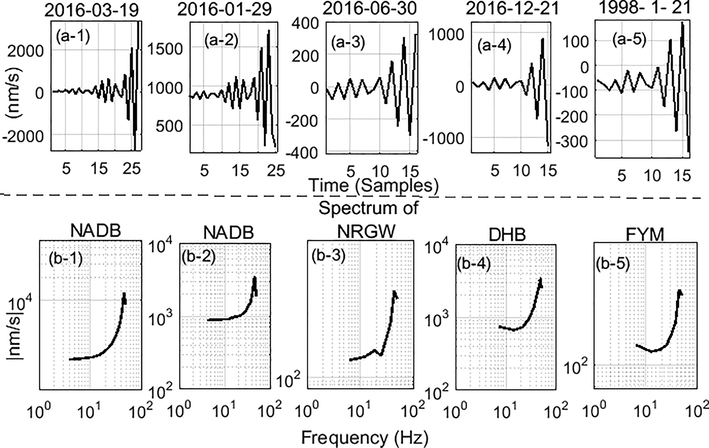
Sections (a (1–5)) display the time series of ramping pattern from different regions. Sections (b (1–5)) representing the corresponding spectra.
Records in Fig. 5 contain second and third patterns that were collected from KAT, GRB, and NADB stations. There are differences between the spectra of the precursors of the second and third patterns which indicates that these two patterns are due to the natural ground effect. Sub-figures (a-1) and (a-2) are two segments representing the second pattern, where (b-1), and (b-2) represent the corresponding FFT. (a-3) and (a-4) represent two precursory signals arriving before an event recorded at NADB station. (a-3) shows a third pattern precursory signal, while (a-4) shows the ramping type. The spectra of these two segments are displayed in (b-3) and (b-4), respectively. To join the two divisions of (b-3) and (b-4), STFT is used to highlight the spectra of each division of precursors versus time in a colored map spectrogram, as shown in Fig. 6. The third pattern from (330–800 ms) clearly had different power and frequency contents than the noise, where as ramping pattern had a higher power centered around 45 Hz. The corner frequency of each pattern spectrum has been identified for 320 recorders represented the ramping pattern. Then the probability distribution functions (PDF) shown in Fig. 7. This figure also shows the PDF for the 28 records (combining second and third pattern). It can clear that almost all frequency of 320 centered around 45 Hz, where the PDF of the other 28 patterns did not show an average around exact value. The exact values of these frequencies are listed in Table 2s in the supplementary data.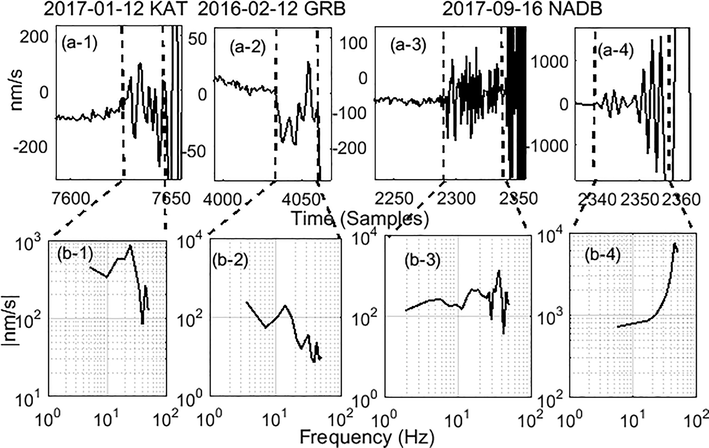
Sections (a (1–4)) represent time series for the three types of precursory signals. (b (1–4)) show the corresponding spectrum for each segment.
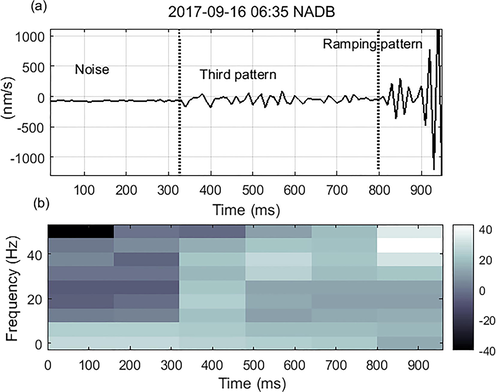
(a) Time domains of the third and ramping patterns. (b) The corresponding spectrogram, where the spectrogram parameters are: Hanning window of length 16, number of overlapped points are 10 and FFT length of 64 samples.
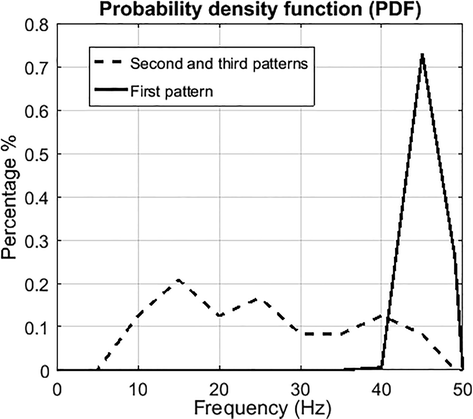
PDF for all the 348 events containing different types of precursory segments.
5.2 Event effect on appearance of ramping pattern
Section 5.1 indicates that the first pattern cannot have been originated due to ground effects. Throughout this section, we investigate why the ramping pattern type appears in some records but does not in others. During the investigation, there were fluctuations in the appearance rates of the ramping type. Within a group of events that occurred at the same epicentral distance and recorded by the same station, some of these events were preceded by a ramping pattern, while others were not. For example, two events of similar parameters recorded by the NADB station; one of the events had this ramping precursory segment, while the second event did not. The parameters were as follows: (magnitude (Ml = (1.8, 1.9)), depth (9.4 km), epicentral distance (8.7 km), azimuth angle (349°, 342°), and angle of incidence was (132°, 134°).
Although there are no differences in the amplitudes of the original time series for the two events of Fig. 8, one of the two events is preceded by ramping precursor while the other event is not. Therefore, the MRA of DWT is used to find any criteria that could discriminate between these two cases. Daubechies wavelet filter of the eighth order was used in this analysis. In calculating the first three details, there was a noticeable difference between the amplitudes of the first details of the two events. The amplitudes of the second and third details in addition to the smoothing of the two events did not show a large difference between both events. The clear difference in the first detail is recognized in many other cases, and one of them is shown in Fig. 8. In this figure, the DWT details of the first 1.4-seconds of the P-wave after the end of precursory signal have been calculated. Plotted data in the left column of Fig. 9 shows an event recorded by DHB station with an epicentral distance of 14.2 km; however, no precursory segment was present. The right column shows another event recoded by the same station with an epicentral distance of 17.3 km where a precursory segment is present. Amplitudes of the first detail of the right-side event have higher values as compared to the first detail amplitude of the left side. This phenomenon had been observed in other events where precursory signals are likely to appear when large amplitudes of the first detail occur.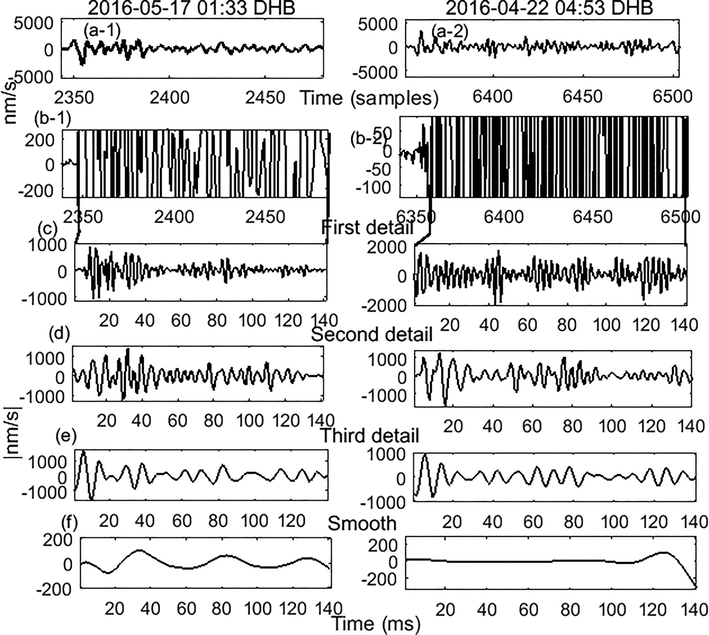
(a-1 and 2) Two events recorded by DHB station without and with a ramping pattern, respectively. (b-1 and 2) Enlarged segments around the P-wave arrival of the two events. (c, d and e) First, second and third details of the two events, respectively. (f) Smoothed components of the two events.
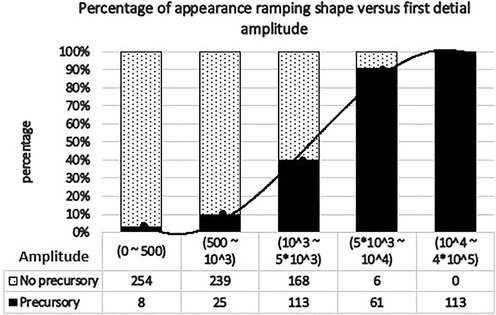
Percentage of the appearance of ramping patterns as a function of maximum values of first detail amplitudes. The table under the chart indicates the number of events in each column and their amplitude ranges.
To determine the relationship between the first detail amplitudes and the appearance of ramping precursors, we studied the span of the first detail amplitudes either with or without the presence of ramping precursors. The DWT first details were calculated for 987 events using equations (1) and (2); 320 have ramping patterns, while the other 667 events have no precursors. Fig. 9 shows the relationship between the percentage of appearances of ramping shapes and first detail amplitude ranges. For amplitudes lower than 500 counts, the percentage of the ramping pattern occurrence is 3%. The percentage of existence increased to (10, 40, 91, and 100%) for amplitude ranges of (less than 103, (1–5)*103, (5–10) *103, and higher than 104 counts), respectively. This figure shows the effects of the first detail amplitudes of different events. This study displays the interdependence of ramping shapes and high amplitudes of the first detail. A MATLAB calculation of first detail amplitudes was depicted in Fig. 9 and fitted by an Excel polynomial equation of a third order. This order is taken to avoid a higher order saturation effect.
Where is the percentage of appearance of ramping precursors and is maximum value for the first DWT detail of the first 1.4 s of the P-wave.
6 Conclusions
Investigations on the appearance of precursory signals in front of P-wave arrivals revealed that there are three kinds of patterns of these precursors. The first type, which has a ramping shape, had been found to be due to instrumentation errors (FIR effect) where it has fixed spectral distribution independent on the recording station. Fluctuation in the existence of the ramping type is due to the amplitude values of the P-wave in the high frequency range, where high amplitudes tend to have precursors in front of the P-wave arrival. The used spectral analysis techniques have revealed that the other two patterns are due to natural ground effects, where their spectra change from station to another.
Acknowledgments
We extend our appreciation to the Deputyship for Research & Innovation, “Ministry of Education “in Saudi Arabia for funding this research work through the project number IFKSURG-1436-011.
Declaration of Competing Interest
The authors declare that they have no known competing financial interests or personal relationships that could have appeared to influence the work reported in this paper.
References
- Source moment tensors of the earthquake swarm in Abu-Dabbab area, south-east Egypt. Rendiconti Lincei. 2012;23(2):149-163.
- [Google Scholar]
- Source parameters of the Ml 4.1 earthquake of November 08 southeast Beni-Suef, northern Egypt. Journal of African Earth Sciences. 2008;51(3):151-159.
- [Google Scholar]
- A Threshold-based, on-site earthquake early warning approach for Italy. EGU General Assembly Conference Abstracts. 2017;19:14204.
- [Google Scholar]
- Real-time P-wave picking for earthquake early warning system using discrete wavelet transform. NRIAG Journal of Astronomy and Geophysics. 2020;9(1):1-6.
- [Google Scholar]
- a. Un-decimated discrete wavelet transform based algorithm for extraction of geomagnetic storm sudden commencement onset of high resolution records. Computers & geosciences. 2013;51:143-152.
- [Google Scholar]
- Clear P-wave arrival of weak events and automatic onset determination using wavelet filter banks. Digital Signal Processing. 2010;20(3):715-723.
- [Google Scholar]
- b. Detection of precursory signals in front of impulsive P-waves. Digital Signal Processing. 2013;23(3):1032-1039.
- [Google Scholar]
- Seismological Aspects of the Abou Dabbab Region, Eastern Desert. Egypt. Seismological Research Letters. 2011;82(1):81-88.
- [Google Scholar]
- Earthquake Nucleation Process. Extreme Environmental Events, Complexity in Forecasting and Early Warning 2011:320-337.
- [Google Scholar]
- Observations of the slow initial phase generated by microearthquakes: Implications for earthquake nucleation and propagation. Journal of Geophysical Research: Solid Earth: Solid Earth. 1995;100(B8):15333-15349.
- [Google Scholar]
- Single-station earthquake characterization for early warning. Bulletin of the Seismological Society of America. 2005;95(6):2029-2039.
- [Google Scholar]
- National Research Institute of Astronomy and Geophysics (NRIAG), Egyptian Seism. Bull., (2013, 2014, 2015, 2016 and 2017).
- Wavelet Methods for Time Series Analysis (Vol. 4). Cambridge university press; 2006. p. :661.
- Of Poles and Zeros. Fundamentals of digital seismology (Vol. 15). Springer Science & Business Media; 2013. p. :268.
- FIR filter effects and nucleation phases. Geophysical Journal International. 1997;130(3):661-666.
- [Google Scholar]
- Zero-phase FIR filters: Blessing or curse? Eos, Transactions American Geophysical Union. 1997;78(33):343-344.
- [Google Scholar]
Appendix A
Supplementary data
Supplementary data to this article can be found online at https://doi.org/10.1016/j.jksus.2020.101338.
Appendix A
Supplementary data
The following are the Supplementary data to this article:


