

Translate this page into:
Assessment of decadal land use dynamics of upper catchment area of Narmada River, the lifeline of Central India
⁎Corresponding author. tarun.thakur@igntu.ac.in (Tarun Kumar Thakur)
-
Received: ,
Accepted: ,
This article was originally published by Elsevier and was migrated to Scientific Scholar after the change of Publisher.
Peer review under responsibility of King Saud University.
Abstract
India is a land of rivers and Narmada is one of the principal river systems and is ascribed as the lifeline of Central India. Freshwater ecosystems such as rivers across the globe are facing degradation due to multitude of anthropogenic stress factors. Holistic and sustainable approach is prerequisite for monitoring, risk assessment and management of such multitude of problems and critical challenges. Geographical Information System (GIS) has emerged as a powerful tool for carrying out scientific and unbiased monitoring and assessment studies as well as understanding the degradation of ecosystems. The present study focuses on decadal land use changes along the upper catchment area of Narmada river basin. Vegetation was spatially analyzed for digitally classifying numerous imageries using the maximum likelihood algorithm (MLA). Six land cover types were identified which includes dense mixed forest, Sal dominated forests, barren landscapes, agricultural fields, water bodies as well as habitation and commercial spaces. The vegetation structure and species composition are important ecological attributes of the ecosystem. Our study area has faced intensification in anthropogenic stress factors, which is observable in our temporal variations study as well. Increasing urbanization and deforestation in river valley regions is alarming and testimony of the fact. Therefore, in order to maintain the river health advocacy at policy level is needed. The current study is an attempt in that direction. It is therefore essential in developing a road-map for sustainable development of this important riparian ecosystem.
Keywords
Freshwater ecosystems
GIS
Ecology
Anthropogenic stress
Sustainable development

1 Introduction
The sustainable development goals (SDGs) of 2030 as adopted by United Nation member states set up by United Nations General Assembly are blueprint of better and sustainable future for all. Several countries are working hard to achieve the shared vision of development to the best of their abilities. The different aspects of various goals like 6, 11, 12, 13 and 15 have been clubbed together in this research project to accomplish the aim enumerated in goal 15. It explains to “protect, restore and promote sustainable use of terrestrial ecosystems, sustainable management of forests, combat desertification, halt and reverse land degradation and halt biodiversity loss”. Meeting the objectives of SDGs is pivotal in order to comprehensively address the costs associated with anthropogenic impacts and ecosystem trade-offs. Some of the major cities across the globe that they have rapidly altered the land use and land cover (LULC) dynamics to achieve economic goals and urbanization in order to attain the needs of a rapidly growing population (Barros, 2004). The LULC changes study plays a crucial regulatory role in changing total atmosphere and the environment (Qian et al., 2007). Land use patterns denote to the physical features of the earth’s surface like distribution of green vegetation, water, soil and other physical land features generated through anthropogenic activities. Thus, addressing SDG Goal 11 that is to make the urban centres and human settlements more inclusive, safe, resilient and sustainable through this initiative is pivotal. The quantitative analysis of the changes occurred through LULC is crucial to study the corresponding impact on the ecosystem service value (ESV). It could help in the decision-making process for the sustainable development of ecosystem (Lin et al., 2018). The alternations in different component of terrestrial ecosystems could be estimated and monitor through LULC (affecting the different components of the ecosystem directly or indirectly (Guzha et al., 2018). The last century has seen many natural disasters and climate changes across the globe like rise in sea surface temperature, melting of polar ice, sea level rise, change in global wind circulation & ocean currents and weather changes. This has caused detrimental impacts on the biodiversity around the world. Continued overexploitation of natural resources leads to serious threat and it represents unsustainable consumption and production patterns which hampers the Goal 12 of the SDG and adversely discourage the sustainable consumption and production patterns. Its adverse effect can be easily observed in the form of degrading freshwater ecosystems. Preserving freshwater resources for both people and wildlife is essential and is a top priority responsibility to protect the planet. In this manuscript, we have used recent scientific advance techniques to ensure sustainable and holistic development of the upper reaches of Narmada flowing across Achanakmaar Amarkantak Biosphere Reserve (AABR). In order to mitigate the effect of climate change and adapt it as per the fulfillment of goal 13 of the SDG, availability of credential data is crucial. The United Nations have recognized the inextricable link between water and climate change by making it a theme for the World Water Day of 2020. This initiative explains and emphasizes the importance of water and its potential role to mitigate the effect of climate change. Further, it urges the international community to keep water conservation at the top priority during designing the climate related policy. Protection and conservation of freshwater resources such as rivers, streams, springs and lakes distributed across the globe is the need of the time and this manuscript proposes a sound scientific data set for policy makers. It argues that, a land use land cover map of a drainage basin provides a holistic view of the river actual health conditions and also the natural and anthropogenic stress factors that impacts the river sustenance. Under such circumstances, development of the Digital Elevation Model (DEM) is crucial. The resolution of the satellite image varies with the sensors, but the DEM provides the foundations for extracting data pertaining to the drainage network. Many critical hydrological phenomena such as the size, shape and slope of the drainage area, the drainage density, the size and length of the tributaries, etc., correlate with the physiographic characteristics of drainage basins (Rastogi and Sharma, 1976). The aforementioned techniques and tools were chosen for the generation of the current scientific data set. Few limitations of LULC have been noted in hydrological modeling and evapotranspiration estimations where little or no information on the temporal dynamics of LULC classes have been reported (DeFries et al., 1999). AVHRR pathfinder time-series images have become cutting-edge procedures to capture temporal dynamics of LULC at global level (De Fries et al., 1998; Loveland et al., 2002). LULC studies of drainage basins are particularly important in case of rain-fed river systems such as Narmada. It is prone to flooding with prolonged monsoonal rains and erratic precipitation pattern under current climate change scenario (Guhathakurta, et al., 2011; Kulkarni et al., 2013). LULC analysis confirmed around 74.84% increase in built up area and 42.8% decrease in open spaces area during the years 1966–2009 due to increase in the degree of urbanization over the decades in Oshiwara river basin (Zope, et al., 2016). LULC change detection studies have profound impacts on hydrological processes and have been investigated prominently in the recent times (Fox et al., 2012).
The current study attempts to investigate the decadal changes in land use and land cover along upper catchment basin area of Narmada. The primary objective of the current research is to understand the decadal land use changes as well as to identify the anthropogenic stress factors of the study area. The vegetation mapping also ensured the study of phytodiversity of the area. DEM have been constructed for hydrological mapping and geomorphological analysis of the study area.
2 Materials and methods
A workflow of methodology for the current monitoring and assessment analysis is described in Fig. 1. The flow chart is self-explanatory and discusses the various stages of the analysis work carried out during the current research.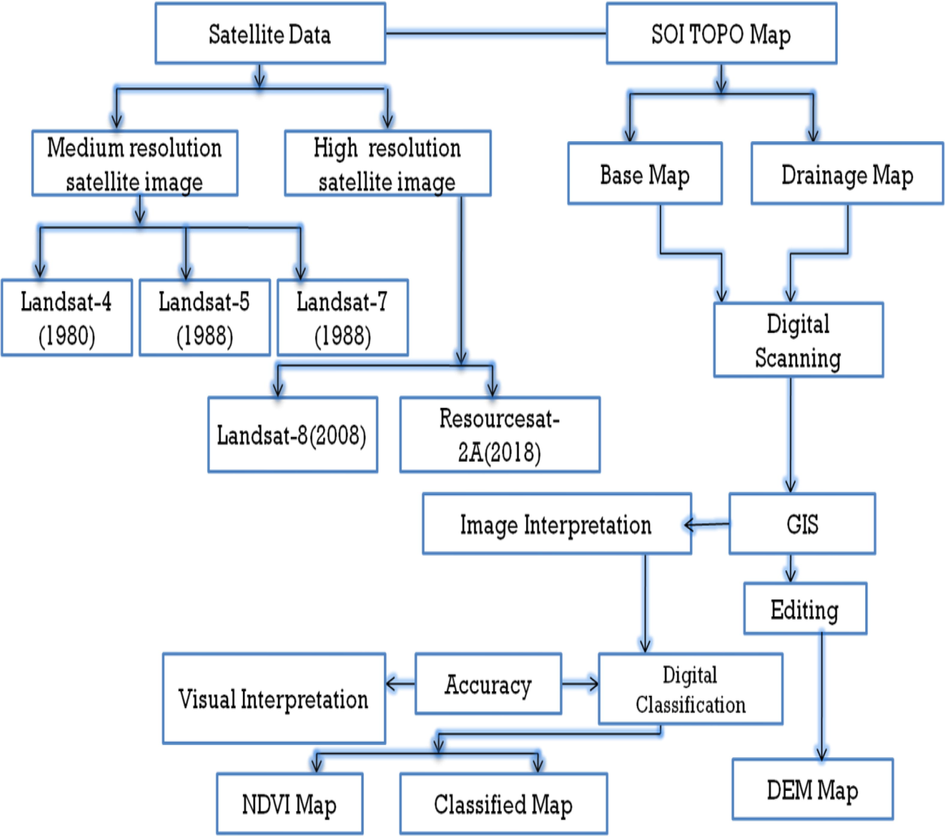
Methodology workflow and data analysis.
2.1 Study area
Upper catchment area of Narmada River was selected as the study site which is a part of Achanakmaar Amarkantak Biosphere Reserve (AABR), Central India. The study area endowed with biodiversity, medicinal, herbal and aromatic plants. There are many minor rivers of this region such as Gayatri, Savitri, Kapila, Baitarini, Arandi, Arpa, Bakan, Tipan and Karmandal. These small rivers provide a natural source of water throughout the year to the Narmada river. Besides minor rivers, many perennial streams and wetlands are found which supply the water to main stream of Narmada.
The Narmada river system originates from Amarkantak highlands located between the map coordinates 22°15′ N to 22°58′ N and 81°25′ E to 82°5′ E covering a geographical area of approximately 35.61 km2 at a mean altitude of 1048 m from average sea level. The base map is demonstrated in Fig. 2. The climate type is sub-humid tropical monsoon with extended summers from April to June, rain from July to October and winter from November to February months. The average yearly temperature ranged from 16.1 °C to 31 °C, while April and May are the hottest, whereas December and January are the coldest months with minimum temperature drops below 5 °C. The annual rainfall varies between 1350 and 1600 mm.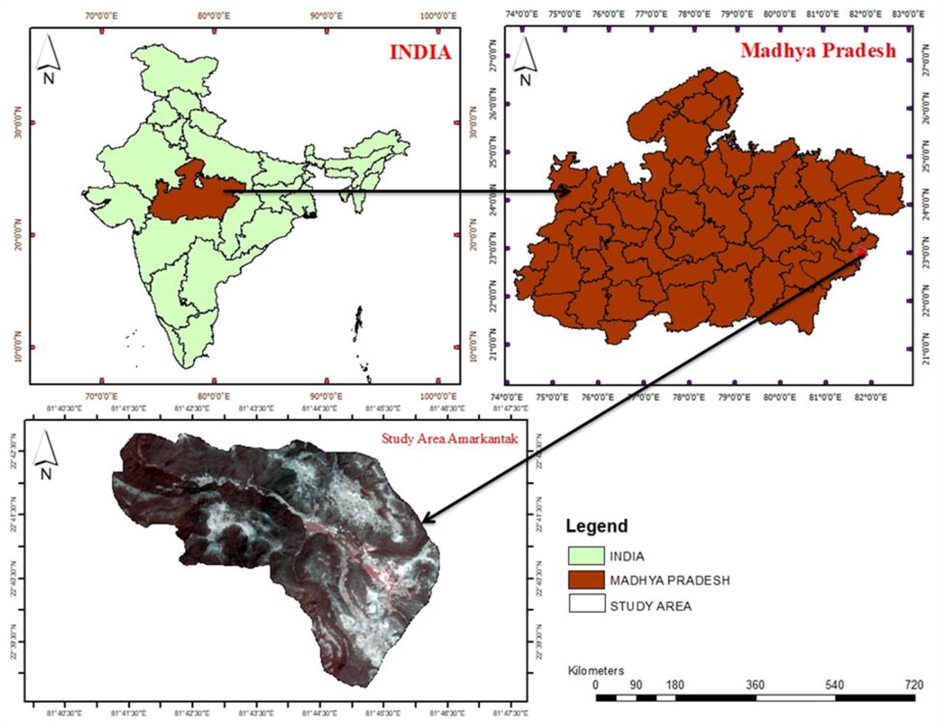
Layout map of the study area.
2.2 Selection, image pre-processing and classification of remote sensing data
Landsat 4, 5, 7, 8 Thematic Mapper (TM) images (1980, 1988, 1998, 2008) and a high-resolution cloud free Resourcesat 2A level-1C image of path 144 and row 44, 43 April/March 2018 was used for mapping LU/LC change classes of the upper catchment areas of Narmada river from (1980 to 2018). All Landsat images were obtained freely from The United States Geological Survey (USGS) website (http://glovis.usgs.gov/). Resourcesat 2A (2018) satellite data was procured from the NRSA National Data Center (NDC), Hyderabad. The data covers the entire study area of the Narmada river basin in the upper catchment areas of Amarkantak region and the neighboring areas. The digital analysis of the data was performed using ERDAS Imagine (Version 2013) software. The secondary data collected from SOI topomaps were analyzed using ArcGIS 10.3. A base map of the study area was prepared from Survey of India toposheets (64E/16 and 64 I/4) at a 1:50,000 scale and geometric rectification of all the imageries was performed. This map was utilized for the ground control point for exactly locating samples plots in the research site. The characteristics of selected satellite data as acquired from the USGS website is demonstrated in (Table 1). Digital image processing and supervised classification has been performed for the monitoring of six land use classes using the maximum likelihood algorithm. The delineated LU/LC classes were: Dense Mixed forest (DMF), Sal mixed forest (SMF), Open Land (OL), Agriculture (AG), Habitation/commercial building (HB) and Water Bodies (WB).
Satellite data
Obtain Date
Row/Path
Number of bands
Swath width (Km)
Inclined Angle
Spatial resolution
Landsat-4
30/05/1980
144/42
7
185
98.2°
30 m
Landsat-5
26/03/1988
144/42
6
185
98.2°
30 m
Landsat-7
11/07/1998
144/42
6
185
98.2°
30 m
Landsat-8
06/09/2008
144/42
4
185
98.2°
15 m
Resourcesat-2A
27/01/2018
144/43
3
740
98.72°
5.8 m
2.3 Vegetation mapping and forest health monitoring using NDVI
Many remote-sensing tools are available to support forest health information needs, and forest health specialists have been making extensive use of these tools for many years. Aerial sketch mapping is extensively used in detection of forest health in USA and Canada. Color and color infrared (CIR) aerial photos have also been used for a wide range of applications. More recently, technologies such as airborne videography, digital photography, and Earth-orbiting satellite imagery have been evaluated for their ability to provide needed information. In the current paper, the vegetation mapping (during 1980 to 2018) and forest health checkup was performed with the help of NDVI (Normalized Difference Vegetation Index). It helped in vegetation classification and forest health monitoring over the time-scale employed for the study. NDVI employs the multi-spectral remote sensing data technique to find out forest types, land use land cover pattern and change detection analysis, habitation, water bodies, open area, agricultural area with few band combinations using satellite images. Previous study suggest that natural resources are easily interpreted by computing NDVI indices like LULC changes and plant health (Gandhi, et al., 2015).
2.4 Construction of DEM (Digital Elevation Model)
The quantitative representation of terrain important for earth science studies and hydrological applications is described by Digital Elevation Model (DEM) (Mukherjee, et al., 2013). The methodology adapted for the study includes the extraction of river basin image followed by extraction of drainage network data. First the DEM images were downloaded from United States Geological Survey (USGS) website (http://glovis.usgs.gov/) following which they were successfully mosaicked. The mosaicked images were then used to delineate the river basin boundary. The images of Narmada river basin was extracted using the Arc hydro tool in ArcGIS 10.3 software.
2.5 Field survey and accuracy assessment
The reference and supplementary data were collected with the help of a field survey as a ground control point with the help of GPS and direct local field measurements were performed for ground verification. Additionally, image categorization and overall accuracy assessment of the classification were carried out. Images of 1980–2018 were evaluated through confusion matrix for the overall accuracy assessments (Congalton, 1991) and Kappa analysis (Rosenfield and Fitzpatrick-Lins, 1986). Stratified random sampling method was used for the evaluation of images in the ERDAS Imagine 2013 software. Besides field investigation, we also investigated the characteristics of understorey and groundstorey vegetation in the upper catchment area of Narmada river. During the survey, we interacted with local individuals and healers for the taxonomic identification and validation of native flora and non-timber forest produces.
2.6 LULC change detection analysis
The LULC map of 1980, 1988, 1998, 2008 and 2018 was resampled from the middle resolution of satellite data (30 m) to spatial high resolution (5.8 m) for the study of classified map and LULC change during the said period. A comparison of pixel-based study was also performed to generate changes on the pixel basis. Pairs of multispectral satellite images were compared between 1980 and 2018 using cross-tabulation to find out the information of LULC changes. Interestingly, change matrix presents significant information about vegetation changes in LULC study (Shalaby and Tateishi, 2007). All classified images change matrix were generated and analyzed using ERDAS to evaluate LULC change during 1980–2018 (Yang and Wen, 2011; Thakur et al., 2020).
3 Results and discussion
3.1 LULC and vegetation mapping
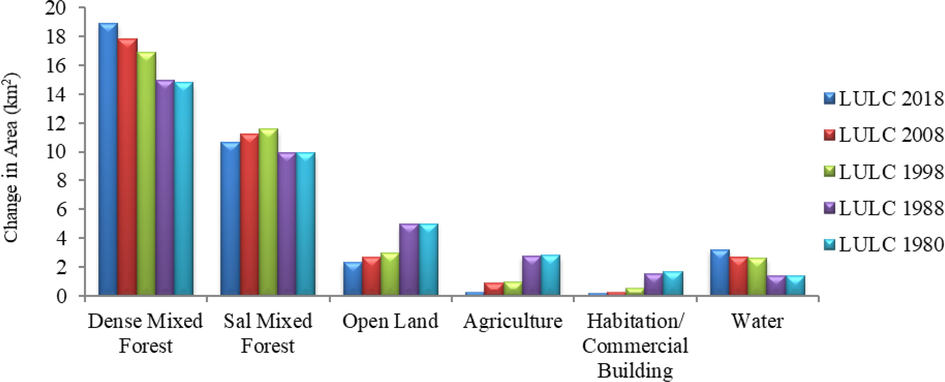
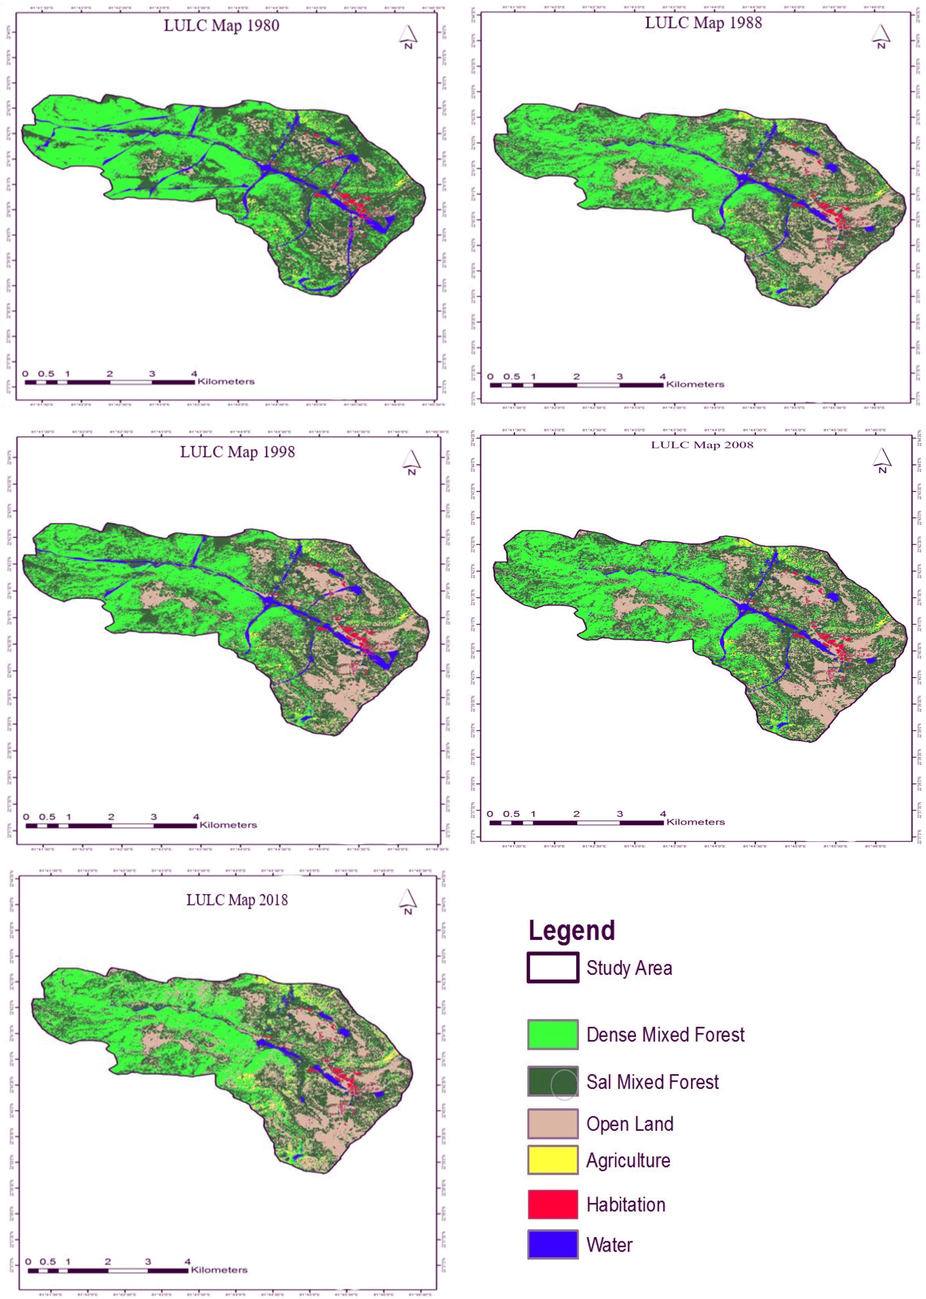
The land cover classification of the study area was done using the MLA and supervised classification, the Standard False Color Composite (SFCC) maps were employed in Fig. 3. It shows decadal changes of the study area over a period of forty years. The spatio-temporal assessment of land use categories is illustrated in (Table 2, Figs. 4 and 5). With a few exceptions, almost all the land use classes were separable in one or the other bands. Six LC and vegetation classes such as DMF, SMF, OL, AG, HB and WB were delineated. The results pertaining to the spatial extent of the different forest types and change detection (during 1980 to 2018) are presented in Table 3. It indicates a steady decline in forest and water resource areas leading to shrinkage in river basin. OL, AG and HB have increased heavily with unplanned industrialization and urbanization along the river valley. The contribution of the changes in the different vegetation classes (during 1980 to 2018) are shown in Fig. 6 as revealed by NDVI index used to employ the vegetation classification and change detection over the years. *Parenthesis values are in percentage. *Parenthesis values are in percentage.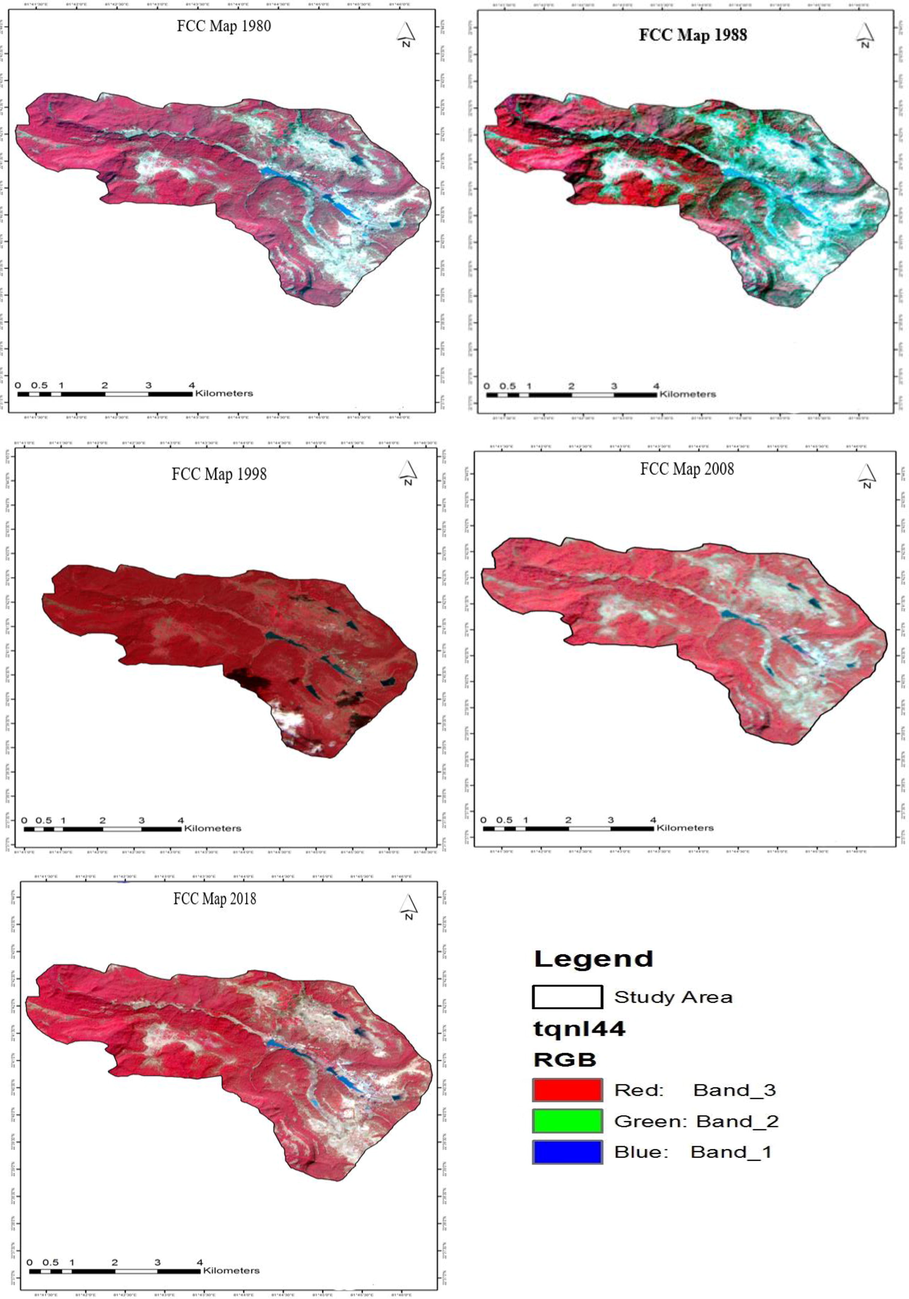
SFCC maps of study area during 1980, 1988, 1998, 2008 and 2018.
Class Name
Area (km2) 1980
Area (km2) 1988
Area (km2) 1998
Area (km2) 2008
Area (km2) 2018
Dense Mixed Forest
18.92 (53.13)
17.79 (49.96)
16.85 (47.32)
14.98 (42.07)
14.78 (41.50)
Sal Mixed Forest
10.65 (29.91)
11.21 (31.48)
11.57 (32.49)
9.90 (27.80)
9.90 (27.80)
Open Land
2.34 (6.57)
2.69 (7.55)
3.01 (8.45)
4.98 (13.98)
5.02 (14.10)
Agriculture
0.29 (0.81)
0.90 (2.53)
0.98 (2.75)
2.78 (7.81)
2.82 (7.91)
Habitation/Commercial Building
0.21 (0.59)
0.29 (0.81)
0.56 (1.57)
1.54 (4.32)
1.70 (4.77)
Water bodies
3.2 (8.98)
2.71 (7.61)
2.64 (7.41)
1.43 (4.01)
1.39 (3.90)
Total
35.61
35.61
35.61
35.61
35.61
LULC Classification of the upper catchment area of Narmada River (1980–2018).
Information on the LULC Classified Image of upper catchment area of Narmada river during 1980, 1988, 1998, 2008 and 2018.
Class Name
Area (km2) 1980
Area (km2) 2018
Difference 2018 Vs 1980 (km2)
Dense Mixed Forest
18.92 (53.13)
14.78 (41.50)
−4.14 (−11.63)
Sal Mixed Forest
10.65 (29.91)
9.90 (27.80)
−0.75 (−2.11)
Open Land
2.34 (6.57)
5.02 (14.10)
2.68 (7.52)
Agriculture
0.29 (0.81)
2.82 (7.91)
2.53 (7.10)
Habitation/Commercial Building
0.21 (0.59)
1.70 (4.77)
1.49 (4.18)
Water bodies
3.2 (8.98)
1.39 (3.90)
−1.81 (−5.08)
Total
35.61
35.61
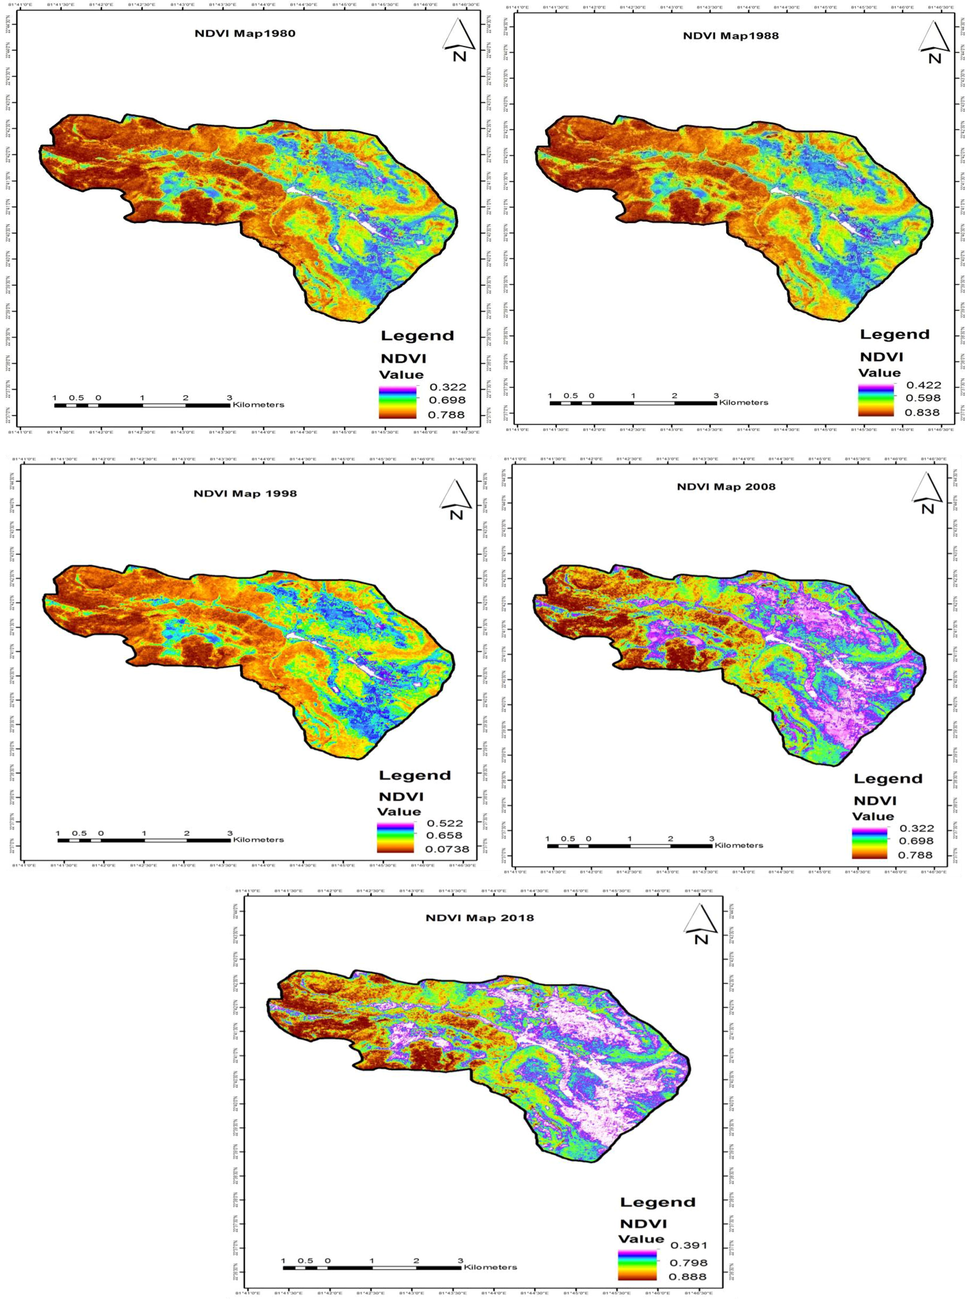
Normalized difference vegetation index maps of the study area during 1980 to 2018.
3.1.1 LULC pattern 1980
During 1980 to 2018, the DMF was dominating category which occupied an area of 53.13% (18.92 km2), the SMF occupied 29.91% (10.65 km2) area of the land use, the OL occupied an area of 6.57% (2.34 km2), the AG was occupied by 0.81% (0.29 km2), the HB covered approximately 0.59% (0.21 km2) and the area under WB cover was 8.98% (3.20 km2) respectively. The land cover area of green vegetation (including different types of forest and agriculture) was 83.85% (29.86 km2) and rest of the land use (OL, HB, WB) were 16.15% (5.75 km2), respectively (Table 2).
3.1.2 LULC pattern 1988
In the year 1988, the contribution of the forest vegetation and agriculture crop lands was 83.97%, WB was 7.61% and other land use (i.e. OL, HB) was covered by 8.42%. The land use covers under DMF, SMF, OL, AG, HB and commercial buildings cover was 49.96% (17.79 km2), 31.48% (11.21 km2), 7.55% (2.69 km2), 2.53% (0.90 km2) and 0.81% (0.29 km2) of the total upper catchment area of Narmada river respectively (Table 2).
3.1.3 LULC pattern 1998
During the period of 1998, the land cover comprises maximum LU areas of 47.32% (16.85 km2), 32.49% (11.57 km2), 8.45% (3.01 km2), 7.41% (2.64 km2), 2.75% (0.98 km2) and 1.57% (2.64 km2) under DMF, SMF, OL, WB, AG and HB of the total land use covered in the current study area. The share of total land cover under the green vegetation (including different forest types and agriculture) was 82.56% (29.40 km2) and rest of the land use (OL, HB, WB) were 17.44% (6.21 km2) respectively (Table 2).
3.1.4 LULC pattern 2008
DMF covered an area of 14.98 km2 (42.07%), SMF 9.90 km2 (27.80%), OL 4.98 km2 (13.98%), AG 2.78 km2 (7.81%), HB 1.54 km2 (4.32%) and the WB was estimated as 1.43 km2 (4.01%) respectively in the classified map of 2008.
3.1.5 LULC pattern 2018
During recent time period, the DMF occupies an area of 14.78 km2 (41.50%), which was close to 2008 DMF value. The SMF occupies an area of 9.90 km2 (27.80%), OL 5.02 km2 (14.10%), AG 2.82 km2 (7.91%), HB 1.70 km2 (4.77%) and the WB 1.39 km2 (3.90%), respectively, in the classified map of 2018. The total study area was found to comprise of 35.61 km2 (Table 2). The forest occupies more than 85% of the total area and the remaining 15% area belongs to agricultural lands, habitation/commercial spaces and water bodies. However, the forest areas are rapidly diminishing due to habitat expansion, roads constructions and other infrastructure development.
3.2 LULC change detection (1980–2018) and accuracy assessment
The results on the pattern of LULC change detection is illustrated in Fig. 7 and represent in (Table 3 and 4). Medium resolution (Landsat 4, 5, 6 and 7 images during 1980, 1988, 1998, 2008) and high-resolution satellite images (i.e. Resourcesat 2A image for 2018) have been employed for spatial distribution of the LULC changes at upper catchment areas of Narmada river between 1980 and 2018 in Fig. 8. The changes in land use are described here for each category (DMF, SMF, AG OL, HB and WB). During study periods DMF (11.63%), SMF (2.11%) and WB (5.08%) was gradually decreased whereas, OL (7.52%), AG (7.10%) and HB (4.18%) areas were increased. Fig. 8(A–E) shows the major land use change of forest areas (DMF & SMF) 13.74% to OL, AG and HB areas. The cultivation practices and habitations have been increased respectively by 7.52%, 7.10% and 4.18% during the periods between 1980 and 2018. The expansion of OL, HB and AG account for almost 18.82% (6.70 km2) of the total LULC changes in the upper catchment area of Narmada from 1980 to 2018 as demonstrated in Table 4.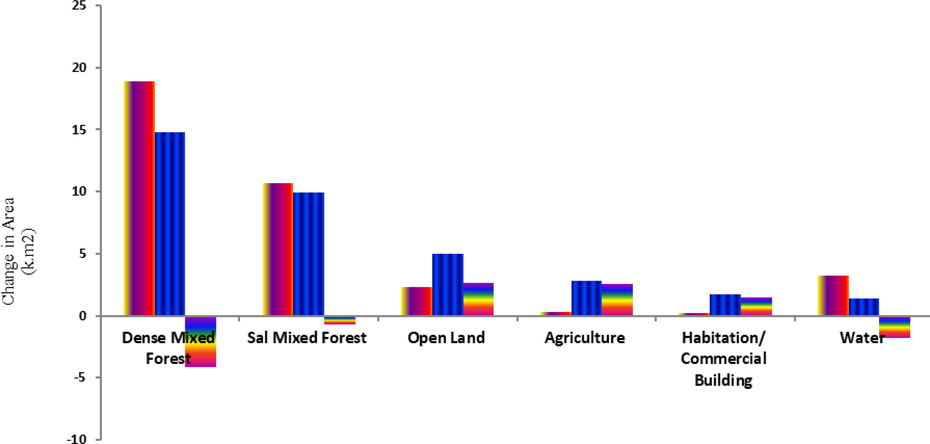
Change Detection pattern of various LC classes during assessment period 2018 Vs 1980 (km2)
Change From
Changed to
Percentage Change
1980–1988
1988–1998
1998–2008
2008–2018
Dense Mixed Forest
Sal Mixed Forest
2.8
0.99
1.5
0.1
Open Land
0.25
0.69
1.3
0
Agriculture
0
0.14
0.98
0.41
Habitation/Commercial Building
0.5
0
1.47
0.56
Water
0
0
0.29
0.74
Sal Mixed Forest
Dense Mixed Forest
0
0
0
0
Open Land
0.75
0
1.86
0
Agriculture
0
0
1
0
Habitation/Commercial Building
0
0
1.50
0
Water
0
0
0.29
0
Open Land
Dense Mixed Forest
0
0
0
0
Sal Mixed Forest
0
0
0.45
0.58
Agriculture
0
0
0
0.71
Habitation/Commercial Building
0
0
0
0.15
Water
0
0
0.36
0.48
Agriculture
Dense Mixed Forest
0
0
0
0
Sal Mixed Forest
00
0
0
0
Open Land
0
0
0.11
0.19
Habitation/Commercial Building
0
0
0
0
Water
0
0
0
1.10
Habitation/Commercial Building
Dense Mixed Forest
0
0
0
0
Sal Mixed Forest
0
0
0
0
Open Land
0
0
1.5
1.98
Agriculture
0
0
0
0
Water
0
0
0.47
0.45
Water
Dense Mixed Forest
0
0
0
0
Sal Mixed Forest
0
0
0
0
Open Land
0
0
0
0
Agriculture
0
0
0.25
0.38
Habitation/Commercial Building
0
0.58
0.98
1.25
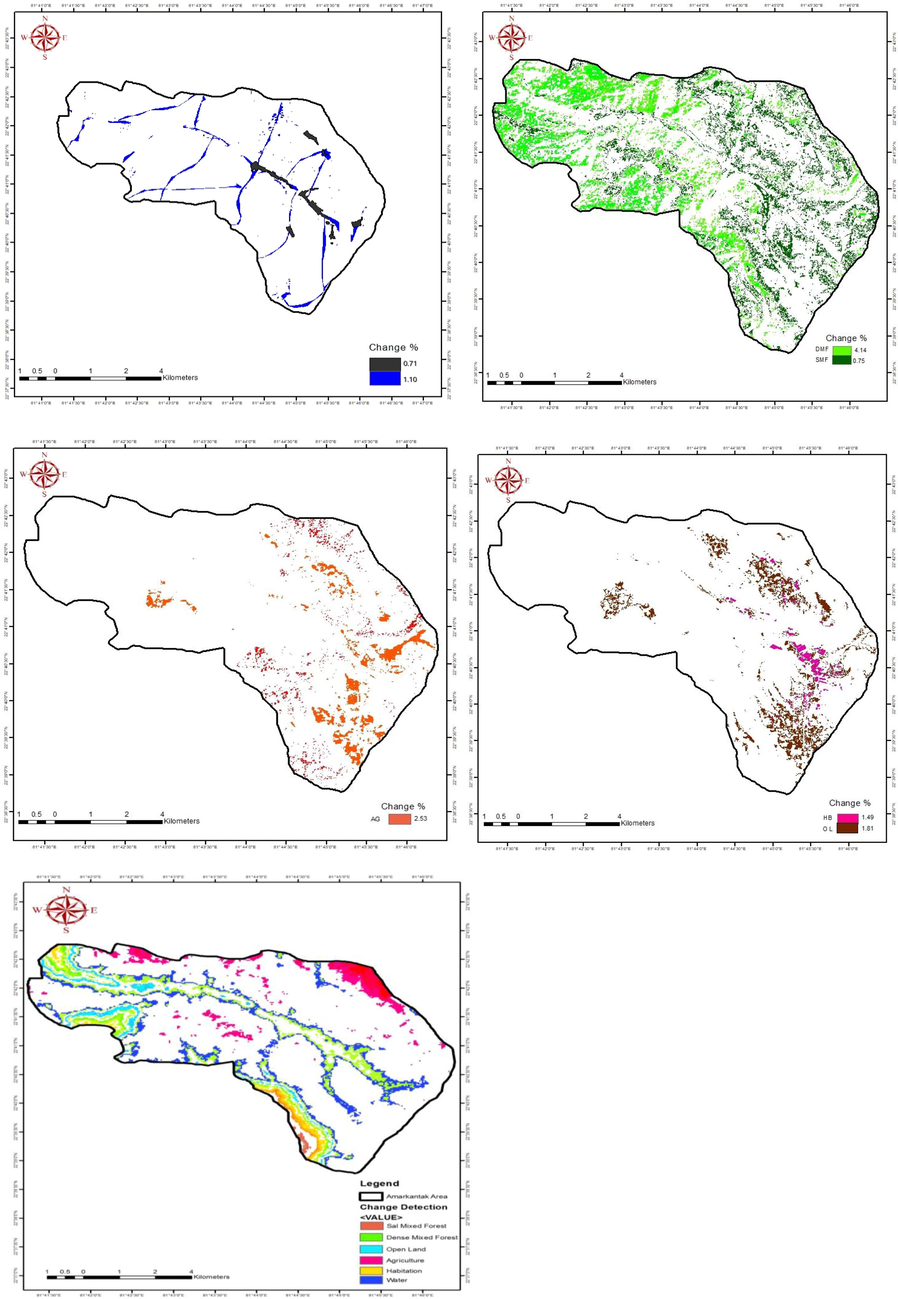
Spatial distribution of land use land cover changes at upper catchment area of Narmada River between 1980 and 2018; (A) Waterbodies, (B) Forest type, (C) Agriculture, (D) Rural areas, (E) All LULC classes. Unchanged areas are shown in white.
Current study approves the reliability and accuracy of multispectral satellite images for mapping of LULC change detection in diverse areas (Aghsaei, et al., 2020; Desta and Fetene, 2020; Aslami and Ghorbani, 2018; Aggarwal et al., 2016). The LULC studies between 1980 and 2018 in upper catchment areas of Narmada basin reveals notable changes that occurred over the four decades such as shrinkage of water bodies, conversion of dense and sal mixed forest into open forest, expansion of agricultural land to delineated forest areas, increase in commercial spaces and habitation areas etc. This has further accelerated overall ecological degradation and biodiversity loss. The problems overgrazing, construction of dams, mining and illegal settlements also pose severe pressure on existing natural resources. Many native species have been replaced by non-native species and monoculture is creating ecological imbalance. Similar demonstration on LULC and change detection in the tropical regions across the globe were reported by several researchers (El-Tantawi et al., 2019; Mishra et al., 2020; Soha and El-Raey, 2019; Olmanson and Bauer, 2016; Dutta et al., 2020; Thakur et al., 2020).
Image classification accuracy assessment of 1980, 1988, 1998, 2008 and 2018 were very constructive and overall accuracy for the LULC image was found to be 85.95% for the year 1980; 87.07% for 1988; 91.86% for 1998; 93% for 2008; and 97% for the year 2018. The accuracy assessment data is mentioned in (Table 5). Similar results on accuracy assessment were reported by Olmanson and Bauer (2016), Chetan et al. (2017), Aslami and Ghorbani (2018). This study signifies the viability of the accuracy assessment data. Furthermore, the error matrix applied over the LULC classification was based on the ancillary facts (Hossen and Negm, 2016). The present study observed significant LULC change and change in matrix also shows severe changes on green undergrowth vegetation and water bodies. The change matrix in the upper catchment area of Narmada river from 1980 to 2018 is presented in (Table 6).
Maps
1980
1988
1998
2008
2018
Overall accuracy (%)
85.95
87.06
91.86
93
97
Kappa
0.85
0.87
0.83
0.92
0.97
2018
Water bodies
Sal mixed forest
Dense mixed forest
Open Land
Agriculture
Habitation
Total
1980
Water bodies
0
4
4
0
0
0
8
Sal mixed forest
1054
634
9634
102
49
4
11,477
Dense mixed forest
0
59
59
523
47
47
735
Open Land
1521
523
7723
489
0
0
10,256
Agriculture
244
9392
1492
924
130
113
12,295
Habitation
247
0
0
302
3
53
605
Total area (histogram Value)
3066
10,612
18,912
2340
229
217
35,376
Total area (km2)
3.2
10.65
18.92
2.34
0.29
0.21
35.61
3.3 Factors responsible for LULC change/land degradation
The anthropogenic stresses were mostly responsible for changes in the LULC pattern of upper catchment area of Narmada river between 1980 and 2018. Our study results point to the increasing anthropogenic stress factors in the study area with land use changes, increase in habitation areas and commercial spaces, degradation of forests and overgrazing of grasslands, problems of siltation and pollutant influx in the river water leading to degradation of water quality as well as decreasing wetland spaces (Fig. 9). This has resulted in steady biodiversity loss in the area during the last few years. The increase in habitation areas have also resulted in overexploitation of river water for domestic as well as commercial purposes. Wastewater is added back to the system without any treatments leading to deterioration of water quality. Freshwater resources have depleted in the area steadily. Groundwater contamination is another emerging issue from the study area concerned. Therefore, the current holistic study was much needed.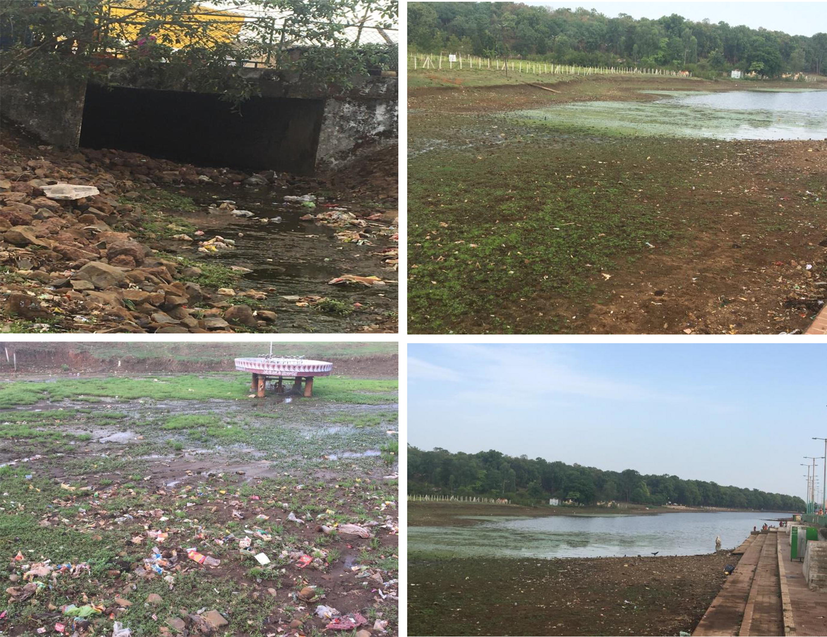
Images from Study Area: Deterioration of health of Narmada River.
3.4 Spatio-temporal comparison of Digital Elevation Models (DEMs)
In order to examine the increase in spatial resolution of satellite images from Landsat 4 to Landsat 7 (30 m), middle and high resolutions images from Landsat 8 and Resourcesat 2A (15 m and 5.8 m) of Digital Elevation Models, the attraction model was used. The results of the models for 30 m, 30 m, 30 m, 15 m and 5.8 m are illustrated in Fig. 10. The association of DEMs (1980, 1988, 1998, 2008 and 2018) as ideas in the attraction models determined that DEM 5.8 m (Resourcesat 2A satellite image) has better spatial resolution than 30 m images of Landsat data series. As is represented in Fig. 8, with the intensification of the value of scale factor, the sub-pixel increases more than principal pixel and variations among the elevation models are shown well. So, it can be concluded that the increases of the scale case lead to the increase in the spatial resolution. DEM helps in creating realistic models of flow patterns and networks of the drainage basin (Pan, et al., 2019). Compared to the original DEM, the computation efficiency has been improved significantly and similar findings were reported earlier (Mokarrama and Hojati, 2017). DEM can be used for increasing spatial resolution of the study area. Previous findings are in agreements with the current study which further authenticate the importance of the study (Pan et al., 2019; Liu et al., 2019).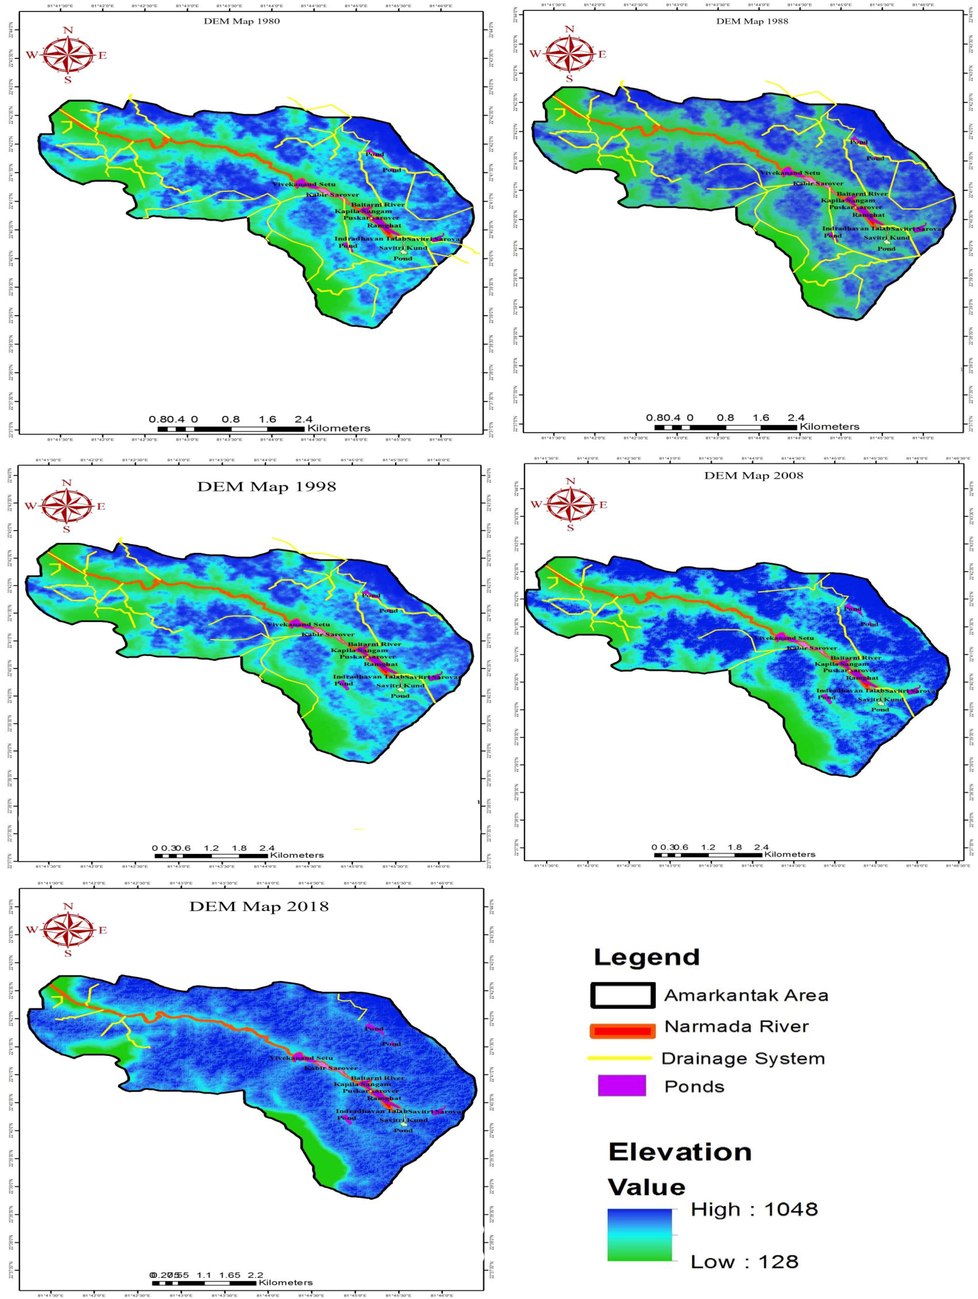
Digital elevation models of the upper catchment area of Narmada River during 1980–2018.
3.5 Diversity of flora found in the upper catchment of Narmada river
Structure and composition of many vegetations, having immense commercial and economic values, have been identified. The tribal communities know the proper use of medicinal plants in health care and other uses. In current study, we reported 157 plants species (herbs, tubers, grasses, climbers) comprising a total of 47 overstorey species and 86 groundstorey vegetation. There were 24 understorey vegetation reported which are traditionally utilized by local tribal communities of upper catchment area of Narmada river (Table 7). The species diversity values of AABR were lower as compared to diversity indices values reported earlier (Thakur, 2018). This study conclusively proves the extinction various plant species due to different kinds of interferences like habitation, degradation, fragmentation, constructions, encroachments, introduction of exotic species and monoculture. Several studies have identified similar ecological consequences in tropical forest ecosystems (Thakur, 2007; Thakur et al., 2014, 2017; Brar et al., 2020). Due to population pressure, forest wealth is over exploited and mixed forests are reducing. There is ever increasing developmental pressure on forest especially upper catchment areas of Narmada River. Adverse impacts of mining are degrading forests as well.
S. No.
Common name
Scientific name
Family
Parts used
Uses
1.
Bel
Aegle marmelos
Rutaceae
Fruit Leaf
Edible, Medicinal, Religious
2.
Dhabda
Anogeissus latifolia
Combretaceae
Stem Resin
House construction, Fuel wood,
Agriculture implement
3.
Mohline
Bauhinia purpurea
Caesalpiniaceae
Leaf Flower
Cup and plate making, Medicinal
4.
Semel
Bombax ceiba
Malvaceae
Fruit Flower
Medicine, Edible
5.
Salei
Boswellia serrata Roxb.
Burseraceae
Resin
Medicine
6.
Chironji
Buchanania lanzan
Anacardiaceae
Fruit seed
Edible
7.
Khakra
Butea monosperma
Fabaceae
Leaf
Cup and plate making
8.
Kumbhi
Careya arborea
Lecythidaceae
Bark
Fish poisoning
9.
Amaltash
Casia fistula
caesalpinaceae
Fruit
Medicinal
10.
Mahalimb
Cedrela toona Roxb.
Meliaceae
Stem
Furniture
11.
Ghiriha
Chloroxylon swietenia
Rutaceae
Stem Bark
House Construction, Agricultural implements, Fuel wood, Fish
12.
Karra
Cleistanthus collinus
Euphorbiaceae
Stem
Furniture
13.
Sita phal
Custard apple
Annonaceae
Fruit Stem
Edible House Construction
Agricultural implements, Fuel wood
14.
Shisham
Dalbergia sisoo
Leguminosae
Stem Leaf
House Construction, Agricultural Implements, Fuel Wood, Medicinal
15.
Gulmohar
Delonix regia
Leguminosae
Stem
Fuel wood
16.
Dhoben
Dillenia pentagyna Roxb.
Dilleniaceae
Root
Medicinal
17.
Tendu
Diospyros melanoxylon Roxb.
Ebenaceae
Fruit Leaf
Edible (When ripe) Selling
18.
Bargad
Ficus benghalensis
Moraceae
Fruit
Edible
19.
Peepal
Ficus religiosa
Moraceae
Whole tree Fruit Leaf
Religious Edible Fodder
20.
Kekad
Garuga pinnata Roxb.
Burseraceae
Stem
Agricultural implements
21.
Lendia
Lagerstroemia parviflora Roxb.
Lythraceae
Stem
Firewood Boundary wall making
22.
Maida
Litsea sebifera
Lauraceae
Bark
Medicinal
23.
Mahua/Guli
Madhuca indica
Sapotaceae
Flower Fruit Leaf
Edible after cooking Liquor preparation Oil Religious
24.
Aam
Mangifera indica
Anacardiaaceae
Fruit Seed
Edible Edible, medicinal
25.
Munga
Moringa pterygosperma Gaertn.
Moringaceae
Leaf Fruit
Edible Edible
26.
Amla
Phyllanthus emblica
Euphorbiaceae
Fruit Leaf
Edible and medicinal
Cultural and medicinal
27.
Kanji
Pongamia pinnata
Fabaceae
Fruit
Oil extraction
28.
Bija
Pterocarpus marsupium Roxb.
Faabaceae
Stem
House construction Furniture
29.
Kusum
Schleichera trijuga Willd.
Sapindaceae
Fruit
Edible
30.
Bhelwa
Semicarpus anacardium
Anacardiaceae
Fruit
Edible, Medicinal
31.
Sarai
Shorea robusta Gaertn.
Dipterocarpaceae
Stem
House construction, Furniture,
Fuel wood, Tooth brush, oil
32.
Gulhar/kullu
Sterculia urens
Sterculiaceae
Resin Bark
Medicinal
32.
Jamun
Syzygium cumini
Myrtaceae
Stem Fruit Leaf
Cultural, Edible, medicinal
34.
Emli
Tamarindus indica
Caesalpiniaceae
Fruit
Edible, Pickle preparation,
Medicinal, Selling
35.
Sagaun
Tectona grandis
Lamiaceae
Stem Leaf
House construction, Furniture
Furniture, Dona making
36.
Arjun
Terminalia arjuna
Combretaceae
Stem
Firewood, House construction
37.
Beheda
Terminalia bellirica
Combretaceae
Fruit
Medicinal (Digestive)
38.
Harra
Terminalia chebula
Combretaceae
Fruit
Medicinal (Digestive)
39.
Saja
Terminalia tomentosa
Combretaceae
Stem
House construction, Fuel wood, Used during marriage
40.
Kala Umbar
Ficus hispida L.f.
Moraceae
Fruits
Fruits, vegetable
41.
Alu Bukhara
Flacourtia indica (Burm.f.) Merr.
Salicaceae
Fruit
Fruit - raw or cooked
42.
Phalsa
Grewia asiatica L
Malvaceae
Fruit
The fruit can be eaten raw,
43.
Jungli sami, Khejri
Prosopis cineraria
Fabaceae
Fruit
Leaves and fruit eaten
44.
Kadam
Anthocephalous kadamba
Rubiaceae
Fruits
Ripe fruits eaten
45.
Kaji, Kinu
Bridelia retusa (L.) A.Juss
Phyllanthaceae
Fruit, Bark, Flowers
Ripe fruit pulp
46.
Wild kajur
Phoenix sylvestris (L.) Roxb.
Arecaceae
Fruit
Ripe fruits eaten
47.
Neem
Azadirachta indica A.Juss.
Meliaceae
Fruit
Pulp of ripe fruits eaten
48.
Ghughch
Abrus precatorius
Fabaceae
Leaves
Mouth freshener
49.
Bans
Bambusa bamboo
Poaceae
Seeds
mix into flour
50.
Chakor
Cassia tora
Caesalpiniaceae
Pod and seed
Vegetable
51.
Ratan jot
Jathropa curcus
Euphorbiaceae
Seed, Whole plant
Biofuel, Substitute of candle Bio-fencing
52.
Lantana
Lantana camara
Verbenaceae
Ripen fruits Whole plant
Edible Bio-fencing
53.
Khajuri
Phoenix sylvestris
Arecaceae
Ripen fruits
Edible.
54.
Mainhar
Randia dumetorum
Rubiaceae
Leaf Root
Vegetable Medicinal
55.
Arandi
Ricinis communis
Euphorbiaceae
Seed
Oil
56.
Nirgundi
Vitex nigundo
Verbenaceae
Leaf
Medicinal
57.
Ber
Zizipus zilopyrus
Rhamnaceae
Fruit
Edible
58.
Aak
Calotropis gagentia
Musaceae
Leaf & flower
Offer to god
59.
Banana
Musa paradisca
Lythraceae
Whole tree
Religious use
60.
Mehandi
Lawsonia irnemis
family
Leaf
Dye
61.
Sitaphal
Annona squamosa L.
Annonaceae
Fruit
Ripe fruits eaten
62.
Karonda
Carissa carandas L.
Apocynaceae
Fruit
Ripe fruits eaten & pickled
63.
Chota ber
Zizyphus martuiana Lam
Rhamnaceae
Fruit
Ripe fruits eaten
64.
Dhavai
Woodfordia floribunda (L.). Kurz.
Lytharaceae
Flowers
Flowers are eaten as food
65.
Raimuniya
Lantana camara L.
Verbenaceae
Fruit
Ripe fruits eaten
66.
Makora
Ziziphus oenophylla Lam.
Rhamnaceae
Fruits
Eaten by children
67.
Kathber, Baraber
Ziziphus xylopyrus (Retz.) Willd.
Rhamnaceae
Fruits
Eaten and used as drug
68.
Bilangada
Flacourtia indica (Burm.f.) Merr.
Salicaceae
Fruits
Raw eaten or cooked
69.
Kiraman
Grewia rothii DC.
Malvaceae
Bark
Medicinal
70.
Beli
Limonia crenulata (Roxb.) Roem
Rutaceae
Fruit
Eaten
71.
Munya
Meyna spinosa Roxb.
Rubiaceae
Fruit
Raw eaten
72.
Gajar ghas
Parthenium hysterophorus L.
Asteraceae
Seeds
Medicinal
73.
Kubbi
Ageratum conyzoide L.
Asteraceae
Leaves
Medicinal
74.
Kurie
Bidens pilosa L.
Asteraceae
Leaves
Medicinal
75.
Safed munga
Celosia argentea L.
Amaranthaceae
Leaves, Fruit
Medicinal & Vegetable
76.
Bhrangraj
Eclipta alba) Hassk. L)
Asteraceae
Oil
Medicinal
77.
Kutki
Panicum antidotale Retz.
Poaceae
Leaves
Food
78.
Grass lily
Iphigenia indica.L) A. Gray ex Kunth)
Poaceae
Leaves
Fodder
79.
Meethi buti
Scoparia dulcis L.
Plantaginaceae
Leaves, Seeds
Medicinal
80.
Naichi bhaji
Smithia conferta Sm.
Fabaceae
Leaves
Vegetable
81.
Kanghi
Blainvillea acmella (L.) Philipson
Asteraceae
Leaves
Medicinal
82.
Soli
Aeschynomene americana L.
Leguminosae
Seeds/grains
Grain edible
83.
Dudhali
Sopubia delphinifolia G.
Scrophulariaceae
Leaves, Seeds
Medicinal
84.
Akarkara
Spilanthes paniculata Wall. ex DC.
Asteraceae
Inflorescences
Medicinal
85.
Bhui amla
Phyllanthus niruri L.
Euphorbiaceae
Whole plants
Medicinal
86.
Doodhi
Euphorbia heterophylla Des F.
Euphorbiaceae
Leaves
Medicinal
87.
Pulpuli grass
Arthraxon hispidus (T. Makino)
Poaceae
Leaves
Fodder
88.
Satawar
Asparagus racemosus Willd.
Liliaceae
Roots/Tubers
Medicinal
89.
Haddi mushli
Chlorophytum borivilianum Santapau & R. R. Fern.
Asparangaceae
Tubers
Medicinal
90.
Ghughunia
Crotalaria retusa L.
Leguminosae
Leaves
Food
91.
Pihri chara
Mecardonia procumbens Mil Small
Scrophulariaceae
Leaves
Fodder
92.
Satparni
Desmodium gangeticum L.
Fabaceae
Leaves
Medicinal
93.
Kharatti
Sida acuta Burm. f.
Malvaceae
Leaves
Medicinal
94.
Sitab
Ruta graveolens L.
Rutaceae
Leaves
Medicinal
95.
Mameera
Thalictrum foliolosum DC.
Rananculaceae
Leaves
Medicinal
96.
Bathua bhaaji
Chenopodium album L.
Chenopodiaceae
Leaves
Vegetable
97.
Patthar choor
Plectranthus mollis (A) Spreng.
Lamiaceae
Roots/Tubers
Medicinal
98.
Bariyari
Sida cordata (Burm. f.) Borss. Waalk.
Malvaceae
Leaves
Medicinal
99.
Hirankhuri
Emilia sonchifolia (L.) DC. ex DC.
Asteraceae
Fruits
Medicinal
100.
Badranj boya
Nepeta cataria L.
Lamiaceae
Seeds
Medicinal
101.
Kevkand
Dioscorea bulbifera L.
Dioscoreaceae
Suckers/Tuber
Medicinal
102.
Kali mushli
Curculigo orchioides Gaertn
Agavaceae
Suckers/Roots
Medicinal
103.
Tinpaniya
Oxalis corniculata L.
Oxalidaceae
Leaves
Medicinal & Vegetable
104.
Maskani
Evolvulus nummularius L
Convolvulaceae
Leaves
Medicinal
105.
Chanchu
Corchorus fascicularis Lam.
Tiliaceae
Leaves
Food
106.
Kena
Commelina diffusa Burm. f.
Commelinaceae
Roots/tubers
Medicinal
107.
Kharmor
Rungia pectinata L.
Acanthaceae
Leaves/shoots
Medicinal
108.
Ghueen
Fimbristylis littoralis Gaudich.
Cyperceae
Roots/leaves
Medicinal
109.
Nagar motha
Cyperus gracilis R. Br.
Poaceae
Leaves, roots
Fodder and Commercial products
110.
Bufalo grass
Paspalum conjugatum P. J. Bergius
Poaceae
Leaves
Fodder
111.
Baiga sikiyab
Digitaria divaricatissima R. B) Hughes)
Poaceae
Leaves
Fodder
112.
Jangli marua
Eleusine indica) Gaert).
Poaceae
Leaves
Fodder
113.
Dokar bel
Vitis carnosa Lam Wall.
Vitaceae
Leaves/Fruits
Medicinal
114.
Chhuimui
Mimosa pudica L.
Fabaceae
Leaves
Medicinal
115.
Nuniya bhaji
Portulaca oleracea L.
Portulaceae
Leaves
Vegetable
116.
Kanthkari
Solanum xanthocarpum Schrad. & H. Wendl.
Solanaceae
Leaves
Medicinal
117.
Jungli sama
Echinochloa colona Link
Poaceae
Seeds grains
Grain edible
118.
Amti
Solanum nodiflorum Jacq.
Solanaceae
Fruits
Vegetable
119.
Chirchita
Achyranthes aspera L.
Amaranthaceae
Seeds, leaves
Medicinal
120.
Ghooma
Leucas aspera Willd
Lamiaceae
Leaves
Vegetable
121.
Kaniya kanda
Dioscorea oppositifolia L.
Dioscoreaceae
Tubers
Medicinal
122.
Chench
Corchorus trilocularis L.
Tiliaceae
Leaves
Vegetable
123.
Chanahur
Marsdenia tenacissima Roxb.
Asclepiadaceae
Leaves
Vegetable
124.
Van rai
Blumeopsis flava D Gagnep.
Asteraceae
Seeds, Leaves
Medicinal, vegetable
125.
Tikhur
Curcuma angustifolia Roxb.
Zingiberaceae
Tuber
Medicinal
126.
Mandukparni
Centella asiatica L.
Apiaceae
Leaves
Medicinal
127.
Ghuia
Colocasia esculenta L Schott.
Araceae
Leaves, Rhizomes
Vegetable
128.
Kev kand
Costus specios J. Koen Sm.
Zingiberaceae
Tuber
Medicinal
129.
Amahaldi
Curcuma amada Roxb.
Zingiberaceae
Tuber
Medicinal
130.
Jungli dhania
Eryngium foetidum L.
Apiaceae
Leaves, Seeds
Vegetable
131.
Bisakhpara
Boerhavia procumbens Banks ex Roxb.
Nyctaginaceae
Leaves
Vegetable
132.
Badi dudhi
Euphorbia hirta L.
Euphorbiaceae
Leaves
Medicinal
133.
Chhoti dudhi
Euphorbia macrophylla Pax
Euphorbiaceae
Leaves
Medicinal
134.
Bara
Flemingia chappar Benth.
Fabaceae
Shoots
Lac
135.
Bedarikand
Coccinia grandis Voigt
Cucurbitaceae
Climber
Edible
136.
Kalihari
Gloriosa superba L.
Colchicaceae
Climbers, Flower
Medicinal
137.
Kheksa
Momordica dioica Roxb
Cucurbitaceae
Climber
Vegetable
138.
Karmata
Ipomoea aquatica Forssk.
Convalvulaceae
Leaves
Vegetable
139.
Jungle kevanch
Mucuna pruriens L.
Papilionaceae
Seeds
Medicinal
140.
Jangli pyaj
Urginea indica Roxb
Liliaceae
Tuber
Medicinal
141.
Chirula
Aerva lanata L.
Amaranthaceae
Leaves
Medicinal
142.
Chirinya
Peristrophe roxburghiana Roem & Schult
Acanthacea
Leaves
Medicinal
143.
Garundi
Alternanthera sessilis L.
Amaranthaceae
Leaves
Medicinal
144.
Jungli rye
Sisymbrium nigrum Prantl
Cruciferae
Seeds
Vegetable
145.
Jangli Tulsi
Ocimum gratissimum L.
Lamiaceae
Seeds, Leaves, Inflorescences
Medicinal
146.
Chirpoti
Physalis minima L.
Solanaceae
Fruits
Fruit edible
147.
Sarpgandha
Rauvolfia serpentine L Benth. ex Kurz
Apocynaceae
Seeds
Medicinal
148.
Sadabahar
Catharanthus roseus L G. Don
Apocynaceae
Flowers
Medicinal
149.
Brahmi
Bacopa monnieri L Wettst.
Plantaginaceae
Whole plants
Medicinal
150.
Tulsi
Ocimum sanctum L.
Lamiaceae
Seeds, Leaves, Inflorescences
Medicinal, Religious use
151.
Chirayta
Swertia alba T. N. Ho & S. W. Liu
Gentianaceae
Whole plants
Medicinal
152
Aswagandha
Withania somnifera Dunal
Solanaceae
Suckers, leaves
Medicinal
153.
Chand kal
Macaranga peltata Roxb Müll. Arg.
Euphorbiaceae
Leaves
Medicinal
154.
Chaulai
Amaranthus spinosus L.
Amaranthaceae
Leaves
Vegetable
155.
Tiger lily
Belamcanda chinensis L. DC.
Iridaceae
Tubers
Medicinal
156.
Buch
Acorus calamus L.
Acoraceae
Rhizomes, Oil
Medicinal
157.
Mandukparni
Centella asiatica L.
Plantaginaceae
Whole plants
Medicinal
4 Conclusion
The study infers that satellite based remote sensing and GIS techniques are indeed the most reliable tools for the characterization of land use along the river basin of the concerned study area. One of the most important features of Narmada and its tributaries such as Gayatri, Savitri, Kapila, Baitarini, Arandi emerging from Amarkantak region is that all of them are fed by rain water. Ample rainfall is therefore positively correlated to the existence of these rivers which develops the core idea of sustenance in the region. These rivers originate from Maikal mountain range are under threat due to natural as well as anthropogenic causes as listed above. Holistic development guided by eco-restoration strategies is the need of the hour. Lack of monitoring and scientific approaches can bring a death blow to these rivers. The upper zone of the Narmada is very important from ecological viewpoint and needs urgent attention. The entire riparian ecosystem is dependent on good forest cover for sustainability. Vegetation mapping using NDVI reveals shrinking forest cover and degradation in forest health over the years. The anthropogenic stress factors such as increase in commercial zones, utilization of river water for irrigation purposes, agricultural run-off, industrial effluents, domestic exploitation of water resources, municipal sewage and sludge mixing with flowing water are the major factors behind the degradation of forest health which is causing negative impact on the entire environment. LULC analysis also supports these findings.
The study also reveals that Digital Elevation Model (DEM) is very useful in studying the topography within a GIS environment. Geomorphic analysis of an area is based on the systematic study of present-day landforms which can be related to their origin, nature, development, geologic changes and their relationship with other underlying structures. The technology has been effectively and economically used in the analysis and inventory of basin area development and management. The scientific investigation proves the vulnerability of Narmada and her tributaries. Relief ratio, ruggedness number and visual interpretation of the DEM of the study area indicate moderate to high relief, low run off and high infiltrations with the early mature stage of erosion.
The identification of rare, endangered and threatened species is essential for prioritization of conservation in the upper catchment area of Narmada. Application of geospatial techniques will be exploited for the expansion of spatial data sets that is quite necessary for the conservation of the forest ecosystem with sustainable approach. Further, the field surveys in selected villages help in gathering information on ground realities of socio-economic status and also traditional methods, and uses of forests produces. Finally, the study documented a total of 157 species potentially exploited and utilized by aboriginal communities of upper catchment area of Narmada in Central India. Study highlighted the unsustainable and overexploitation of resources leading to forest degradation as well. Therefore, appropriate management interventions were suggested to conserve the susceptible species as well as associated rivers of Narmada by involving the indigenous communities.
Acknowledgement
The authors are grateful to Indira Gandhi National Tribal University, Amarkantak, MP, India for continuous support and encouragement to carry out research work and the researchers and farmers involved in this study are deeply acknowledged for their support and cooperation. We are thankful to the anonymous reviewers for improving the quality of this manuscript. This research was supported by Researchers Supporting Project number (RSP-2020/249), King Saud University, Riyadh, Saudi Arabia.
Declaration of Competing Interest
The authors declare that they have no known competing financial interests or personal relationships that could have appeared to influence the work reported in this paper.
References
- Comparative analysis of pixel-based and object-based classification of high-resolution remote sensing images - a review. Int. J. Eng. Trends Technol.. 2016;38:5-11.
- [Google Scholar]
- Effects of dynamic land use/land cover change on water resources and sediment yield in the Anzali wetland catchment, Gilan, Iran. Sci. Total Environ.. 2020;712:136449.
- [CrossRef] [Google Scholar]
- Object-based land-use/land-cover change detection using Landsat imagery: a case study of Ardabil, Namin, and Nir counties in northwest Iran. Environ. Monit. Assess.. 2018;190(7)
- [CrossRef] [Google Scholar]
- Urban growth in Latin American cities: exploring urban dynamics through agent-based simulation.. London: University of London; 2004. Doctoral Thesis
- Comparison of object and pixel-based land cover classification through three supervised methods. J. Geodasy, Geoinf. Land Manage. 2017
- [Google Scholar]
- A review of assessing the accuracy of classifications of remotely sensed data. Remote Sens. Environ.. 1991;37:35-46.
- [Google Scholar]
- Global land cover classifications at 8 km spatial resolution: the use of training data derived from Landsat imagery in decision tree classifiers. Int. J. Remote Sens.. 1998;19(16):3141-3168.
- [CrossRef] [Google Scholar]
- Continuous fields of vegetation characteristics at the global scale. J. Geophys. Res.. 1999;104:16911-16925.
- [Google Scholar]
- Land-use and land-cover change in Lake Ziway watershed of the Ethiopian Central Rift Valley Region and its environmental impacts. Land Use Policy. 2020;96:104682.
- [CrossRef] [Google Scholar]
- Quantification and mapping of fragmented forest landscape in dry deciduous forest of Burdwan Forest Division, West Bengal, India. Trees, For. People. 2020;2(2020):100012
- [Google Scholar]
- Monitoring and predicting land use/cover changes in the Aksu-Tarim River Basin, Xinjiang-China (1990–2030) Environ. Monit. Assess.. 2019;191(8)
- [CrossRef] [Google Scholar]
- A case study of land cover change (1950–2003) and runoff in a Mediterranean catchment. Appl. Geogr.. 2012;32(2):810-821.
- [CrossRef] [Google Scholar]
- Ndvi: vegetation change detection using remote sensing and Gis – a case study of Vellore District. Procedia Comput. Sci.. 2015;57:1199-1210.
- [CrossRef] [Google Scholar]
- Impact of climate change on extreme rainfall events and flood risk in India. J. Earth Syst. Sci.. 2011;120(3):359-373.
- [CrossRef] [Google Scholar]
- Impacts of land use and land cover change on surface runoff, discharge and low flows: Evidence from East Africa. Hydrol. Reg. Stud.. 2018;15:49-67.
- [Google Scholar]
- Change detection in the water bodies of Burullus Lake, Northern Nile Delta, Egypt, using RS/GIS. In: Proceedings of the Twelfth International Conference on Hydro Informatics, HIC 2016. Procedia Engineering. 2016. p. :936-942.
- [Google Scholar]
- A web GIS based integrated flood assessment modeling tool for coastal urban watersheds. Comput. Geosci.. 2014;64:7-14.
- [CrossRef] [Google Scholar]
- Land-use/land-cover changes and their influence on the ecosystem in Chengdu City, China during the period of 1992–2018. Sustainability.. 2018;10:3580.
- [CrossRef] [Google Scholar]
- Automatic water shed delineation in the Tibet an endorheic basin: Alake oriented approach based on digital elevation models. Geomorphology. 2019;358(2020):107127
- [Google Scholar]
- A strategy for estimating the rates of recent united states land-cover changes. Photogramm. Eng. Remote Sens.. 2002;68:1091-1099.
- [Google Scholar]
- Land use and land cover change detection using geospatial techniques in the Sikkim Himalaya, India. Egypt. J. Remote Sens. Space Sci.. 2020;23(2):133-143.
- [CrossRef] [Google Scholar]
- Mokarrama, M. and Hojati, M. 2017. Morphometric analysis of stream as one of resources for agricultural lands irrigation using high spatial resolution of digital elevation model (DEM). Computers and Electronics in Agriculture. Volume 142, Part A, November, 190–200.
- Evaluation of vertical accuracy of open source Digital Elevation Model (DEM) Int. J. Appl. Earth Obs. Geoinf.. 2013;21:205-217.
- [Google Scholar]
- Olmanson, L.G., Bauer, M.E., 2016. Improved land cover classification by integrating Landsat imagery with Lidar and object-based image analysis for land cover classification of the international lake of the woods/rainy river basin. <http://lps16.esa.int/posterfiles/paper2097/Landcoverposter32_40_final.pdf>.
- MATLAB-based digital elevation model (DEM) data processing toolbox (MDEM) Environ. Modell. Software 2019
- [CrossRef] [Google Scholar]
- Comparison of pixel-based and object-oriented classification methods for extracting built-up areas in arid zone. In: ISPRS Workshop on Updating Geo-Spatial Databases with Imagery & the 5th ISPRS Workshop on DMGISs. 2007. p. :163-171.
- [Google Scholar]
- A coefficient of agreement as a measure of thematic classification accuracy. Photogramm. Eng. Remote Sens.. 1986;52(2):223-229.
- [Google Scholar]
- Quantitative analysis of drainage basin characteristics. J. Soil Water Conserv. India. 1976;26(1&4):18-25.
- [Google Scholar]
- Remote sensing and GIS for mapping and monitoring land cover and land-use changes in the Northwestern coastal zone of Egypt. Appl. Geogr.. 2007;27(1):28-41.
- [CrossRef] [Google Scholar]
- Land cover classification and change detection analysis of Qaroun and Wadi El-Rayyan lakes using multi-temporal remotely sensed imagery. Environ. Monit. Assess.. 2019;191(4)
- [CrossRef] [Google Scholar]
- Analysis of land use, structure, diversity, biomass production, C and nutrient storage of a dry tropical forest ecosystem using satellite remote sensing, ground data and GIS techniques. Raipur, India: Indira Gandhi Krishi Vishwavidyalaya; 2007. Ph.D. Thesis
- Diversity, composition and structure of understorey vegetation in the tropical forest of Achanakmaar Biosphere Reserve, India. Environ. Sustainability. 2018;1(2):279-293.
- [Google Scholar]
- Traditional Uses and Sustainable Collection of Ethnobotanicals by Aboriginal Communities of the Achanakmaar Amarkantak Biosphere Reserve of India. Front. Environ. Microbiol.. 2017;3(3):39-49.
- [Google Scholar]
- Land use land cover change detection through geospatial analysis in an Indian Biosphere Reserve. Trees, For. People. 2020;2:100018.
- [CrossRef] [Google Scholar]
- Composition, structure & diversity characterization of dry tropical forest of chhattisgarh using satellite data. J. For. Res.. 2014;25(4):819-825.
- [Google Scholar]
- Post classification comparison change detection of Guangzhou Metropolis, China. Key Eng. Mater.. 2011;467(469):19-22.
- [CrossRef] [Google Scholar]
- Impacts of land use–land cover change and urbanization on flooding: a case study of Oshiwara River Basin in Mumbai, India. CATENA. 2016;145:142-154.
- [CrossRef] [Google Scholar]


