

Translate this page into:
Identification of metabolic pathways involved in the biotransformation of eslicarbazepine acetate using UPLC-MS/MS, human microsomal enzymes and in silico studies
⁎Corresponding author. drasifhusain@yahoo.com (Asif Husain), shahalam@nu.edu.om (Shah Alam Khan)
-
Received: ,
Accepted: ,
This article was originally published by Elsevier and was migrated to Scientific Scholar after the change of Publisher.
Peer review under responsibility of King Saud University.
Abstract
In the last few decades, metabolite identification and detection have become an integral component of drug discovery process. The detection and depiction of an identified metabolite is significant for the development of safe and effective therapeutic agents as these metabolites may be pharmacologically active or toxic in nature. A (UPLC-MS/MS) method was developed for the quantification of eslicarbazepine acetate metabolite (M3), cis-10,11-dihydro-5H-dibenz[b,f]azepine-10,11-diol, in rat plasma. Eslicarbazepine acetate was extracted from rat plasma by precipitation technique using acetonitrile as a precipitating solvent. Chromatographic separation was accomplished using acetonitrile-0.01 M potassium dihydrogen phosphate (60:40, v/v) as mobile phase at a flow rate of 0.2 ml/min on Waters Acquity BEH 150 × 2.1 mm, 1.7 µm, C18 column at 30˚ C. The linearity of the calibration curve was 5–100 ng/ml for metabolite M3. The overall intra- and inter-day precision did not exceed 3%. In silico, in vitro and in vivo approaches have been used to facilitate the detection and depiction of eslicarbazepine acetate metabolites. MetabolExpert was used to predict the probable metabolites of the compounds. Metabolite of eslicarbazepine acetate was identified using human liver microsomes.
Keywords
Eslicarbazepine acetate
MetabolExpert
Human liver microsomes
LC-MS/MS

1 Introduction
Eslicarbazepine acetate (ECA) is a new third generation antiepileptic drug (Iram et al., 2017). It’s chemical name is [(S)-5 carbamoyl-10, 11-dihydro-5H-dibenzo[b,f]azepin-10-yl acetate]. European Medicines Agency and US Food and Drug Administration in 2009 and 2013, have recommended using ECA as a supportive therapy along with the front line antiepileptic drugs to treat refractory partial-onset seizures in adult patients (Tambucci et al., 2016). Once ECA is administered orally, it is metabolized by first pass hydrolysis pathway and produces two metabolites, R-licarbazepine and S-licarbazepine (Leslie et al., 2020). S-licarbazepine, commonly called eslicarbazepine, is the main metabolite representing 95% of the circulating active metabolites (Ben-Menachem et al., 2010). Eslicarbazepine shows anticonvulsant activity (Soares-da-Silva et al., 2015). Additionally, R-licarbazepine also exhibits anticonvulsant activity but S-licarbazepine is more effective than R-licarbazepine (Alves et al., 2008). Previously published in vitro studies did not reveal any significant inhibitory effects of ECA on the activities of various important cytochrome P450 (CYP450) metabolizing enzymes (Johannessen Landmark et al., 2016).
Drug metabolizing enzymes have been an outburst and a fruitful area in the discovery and development of drugs. The metabolic fate of new chemical entities can be determined and characterized by various techniques (Dalmadi et al., 2003; Dams et al., 2003; Siddiqui et al., 2017; Al Othman et al., 2013; Rahman et al., 2006). A hyphenated technique such as LC–MS/MS has been employed to quantify the xenobiotics metabolites (Du et al., 2020; Gonzalez-Sepulveda et al., 2020; Xu et al., 2019). Iram et al. (2018) have developed a UPLC-PDA method for the determination of ECA (Iram et al., 2018). Recently, Li et al., in 2019 validated a LC-MS/MS method and utilized it for the estimation of ECA in the human plasma (Li et al., 2019). Human liver microsomes in vitro method plays an imperative role in optimizing the metabolic properties in a new chemical moiety (NCE) in the drug discovery process (Szultka-Mlynska and Buszewski, 2016). Phase I oxidation of lipophilic substrates is catalyzed by various enzymes like CYP450, alcohol dehydrogenase, aldehyde oxidase, xanthine oxidase, etc. However, CYP P450 is considered as the most significant and important in metabolic pathways of xenobiotics (Raunio et al., 2015; Kops et al., 2020; Rainone et al., 2015). The in vitro studies not only give the picture of metabolic pathways but also help in development or elucidation of toxicological and clinical studies (Nordmeier et al., 2019; Pelkonen et al., 2005). The in silico studies predict the target for a dataset which also includes cytotoxic compounds. The pathway is predicted based on the compounds complementing the activities of enzymes involved in the cell cycle progression as well as in the protection against foreign chemical compounds (Plant, 2004; Brandon et al., 2003; Cortes-Ciriano et al., 2013). Firstly, in silico screening was done based on the prediction of inhibition constant (Ki) followed by primary in vitro screening via CYPs assays. After this, secondary in vitro screening with human liver microsomes and hyphenated technique LC-MS/MS assays were carried out. Finally, in vivo animal studies are performed to evaluate the potency of the predicted metabolites.
The purpose of this work was to detect and depict the phase I metabolites of eslicarbazepine acetate by in silico, in vitro and in vivo studies using human liver microsomes and LC/MS technique.
2 Experimental
2.1 Chemicals and reagents
ECA pure drug sample was gifted generously by Arbro Pharmaceuticals Pvt. Ltd (New Delhi, India). Metabolite (M3) cis-10,11-dihydro-5H-dibenz[b,f]azepine-10,11-diol was purchased from Sigma Aldrich Co. (USA). Acetonitrile and methanol of analytical grade were purchased from Merck (Germany). Pooled human liver microsomes of mixed gender from 50 donors were purchased from Sekisui Xeno Tech (Kansas City, KS, USA). Nicotinamide adenine dinucleotide phosphate (NADPH) reduced tetra sodium salt was supplied by Sisco Research Laboratories, (India). Ammonium acetate, dipotassium hydrogen phosphate (K2HPO4), potassium dihydrogen phosphate (KH2PO4), MgCl2 and EDTA were all procured from Merck (Germany). Analytical grade chemicals and materials were used throughout the study.
For animal experimental studies, a prior approval of the Institutional Animal Ethics Committee (IAEC) of Jamia Hamdard, New Delhi, India (approval number 1464) was obtained. The carcasses of animals were deposited to the Central Animal House Facility in a yellow polythene bag and finally handed over to Biotic Waste Solutions Pvt. Ltd (New Delhi, India) for safe disposal and waste management.
2.2 Instrumentation
2.2.1 Ultra performance liquid chromatography
Analysis of ECA in plasma was carried out using UPLC Waters Acquity system (Waters Corporation, USA) fitted with a photodiode array (PDA) detector. Empower software was used to acquire and process the obtained signals. Waters Acquity BEHC18 column (1.7 µm, 2.1 × 150 mm) was employed to separate the analytes using acetonitrile-0.01 M potassium dihydrogen phosphate (60:40, v/v) as mobile phase at 0.2 ml/min flow rate and 30˚C column temperature. The injection volume was 5 µl and the elution was monitored at 215 nm wavelength. Mobile phase was filtered using Millipore membrane filter (0.45 µm).
2.2.2 Mass spectrometry
Waters Quadrupole-time of flight-mass spectrometer (Q-TOF-MS) was used for mass spectrometry. The resolution of the system was 8600 mass. The data were analyzed using MassLynx V 4.1 software. The system scan time and inter-scan delay were 1.0 min and 0.02 s, respectively.
2.2.3 Other
Sigma 3–16 KL (Germany) refrigerated centrifuge and SpeedVac concentrator (Savant Instrument, Inc., (New York, USA) were used.
2.3 Preparation of standard stock and quality control (QC) samples for microsomal studies
The ECA and M3 stock solutions (1 mg/ml) were prepared in methanol. The calibration standard solutions of ECA (50–1000 ng/ml) were obtained by spiking working standard solutions into the incubation mixture (90 μl of pooled human liver microsomes with 10 μl of working standard solution). For the calibration standards of metabolite (M3), its working standard solutions were spiked into the drug free rat plasma QC samples for ECA and M3 at low 150 ng/ml & 15 ng/ml (LQC), medium 450 ng/ml & 45 ng/ml (MQC) and high 800 ng/ml & 80 ng/ml (HQC) respectively were made separately by spiking the rat plasma.
2.4 Sample preparation
For the extraction of ECA from rat plasma, protein precipitation technique was used. To 100 μl aliquot of rat plasma, 5 ml of acetonitrile as the protein precipitating solvent was added and centrifuged (4 °C) for 10 min at 3500 rpm. The supernatant (3 ml) was taken out, dried in speedvac concentrator and finally reconstituted with 100 µl of mobile phase containing acetonitrile (CH3CN)-0.01 M KH2PO4 (60:40, v/v) and then analyzed using UPLC-MS/MS.
2.5 In vitro metabolic study
To estimate metabolic stability, pooled human liver microsome system was selected to metabolize ECA. The reaction was performed by mixing 0.5 mg protein/ml microsomes, 100 mM phosphate buffer solution of pH 7.4, 5 mM MgCl2, 2 mM NADPH and drug (50 μM ECA) in a volume of 500 μl. After 10 min pre-incubation in Bench top Lab-Line shaker, the enzyme reaction was commenced when NADPH was added. The ECA reaction was ceased at the different time intervals (0, 15, 30, 45, 60, 90 and 120 min) by the addition of ice cold methanol which contained internal standard (200 ng/ml). The sample was withdrawn and centrifuged for 10 min at 3500 rpm at 4 °C. Further, the supernatant was dried in speedvac concentrator and the dried residue was dissolved in 100 μl of mobile phase for UPLC analysis. Control samples were developed in the same way but before starting the biotransformation reaction, the enzymes were inactivated by adding 5% phosphoric acid solution in microsomes.
2.6 In vivo pharmacokinetic study
The in vivo oral pharmacokinetic study of ECA metabolite M3 was done on Wistar rats. ECA (50 mg/kg dose) in sodium carboxy methyl cellulose suspension (Na CMC 0.25% w/v) was administered orally to Wistar Albino rats (n = 5; either sex; weight range 210–230 g). Blood samples (∼150 μl) from the retro-orbital plexus of Wistar Albino rats were collected in heparinised tube under light ether anaesthetic condition after the time interval of 0.5, 1, 2, 3, 4, 5, 8, 10, 12 and 24 h. The blood samples were subjected to centrifugation at a temperature of 4 °C for 10 min with 14000 rpm and the obtained plasma were stored at −20 °C till the day of analysis.
2.7 In silico study of metabolites
MetabolExpert (CompuDrug International, Inc., Florida, USA) computational method was utilized to predict the probable metabolites of the ECA. The potential metabolites were predicted on the basis of steric possibilities and metabolic alteration. .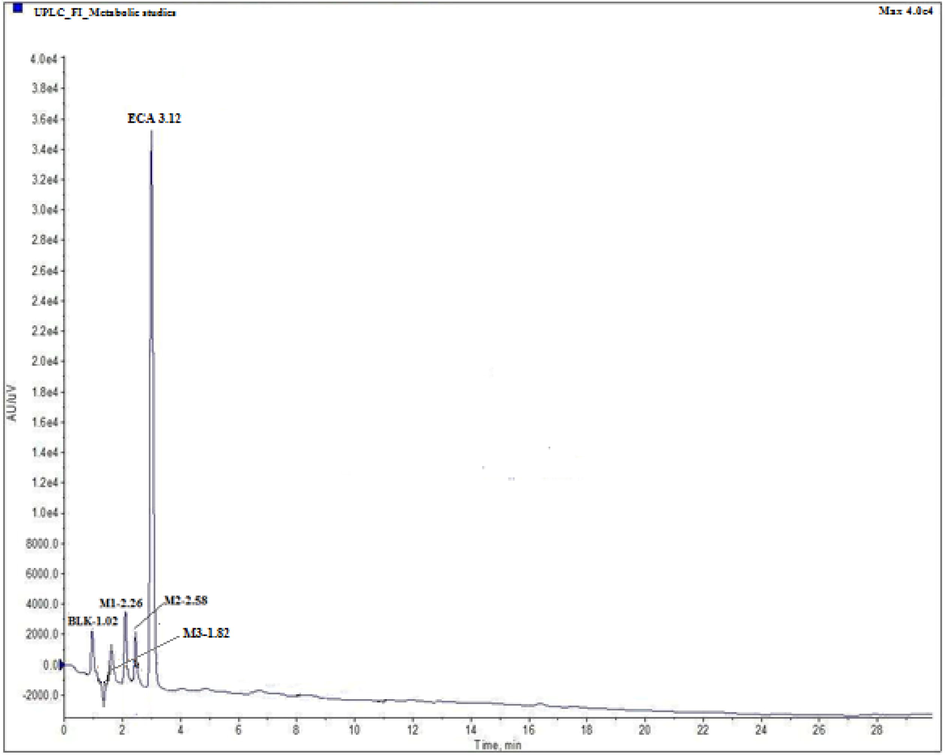
UPLC chromatogram of ECA and its metabolites in a mixture of miocrosomal preparations.
2.8 Method validation for metabolites
The developed bioanalytical method for the estimation of metabolite (M3) in the rat plasma was validated for selectivity, reliability and reproducibility as per FDA guidelines. The parameters evaluated for method validation include precision, accuracy, recovery, linearity, matrix effect and stability.
2.8.1 Selectivity (specificity)
For selectivity analysis, six samples of blank matrix were processed and peak area was recorded. Six aliquots from rat plasma samples were selected and analyte (LQC: 15 ng/mL; MQC: 45 ng/mL; HQC: 80 ng/mL) was spiked and peak area of interest was calculated.
2.8.2 Precision and accuracy
For evaluation of intra-and inter-day precision and accuracy, M3 was estimated six times at various QC levels (LQC: 15 ng/mL, MQC: 45 ng/mL, HQC: 80 ng/mL). The percentage of coefficient of variation (CV%) and relative error (%) were calculated.
2.8.3 Recovery
The recovery (%) of an analyte was evaluated by comparing the peak areas of extracted samples at different concentrations (LQC, MQC, HQC) with peak areas of un-extracted aqueous standard samples.
2.8.4 Linearity range (calibration curve)
Peak area ratio was plotted against the calibration standards in the concentration range of 5–100 ng/mL to obtain the calibration curve. OriginPro 6.1 Software (USA) (Azmi et al., 2020) was used for regression analysis of calibration data.
2.8.5 Matrix effect
The matrix effect of analyte, alteration of the response due to the presence of unintended interfering substances, was evaluated using concentration levels: LQC (15 ng/mL), MQC(45 ng/mL) and HQC(80 ng/mL).
2.8.6 Stability
2.8.6.1 Stock solution stability
The mean peak area of samples (which were prepared earlier and stored in refrigerated temperature) was assessed against the mean peak area of freshly prepared stock samples (comparison samples).
2.8.6.2 Freeze thaw stability
Stability of samples frozen at −70 °C for at least 12 h was compared with freshly prepared samples.
2.8.6.3 Bench top stability
The drug stability in the plasma at the room temperature was evaluated by keeping the samples for 4–24 h at room temperature.
2.8.7 Statistical analysis
WinNonlin Version 5.1 (Pharsight Corporation, USA) software was used for the evaluation of pharmacokinetics parameters.
3 Results and discussion
3.1 UPLC-MS/MS method development and optimization
For the purpose of optimization of the chromatographic conditions to separate all the analytes, ECA and its metabolites (M1,M2,M3) individually and combined solution (microsomal sample) were directly injected in HPLC system and different volume ratios of acetonitrile-0.01 M potassium dihydrogen phosphate were tested as mobile phase. At room temperature (30 °C), using acetonitrile-0.01 M KH2PO4 (60:40, v/v) solution as mobile phase and 0.2 ml/min as flow rate, all analytes (ECA, M1, M2 and M3) were separated well. Retention time (RT) and relative retention time (RRT) of ECA and its metabolites are shown in Table S1 (Supplementary material) and illustrated in Fig. 1.
3.2 Mass spectrometry
Mass spectrometric analysis of ECA and it metabolites was carried out in electron spray ionization (ESI) condition. For optimization, full scans were performed in positive ion detection mode and sample was introduced by direct infusion. The peaks for ECA and its new metabolite M3 were obtained at m/z 297.08 amu and 228.06 amu, respectively. The LC-MS/MS analysis showed RT at 1.82 min and 3.12 min for metabolite M3 and ECA respectively. M3 full scan positive ion mode [M + H]+ peak was obtained at m/z 228.06 amu and 196.08 amu for parent ion and major fragment ion, respectively. So, in multiple reaction monitoring mode, m/z 228.06/196.08 and 297.08/228.06 transitions were selected for M3 and ESA, respectively. Fig. 2 illustrates the mass spectra of ECA and its metabolites.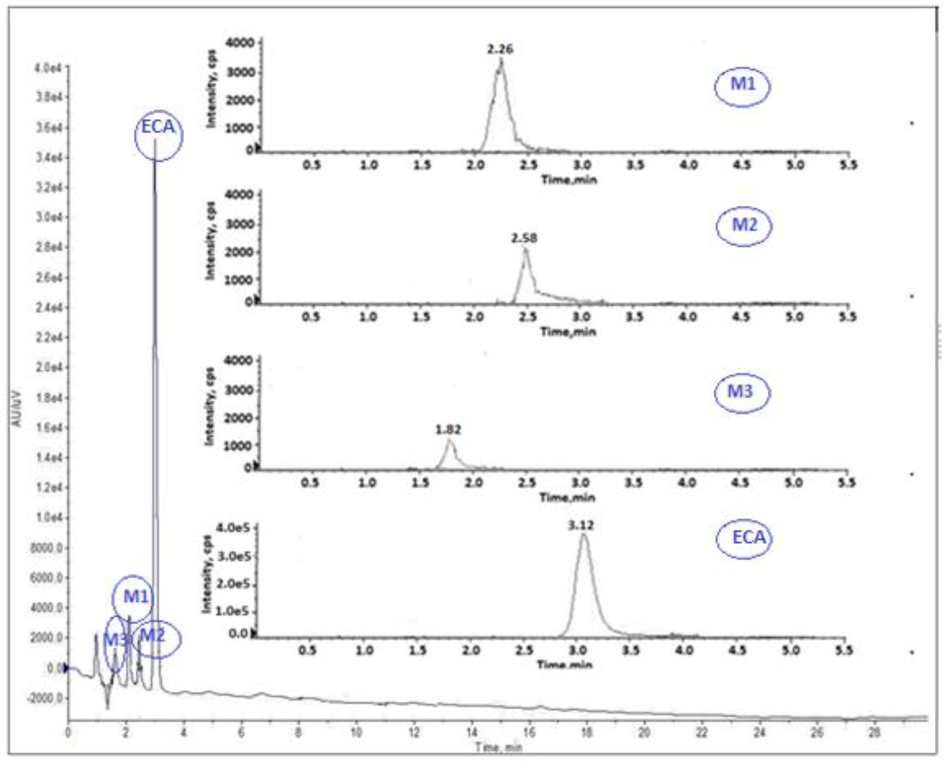
MS/MS scan of eslicarbazepine acetate (ECA) and its metabolites (M1-M3).
3.3 In silico studies
In silico studies by MetabolExpert was done to predict the probable metabolites of the compounds. In MetabolExpert, the set of logical rules were automated and applied to the molecule of interest to create a tree of predicted metabolites based on steric possibilities and metabolic alteration. Eight ECA metabolites (Fig. 3) were predicted when ECA was subjected to computer aided prediction software MetabolExpert. Though, experimental evidence for the existence of only M1, M2 and M3 was found. Further in vivo and in vitro pharmacokinetic studies carried out on M3 (a novel metabolite) proved the existence of M3.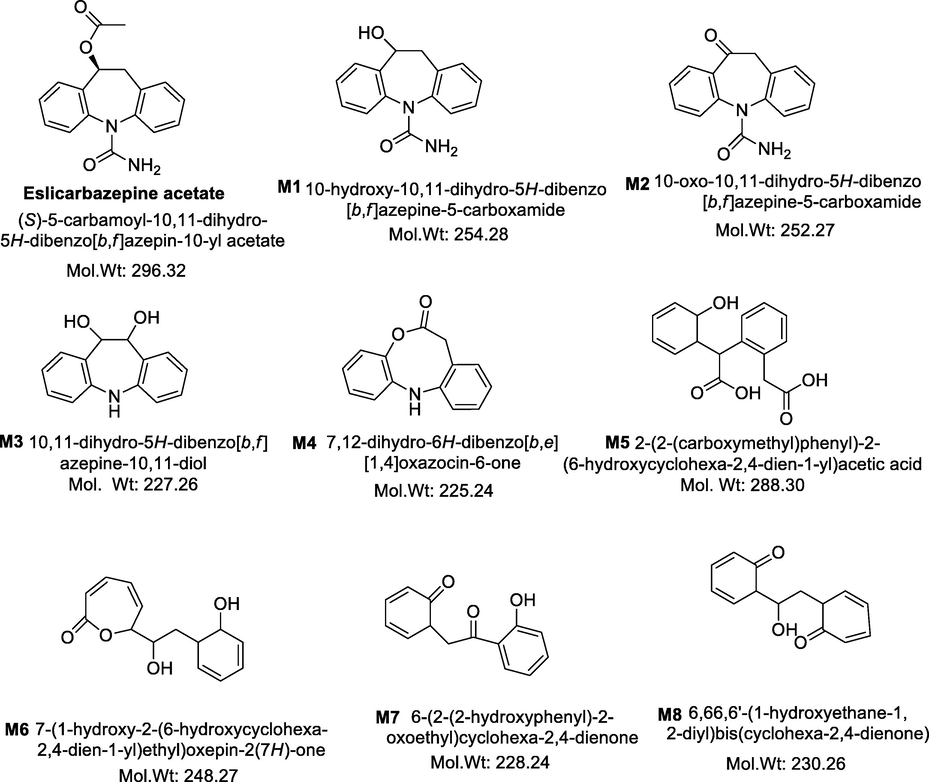
Eslicarbazepine acetate (ECA) and its tentative metabolites (M1-M8).
3.4 Microsomal studies
Microsomal studies of ECA was performed by incubation of the parent compound with 50 μM pooled human liver microsomes at 10, 20, 30, 40 and 50 min time interval. Metabolic studies showed that ECA was significantly metabolized and three metabolites (M1, M2, and M3) were formed. M3 was found to be novel and thus was further quantified. UPLC studies (Fig. 1) showed a small peak at RT 1.82 and RRT 0.58 along with parent compound and two other metabolites peaks (M1 and M2) which indicate the presence of metabolite M3. In a full scan positive ion mode mass analysis molecular weight of parent compound and metabolites were detected and metabolic pathway of M3 was proposed. In multiple reaction monitoring (MRM) mode, m/z 228.06 / 196.08 and 297.08 / 228.06 transitions were selected for M3 and ECA, respectively, in full scan positive ion mode [M + H]+. The metabolic data of ECA and M3 metabolite at different time intervals is shown in Table 1. The proposed biotransformation pathway based on the metabolic studies indicates that the microsomal preparation metabolized ECA to intermediate by deacetylation and hydrolysis which subsequently undergoes arene oxidation to form M3 metabolite (Fig. 4).
Time (Minutes)
Eslicarbazepine acetate
μM (μg/ml)M3
μM (μg/ml)
0
50.00 (14.816)
00.00 (00.00)
10
48.32 (14.318)
00.06 (0.136)
20
45.92 (13.607)
00.09 (0.0204)
30
43.66 (12.937)
00.13 (0.0295)
40
39.23 (11.624)
00.18 (0.0409)
50
34.68 (10.276)
00.20 (0.0454)
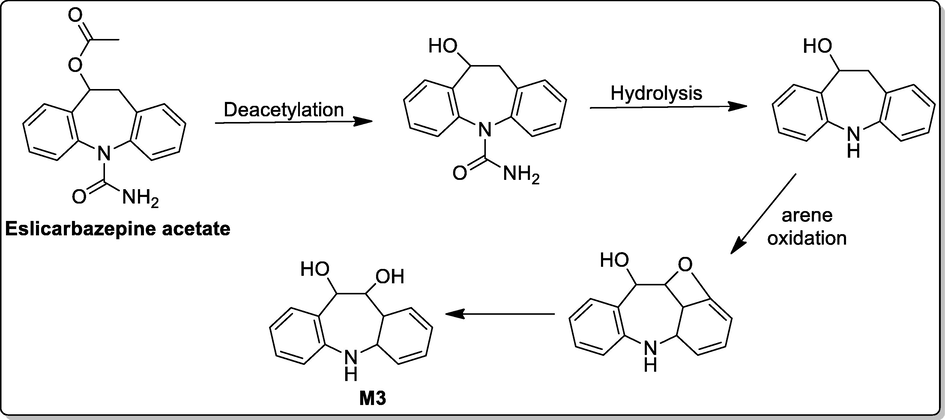
A proposed metabolic pathway for the formation of M3 from ECA.
3.5 In vivo pharmacokinetic study
The metabolite M3 in the plasma of the Wistar Albino rats was quantified by the hyphenated technique LC-MS/MS. The developed UPLC method with multiple reaction monitoring (MRM) mode facilitated the recognition of M3 metabolite in sample plasma. Fig. 5 portrays the mean concentration for M3 metabolite in plasma and time curve after oral administration of ECA.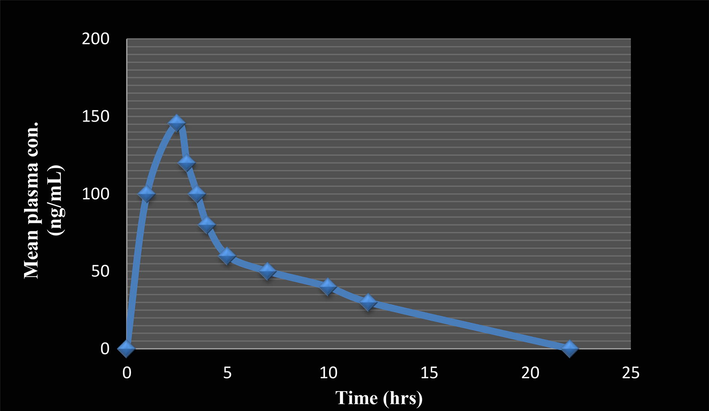
Mean plasma concentration–time plot of M3.
WinNonlin Version 5.1 software was used for the evaluation of pharmacokinetic parameters. The experimental studies showed145.642 ng/ml as the maximum concentration (Cmax) in plasma and time (Tmax) required to achieve Cmax was 2.500 h. Area under the curve by linear trapezoidal method was found to be AUC0-t 929.022 μg h/ml, AUCt-∞ 93.167 μg h/ml and AUC0-∞ 1022.192 μg h/m. The half life (t1/2) was 2.152 h. The clearance (CL), minimal residual time (MRTt) and elimination rate constant (Kel’) were found to be 53.82 L/h/kg, 3.125 and 0.322, respectively (Table 2).
S. No
Parameters
Values
1
Cmax (ng/ml)
145.642
2
Tmax (h)
2.5
3
AUC0-t (μg h/ml)
929.022
4
AUCt-∞(μg h/ml)
93.167
5
AUC0-∞(μg h/ml)
1022.192
6
AUC%Extrap
0.091
7
CL (L/h/kg)
53.82
8
t1/2 (h)
2.152
9
MRTt
3.125
10
Kel’
0.322
3.6 Method validation for metabolite
3.6.1 Selectivity
Independent plasma samples were used to study selectivity which indicated the coefficient of variation of 12.864%. The response of interfering peak at the RT of M3 in blank matrix is ≤ 20% of average peak area response of M3 in the processed sample. The developed method is selective because the obtained results are within the acceptance criteria.
3.6.2 Linear range
A linear relationship between the peak area of metabolite M3 and its concentration existed in the concentration range of 5–100 ng/ml and the corresponding regression equation is expressed as: where, y and X represent M3 peak area and concentration. The high value of illustrated the good linearity of the calibration curve. The significance of correlation coefficient (r) was judged by calculating the t-value using the following equation (Rahman et al., 2005):
The calculated t-value was 14.486 which is greater than the tabulated value (ttab = 1.895) at 95% confidence level. This indicated a significant relationship between the peak area and concentration of M3.
3.6.3 Precision and accuracy
The intra- and inter-day precision was expressed in CV%. The intra-day precision of M3 was observed as 1.002 to 2.442%, while the inter-day precision was 1.130 to 2.711%. The results obtained (Table 3) were within the acceptance limit of precision. The intra-day accuracy of M3 was found to be 93.734 to 99.433%, while the inter-day accuracy was 97.604 to 98.811%. The results obtained are within acceptance limit for accuracy of 15% of the actual value; hence the developed method is accurate and precise.
Observed concentration (ng/mL)
LQC
MQC
HQC
S.No.
Intra Day
Inter Day
Intra Day
Inter Day
Intra Day
Inter Day
1
15.21
15.01
45.02
45.13
79.14
79.94
2
14.52
14.62
44.42
44.61
80.21
79.58
3
14.66
14.26
44.18
44.27
78.88
77.46
4
15.31
15.24
45.14
43.94
77.37
76.57
5
15.21
15.11
44.22
45.03
77.11
78.34
6
14.58
14.69
44.14
43.65
76.41
76.61
Mean
14.91
14.82
44.52
44.43
78.18
78.08
SD
0.364
0.401
0.445
0.502
1.446
1.414
CV (%)
2.442
2.711
1.002
1.130
1.851
1.811
Nominal Conc. (ng/mL)
15
15
45
45
80
80
%Nominal
99.433
98.811
98.933
98.751
97.734
97.604
3.6.4 Recovery
The recovery of M3 was evaluated by calculating mean peak area response of extracted samples and non extracted samples (Table 4). The percent mean recovery for LQC, MQC and HQC were found to be 90.62, 92.59 and 95.18%, respectively. The %CV was 2.201 to 4.074 at different QC concentrations, and is within the acceptance limit of ≤20.
LQC
Area countsMQC
Area countsHQC
Area counts
S.No.
Extracted Samples
Nonextracted Samples
Extracted Samples
Nonextracted Samples
Extracted Samples
Nonextracted Samples
1
14,523
15,843
234,425
254,574
345,265
370,762
2
13,985
15,803
249,181
269,488
338,894
356,482
3
15,141
16,706
227,428
245,667
365,844
375,471
4
14,656
15,989
233,076
249,857
348,546
366,723
Mean
14576.25
16,085
236027.5
254,897
349637.3
367359.5
S.D.
475.294
421.481
9278.026
10,386
11523.65
8084.936
% CV
3.261
2.621
3.931
4.074
3.296
2.201
% Recovery
90.62
92.59
95.18
3.6.5 Matrix effect
M3 matrix effect was analyzed at different concentration levels: LQC (15 ng/ml), MQC (45 ng/ml) and HQC (80 ng/ml). The values of matrix effect were within the acceptance criteria of ± 15% CV. The matrix factor at LQC, MQC and HQC was found to be 97.29, 98.73 and 99.27 respectively (Table S2, Supplementary material).
3.6.6 Stability
M3 stability studies were performed under different storage state viz., stock solution stability, bench top stability (ambient temperature), auto-sampler stability and freeze thaw stability. The stability studies data showed that M3 maintains its composition and integrity in all conditions. The results presented in Table 5 showed that all the data were within the limits of acceptance criteria of precision and accuracy
Type of stability studies
QC
Observed Con.
% Precision
% Accuracy
Stock solution stability
LQC
HQC14.825
79.2813.145
2.24596.275
98.748
Bench top stability
LQC
HQC14.951
79.8413.047
2.87497.433
98.761
−20 °C 30 days
LQC
HQC13.986
79.4752.741
1.84595.943
97.612
Auto sampler stability
LQC
HQC14.247
79.3652.186
1.42497.771
98.922
Freeze thaw stability
LQC
HQC13.859
78.9211.902
1.16496.884
99.605
4 Conclusion
In silico, in vitro and in vivo approaches have facilitated the detection and depiction of ECA metabolites. MetabolExpert successfully predicted various metabolites of ECA. However, only the presence of metabolite M3 was found. Microsomal studies of ECA were performed successfully by incubation of the parent compound with 50 μM pooled human liver microsomes at 10, 20, 30, 40 and 50 min time interval. Finally, M3 was quantified by the hyphenated technique LC-MS/MS from the plasma of the rat. The intra- and inter-day accuracy for determination of M3 were 93.734 to 99.433%, and 97.604 to 98.811%., respectively. The LC-MS/MS method was successfully developed and validated as per regulatory guidelines.
Acknowledgements
The authors extend their appreciation to the Researchers supporting project number (RSP-2020/94), King Saud University, Riyadh, Saudi Arabia. One of the authors (FI) is also thankful to UGC, Govt. of India, for providing financial assistance in the form of JRF.
Declaration of Competing Interest
The authors declare that they have no known competing financial interests or personal relationships that could have appeared to influence the work reported in this paper.
References
- Review on pharmaceutical impurities, stability studies and degradation products. Rev. Adv. Sci. Eng.. 2013;2:155-166.
- [Google Scholar]
- Stereoselective disposition of S- and R-licarbazepine in mice. Chirality. 2008;20:796-804.
- [Google Scholar]
- Adsorptive removal of Pb(II) ions from groundwater samples in Oman using carbonized Phoenix dactylifera seed (Date stone) J. King Saud Uni.-Science. 2020;32:2931-2938.
- [Google Scholar]
- Eslicarbazepine acetate as adjunctive therapy in adult patients with partial epilepsy. Epilepsy Res.. 2010;89:278-285.
- [Google Scholar]
- An update on in vitro test methods in human hepatic drug biotransformation research: pros and cons. Toxicol. App. Pharmacol.. 2003;189:233-246.
- [Google Scholar]
- Experimental validation of in silico target predictions on synergistic protein targets. Med. Chem. Commun.. 2013;4:278-288.
- [Google Scholar]
- Identification of metabolic pathways involved in the biotransformation of tolperisone by human microsomal enzymes. Drug Metab. Dispos.. 2003;31(5):631-636.
- [Google Scholar]
- Matrix effect in bioanalysis of illicit drugs with LC-MS/MS: influence of ionization type, sample preparation, and biofluid. J. Am. Soc. Mass Spectrom.. 2003;14:1290-1294.
- [Google Scholar]
- Simultaneous quantitative determination of arachidonic acid and cascade metabolites in rat serum by UPLC-MS/MS: application for longitudinal metabolomics of anlotinib. Analyst. 2020;145:4972-4981.
- [Google Scholar]
- Validation of a reversed phase UPLC-MS/MS method to determine dopamine metabolites and oxidation intermediates in neuronal differentiated SH-SY5Y cells and brain tissue. ACS Chem. Neurosci.. 2020;11:2679-2687.
- [Google Scholar]
- Eslicarbazepine acetate: A therapeutic agent of paramount importance in acute and chronic anticonvulsant therapy. J. Acute Dis.. 2017;6(6):245-254.
- [Google Scholar]
- Development of a stress induced validated UPLC-PDA method for the analysis of Eslicarbazepine acetate. Saudi Pharm. J.. 2018;26:286-291.
- [Google Scholar]
- GLORYx: Prediction of the metabolites resulting from Phase 1 and Phase 2 biotransformations of xenobiotics. Chem. Res. Toxicol. 2020 (in press)
- [CrossRef] [Google Scholar]
- The impact of pharmacokinetic interactions with eslicarbazepine acetate versus oxcarbazepine and carbamazepine in clinical practice. Ther. Drug Monit.. 2016;38(4):499-505.
- [Google Scholar]
- Inhibitory effect of eslicarbazepine acetate and S-licarbazepine on Nav 1.5 channels. Front. Pharmacol.. 2020;11 555047
- [CrossRef] [Google Scholar]
- Development and validation of a specific and sensitive LC–MS/MS method for determination of eslicarbazepine in human plasma and its clinical pharmacokinetic study. J. Chromatogr. B. 2019;1112:61-66.
- [Google Scholar]
- Studies on the in vitro and in vivo metabolism of the synthetic opioids U-51754, U-47931E, and methoxyacetyl fentanyl using hyphenated high-resolution mass spectrometry. Sci. Rep.. 2019;9:13774.
- [Google Scholar]
- Prediction of Drug Metabolism and Interactions on the Basis of in vitro Investigations. Basic Clin. Pharmacol. Toxicol.. 2005;96:167-175.
- [Google Scholar]
- Strategies for using in vitro screens in drug metabolism. Drug Discovery Today. 2004;9:328-336.
- [Google Scholar]
- Optimized and validated spectrophotometric methods for the determination of lisinopril in pharmaceutical formulations using ninhydrin and ascorbic acid. J. Braz. Chem. Soc.. 2005;16:1001-1009.
- [Google Scholar]
- The importance of impurity analysis in pharmaceutical products: an integrated approach. Accred. Qual. Assur.. 2006;11:69-74.
- [Google Scholar]
- Clinically relevant of cytochrome P450 family enzymes for drug-drug interaction in anticancer therapy. World Cancer Res. J.. 2015;2:e524
- [Google Scholar]
- Modeling of interactions between xenobiotics and cytochrome P450 (CYP) enzymes. Front. Pharmacol.. 2015;6:123.
- [CrossRef] [Google Scholar]
- Analytical techniques in pharmaceutical analysis: a review. Arabian J. Chem.. 2017;10:S1409-S1421.
- [Google Scholar]
- Eslicarbazepine acetate for the treatment of focal epilepsy: an update on its proposed mechanisms of action. Pharmacol. Res. Perspect... 2015;3(2):e00124.
- [CrossRef] [Google Scholar]
- Study of in-vitro metabolism of selected antibiotic drugs in human liver microsomes by liquid chromatography coupled with tandem mass spectrometry. Anal. Bioanal. Chem.. 2016;408:8273-8287.
- [Google Scholar]
- Update on the role of eslicarbezepine acetate in the treatment of partial onset epilepsy. Neuropsychiatr. Dis. Treat.. 2016;12:1251-1260.
- [Google Scholar]
- UPLC-MS/MS method for the simultaneous determination of imatinib, voriconazole and their metabolites concentrations in rat plasma. J. Pharm. Biomed. Anal.. 2019;166:6-12.
- [Google Scholar]
Appendix A
Supplementary data
Supplementary data to this article can be found online at https://doi.org/10.1016/j.jksus.2020.101281.
Appendix A
Supplementary data
The following are the Supplementary data to this article:


