

Translate this page into:
Optimization of adsorption of metal ions from a ternary aqueous solution with activated carbon from Acacia senegal (L.) Willd pods using Central Composite Design
⁎Corresponding author. abdulmalikakanji@gmail.com (Abdulmalik A. Adetokun)
-
Received: ,
Accepted: ,
This article was originally published by Elsevier and was migrated to Scientific Scholar after the change of Publisher.
Peer review under responsibility of King Saud University.
Abstract
Activated carbon was prepared from Acacia senegal using H3PO4, it was characterized using FTIR, SEM and BET. Optimization of adsorption of Cadmium, Chromium and Lead from ternary solution with the adsorbent was carried out using Design Expert software and the model validated. FTIR analyses showed the presence of some functional groups such as —OH and —C⚌C— which usually aid adsorption. SEM micrograph showed presence of pores of various sizes on the carbon surface, also responsible for adsorption of molecules of various sizes. BET analyses reported the carbon to have surface area of 427.5 m2/g, width of 5.839 nm signifying a mesopore responsible for various degrees of adsorption. The optimum factors which were responsible for 98.54%, 100.00% and 99.96% adsorption of Cd, Cr and Pb respectively predicted by the model were 145.06 mg/L, 144.15 mg/L, 63.83 mg/L, 8.0, 0.17 g and 8.46 min as initial concentrations of Cd, Cr, Pb, pH, dosage and contact time respectively. The optimum factors were further validated with coefficient of determination R2 ranging from 0.8267 to 0.9775. These models were also used to predict maximum adsorption of Cd, Cr and Pb from tannery water and ABU dam water, 73%, 82.54% and 87.23% were obtained as the experimental percentage removal of Cd, Cr and Pb respectively from ABU water, while removal from tannery wastewater stood at 62.75%, 85.2% and 77.83% for Cd, Cr and Pb respectively. Acacia senegal pod has been demonstrated to be an efficient precursor in activated carbon production for water treatment.
Keywords
Activated carbon
Acacia senegal
Mesopore
SEM
BET
FTIR

1 Introduction
Water has numerous uses in various sectors which include; agriculture, domestic usage, industrial, mining, power and so forth (USGS, 2018). It is very essential for life. Fresh water is in limited supply and its quality is under continuous strain. Preserving the quality of fresh water is paramount for the drinking-water supply, food production and recreational water use. Water quality can be compromised by the presence of infectious agents, toxic chemicals, and radiological hazards (WHO, 2018).
Water pollution may be defined as the physical, chemical, biological or energy contamination of water body which includes streams, lakes, seas, underground water or oceans resulting in harmful effects on living being. Industrialization couples with population explosion are two paramount factors that influence water pollution (Water Pollution, 2017). Heavy metals are persistent contaminants in the environment that can cause serious environmental and health hazards (Ayar et al., 2009). They are released into the ecosystem from natural as well as anthropogenic activities (Bakut et al., 2016). Some heavy metals (such as Cu and Fe) are significance to maintain proper metabolic process in living things while others (such as As and Cd) are nonessential and have no biological significance (Ayar et al., 2009; Qin et al., 2009). The concentration of Chromium in tannery effluents in northern Nigeria ranges from 0.3 mg/L to 5.79 mg/L which is way beyond WHO guideline of 0.05 mg/L (Bernard and Adepeju, 2015; Mohammed et al., 2017).
Exposure to Cadmium has several toxic effects on the respiratory system, skeletal system, kidney and it is also found out to have carcinogenic effects on human (Cadmiuma, 2018). Cancer of the lungs, genotoxic effects such as sister chromatid exchange and chromosomal aberration were reported in occupational studies of workers exposed to chromium compounds. Acute exposure to chromium results in effects such as convulsions, gastrointestinal disorder and may lead to death from cardiovascular shock (Janus and Krajnc, 1990). Lead is a toxicant that bio-accumulate and affects various systems of the human body. Children are specially expose to neurotoxic effects of lead and in some cases causes permanent neurological damage even at low concentration (Lead, 2018).
Conventional processes for the extraction of the heavy metals ions from wastewater include adsorption onto activated carbon, electro-floatation, ion exchange, reverse osmosis, and chemical precipitation (Lofrano et al., 2012). Adsorption of heavy metals by activated carbon for treating domestic and industrial wastewater is a powerful technology which is guided by the emerging concept of Green Chemistry whereby there is minimization of chemical or biological sludge, regeneration of adsorbents, and possibility of metal recovery (Lofrano et al., 2012).
Acacia senegal also known as gum Arabic tree is a deciduous legume tree native to western Sudan, Nigeria and the Arabian Peninsula, where it grows in savannas and woods. It is also cultivated in India, Pakistan, Australia, Puerto Rico and Virgin Islands and South Asia (Gum Arabic tree, 2018).
Optimization is the discipline of adjusting a procedure so as to get the best combination of factor levels of some specified set of parameters to give a maximum response without violating some constraint (David, 2000). The main goal of optimization is to save or eliminate time and resource wastage, avoidable costs, bottlenecks, and mistakes while achieving the procedure objective (Process Optimization, 2018). Response surface methodologies (RSM) are multivariate techniques that mathematically/statistically fit the experimental domain studied in the theoretical design through a response function (Myers, 1971; Box et al., 1987). The major aim of this method is to vary all significant factors at a time and then fit the experimental data to a mathematical model (Krowiak et al., 2014). Thus, the number of experimental runs in RSM is less than the conventional methods. Central Composite Design (CCD) is a sub-set of RSM, it comprises of a 2k factorial design, which provides data for approximating the first-order effects for each factor and interactions between the factors, and a “star” design consisting of 2k + 1 points, which provides data for estimating second-order effect (David, 2000). The star points represent new boundary values (low and high) for each factor in the design (Grady and Kenneth, 2006). Where k is the number of factors considered during the course of the experiment.
Several works have been reported for adsorption as well as optimization of adsorption of heavy metals from solution with an activated carbon, these include; Cocos nucifera and Borassus aethiopium (Adie et al., 2012), coconut shell (Bernard et al., 2013; Aminul and Imran, 2016; Buah et al., 2016), palm shell (Nur et al., 2014), papaya seed and plantain peels (Garba et al., 2016), hazelnut shells (Enes and Aytac 2017), but there is limited literature on optimization of adsorption from a multi-metallic solution (Oladipo and Gazi, 2014).
2 Materials and methods
2.1 Materials
The following chemicals/reagents were employed during the course of this research work; they were used as supplied without further purification; Pb(NO3)2 99% purity (by KIMIE laboratories, Mumbai India), Cd(NO3)2·4H2O 98% purity, CrCl3·6H2O, 98% purity, H3PO4, 99% purity (by British Drug House (BDH), England), distilled water (from Chemistry department of Ahmadu Bello University, Zaria), Nitrogen gas 97% purity (from BOC gas ltd, Kaduna). The Acacia senegal pods were gotten from Ahmadu Bello University garden and environs.
2.2 Preparation of activated carbon
The collected pods were sun-dried for six consecutive days to dehydrate it completely. Size reduction was carried out on the dried sample using mortar and pistil. The reduced sample was then stored in an air tight container for subsequent work (Abdulrazak et al., 2017).
The AC was prepared as reported by Garba et al. (2014). Here, the precursor was impregnated with 85% w/v H3PO4, with impregnation ratio of 1:1. The resulting mixture was kept in an oven at 85°C for 24 h, after which it was loaded into a tube furnace. Heating was carried out at 600 °C for 2 h in a nitrogen atmosphere. The nitrogen was passed through furnace at rate of 150 mL/min from the time heating started to the time the whole furnace cooled down. The AC was washed with distilled water until neutrality was attained, dried, crushed, sieved with a 0.25 mm mesh and stored in an air tight container for further characterization and experiments.
The expression for calculating impregnation ratio is shown below:
2.3 Characterization of activated carbon
Infrared spectroscopy of the prepared AC was carried out at the Multi-User Science Research Laboratory of Ahmadu Bello University, Zaria, using Agilent (by Agilent, USA). Micrographs of the AC (before and after adsorption) were obtained at Chemistry Laboratory of Umaru Musa Yaradua University, Katsina, using a scanning electron microscope (Phenome proX by Phenomeworld, Netherlands). Brennuer-Emmer-Teller (BET) analysis was employed in determining the surface area and pore volume of the AC. It was carried out at Chemistry Laboratory of Federal University of Technology, Minna using BET instrument (Nova 4200e, U.S.A). Thermogravimetric analysis (TGA) was carried out using a thermogravimetric analyzer by PerkinElmer at National Institute of Chemical Technology, Zaria.
2.4 Preparation of metal stock solutions
Stock solutions of 1000 mg/L of Cadmium, Chromium and Lead were prepared by dissolving 2.7543 g of Cd(NO3)2·4H2O, 5.7308 g of CrCl3·6H2O and 1.5985 g of Pb(NO3)2 into separate 1L distilled-deionised water.
2.5 Digestion of sampled water
50 mL of the sample was measured into a beaker, after which 5 mL of conc. HNO3 was added and heated gently, until the volume reduced to 20 mL–25 mL in a fumehood. This was cooled; 5 mL of concentrated HNO3 was added and reheated for gentle reflux to occur until digestion is complete, it was evaporated to<5 mL and cooled. After cooling, beaker wall was washed down with water, filtered and the filtrate transferred to a 100 mL flask adjusted to volume using distilled water (APHA, 1999).
2.6 Design of experiment using RSM
The design of experiment was carried out with the aid of Design-Expert software version 11.0.3 (Stat-Ease, Inc., Minneapolis, MN 55413, USA). Six factors were considered during the design process. These factors are, Initial concentrations of Cadmium, Chromium, Lead, pH, adsorbent dose and contact time. Three responses were noted as the goal of the design, these; percentage removal of Cadmium, Chromium and Lead. The variables employed in the design are shown in Table 1 below.
Coded level
Initial Cr(mg/L)
Initial Cd(mg/L)
Initial Pb(mg/L)
pH
Adsorbent dose(g)
Contact time(min)
A
B
C
D
E
F
−1
56
56
56
4
0.15
8
+1
149
149
149
8
0.4
20
0
102.5
102.5
102.5
6
0.275
14
−α
29.7
29.7
29.7
2.9
0.08
4.6
+α
175.3
175.3
175.3
9.1
0.47
23.4
The various stock solutions were diluted appropriately to get the working solution; these solutions were mixed as shown in the design of experiment matrix and made up to 50 mL using distilled water. The pH of the metals solutions were adjusted to the required value using 0.01 M HCl or 0.01 M NaOH, the appropriate mass of the AC was added to the solutions after which the mixture is loaded on a mechanical shaker and shaken for the required time at constant speed of 250 rpm and room temperature of 27°C (Garba et al., 2016). After shaking, the mixture was then filtered with a filter paper and the residual concentrations of the metals in the mixture were determined using a Flame Atomic Absorption Spectrophotometer.
The percentage removal of individual metal was calculated using the expression below:
A quadratic model in form of expression below was developed for the adsorption of the metal as it was influenced by the parameters considered during the experimental runs;
Coefficient of Determination (R2) was used to determine the quality of the model as it compared the data from predicted model with data gotten from experimental runs (Anilkumar et al., 2016). Fisher variation ratio (F-value) was employed to explain the adequacy and significance of the predicted model (Kumar et al., 2009).
2.7 Reuseability
This was done by shaking the spent adsorbent in 1 M solution of HNO3 for 1 h, filtered, washed with distilled water, dried and re-introduced for adsorption in fresh solution of metal ions, this cycle was repeated five times (Adio et al., 2019).
3 Results and discussion
3.1 Scanning electron micrograph
The SEM images of the activated carbon before and after adsorption are shown in Plates 1 and 2, respectively. The micrograph of the AC (×1000 magnification) before adsorption as shown in Platet 1 shows the AC retaining its fibrous nature, with various porosities. An etched texture generated by the activating agent (H3PO4) and volatile matter decomposition is also noted (Ma et al., 2017). Due to the etching, the AC surfaces are irregular with high porosity and roughness which is an indication of a good textural property (Arroyo-Gomez et al., 2018). The image (×1000 magnification) of the AC after adsorption as shown in Platet 2 shows metal precipitates appearing as flakes and grain-like structures on the surface of the AC.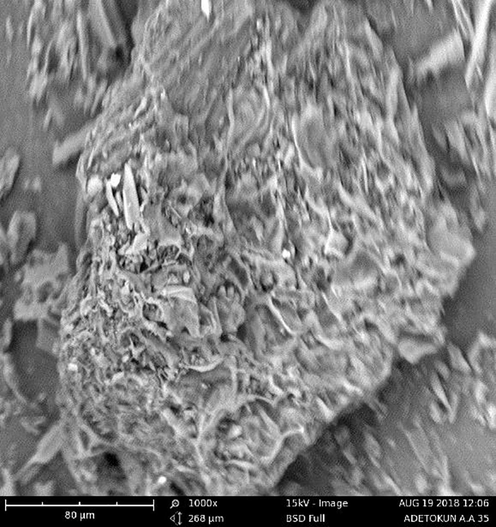
SEM image of AC before adsorption showing etched structure with various pore dimensions.
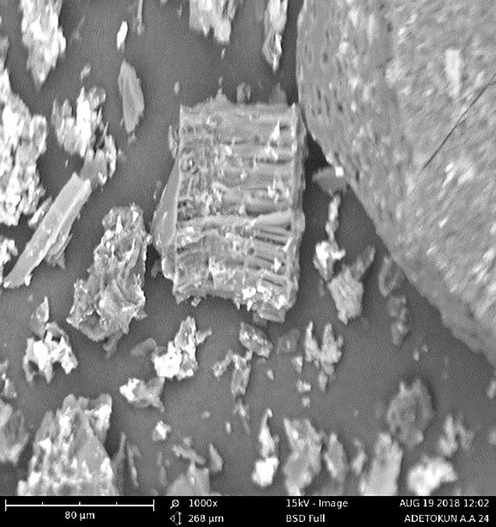
SEM image of AC after adsorption showing precipitates as flakes and grain-like structures.
The data presented in Table 4 showed various adsorption efficiencies for respective metal ions in the tri-metallic solution; Cd ranges from 83.81 to 100%, Cr from 72.5 to 100% and Pb from 46.43 to 99.96%.
3.2 Surface analyses
The result of surface analyses as shown in Table 2 indicates that the pores widths (5.839 nm) of the AC are of the mesopore dimension since it falls in the range of 2–50 nm (IUPAC, 1972). These mesopores are responsible for capillary condensation as well as transporting adsorptive into the micropores, consequently improving the adsorption capacity of the AC (Zdravkov et al., 2007). The AC has high active sites available for adsorption which is due the high BET surface area (427.531 m2/g) and pore volume (0.174 cm3/g) of the carbon (Marsh and Rodríguez-Reinoso, 2006). These surface area results fall in range of several others reported in literature, using phosphoric acid as activating agent, this is shown in Table 3 below.
Parameter
Value
Surface area (m2/g)
427.531
Pore width (nm)
5.839
Micropore volume (cm3/g)
0.174
Precursor
Surface area (m2/g)
Pore width (nm)
Pore volume (cm3/g)
Reference
Kenaf fibre
299
ND
0.12
Shamsuddin et al., 2016
Olive stones
1218
ND
0.6
Yakout and El-deen, 2011
Balanite aegyptiaca epicarp
774.76
ND
ND
Wyasu et al., 2016
Detarium mirocarpum epicarp
857.99
ND
ND
Wyasu et al., 2016
Coconut shell
1200
ND
0.078
Anisuzzaman et al., 2015
Canarium schweinfurthii nutshell
741–779
ND
ND
Olawale et al., 2015
Acacia senegal pods
427.531
5.839
0.174
This work
Run
A
B
C
D
E
F
% Cd removal
% Cr removal
%Pb removal
1
−α
0
0
0
0
0
83.81
93.48
96.68
2
1
−1
−1
1
−1
−1
96.97
98.78
99.09
3
0
0
−α
0
0
0
93.59
86.06
91.99
4
0
0
0
0
−α
0
94.40
82.69
85.86
5
0
0
0
0
0
0
92.00
84.06
96.34
6
1
1
−1
−1
−1
−1
94.68
83.25
46.43
7
0
0
0
0
0
0
93.39
84.75
97.78
8
1
1
−1
1
1
−1
99.92
99.83
99.91
9
−1
1
1
−1
1
−1
89.05
78.93
71.14
10
1
−1
1
−1
1
−1
94.99
68.24
76.32
11
−1
1
−1
−1
1
1
89.04
80.58
71.55
12
α
0
0
0
0
0
95.63
83.80
96.38
13
−1
1
−1
1
−1
−1
99.63
99.84
99.04
14
0
0
0
0
0
0
93.00
84.40
94.40
15
−1
−1
−1
−1
1
−1
89.34
79.35
73.14
16
−1
1
1
−1
−1
1
88.85
82.97
58.14
17
0
0
0
0
0
α
93.52
84.37
96.12
18
0
0
0
0
0
−α
93.37
84.00
95.74
19
0
0
0
0
0
0
94.50
83.90
97.46
20
0
−α
0
0
0
0
93.61
75.26
99.28
21
0
0
0
α
0
0
100.00
100.00
99.54
22
0
0
0
−α
0
0
93.28
76.59
55.67
23
−1
−1
−1
1
1
1
100.00
100.00
98.76
24
−1
1
1
1
1
1
100.00
100.00
98.99
25
1
1
−1
1
−1
1
98.28
100.00
99.69
26
−1
−1
1
1
−1
1
97.78
100.00
99.74
27
1
1
1
−1
1
1
95.17
84.01
83.07
28
1
−1
1
−1
−1
1
94.97
72.15
72.10
29
−1
−1
1
1
1
−1
100.00
100.00
99.84
30
0
0
α
0
0
0
93.60
78.95
96.18
31
0
0
0
0
α
0
94.03
83.81
98.93
32
0
α
0
0
0
0
93.51
82.58
97.29
33
0
0
0
0
0
0
91.00
78.96
97.35
34
−1
−1
−1
−1
−1
1
89.14
73.67
51.26
35
1
−1
−1
−1
1
1
95.12
73.23
81.55
36
1
−1
1
1
1
1
98.69
100.00
99.92
37
1
1
−1
1
−1
−1
99.78
100.00
99.96
38
1
1
1
1
−1
−1
98.61
100.00
99.69
39
0
0
0
0
0
0
94.00
84.38
97.27
40
−1
−1
1
−1
−1
−1
89.26
79.99
77.89
3.3 FTIR, TGA and pHzpc
From the IR spectra of the AC presented in Fig. 1, there is presence of –OH group (both free and intermolecular bonded) which is attributed to the absorptions at 3652 cm−1, 3127 cm−1 and 1051 cm−1. Strong absorption at 1148 cm−1 indicates the presence of C—O—C of an aliphatic ester while the absorption bands at 1871 cm−1, 1684 cm−1 and 1561 cm−1 portray the presence of C⚌C groups of aliphatics and aromatics (Absorption table, 2014; Spectroscopic tools, 2018). Adsorption was aided by the various functional groups present on the surface of the AC; this is due to the presence of electronegative Oxygen atom(s) as well as electron cloud density at the multiple bonds of carbons. Hence, there is preferential adsorption of metal ions which are electropositive (Marsh and Rodríguez-Reinoso, 2006).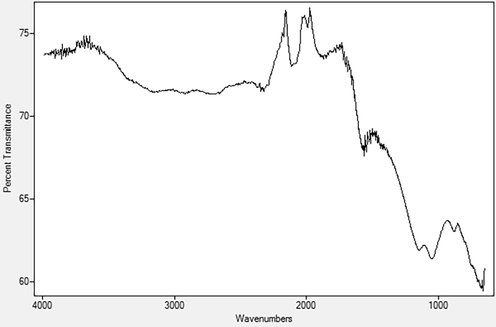
Infrared spectra of the Activated carbon.
Thermal profile of the activated carbon gives information about the change of mass, thermal capacity and enthalpy, it measures the weight difference as a function of temperature. The profile of thermogravimetric analyses is presented in Fig. 2. The process of heating started at 50 °C through 700 °C at the rate of 10 °C/min. The profile shows weight loss in three principal regions. The loss which could be ascribed to moisture content of about 9.5% was noticed between 80 °C and 120 °C. Weight loss of about 40% noticed between 150 °C and 280 °C could be as a result of decomposition of most organic matters present. The weight loss of about 8% which took place between 350 °C and 600 °C, which is due to further degradation of compounds like esters, quinones etc. (Nasrollahzadeh et al., 2016; Rawal et al., 2018).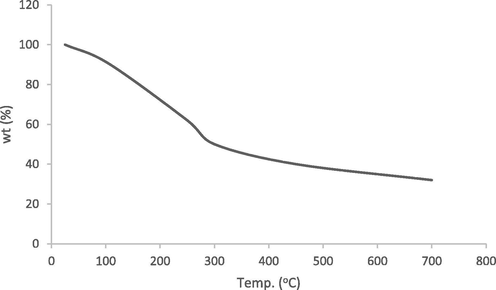
TGA profile.
The pHzpc of the adsorbent was determined using drift method (Tran et al., 2016) as 6.64, this implies that the dominant surface of the adsorbent will be negatively charged when pH of solution exceeds pHzpc, and vice versa (Van et al., 2018). This is also supported by relative higher adsorption at pH above pHzpc as shown in Table 4.
3.4 Model and statistics
The data presented in Table 4 showed various adsorption efficiencies for respective metal ions in the tri-metallic solution; Cd ranges from 83.81 to 100%, Cr from 72.5 to 100% and Pb from 46.43 to 99.96%.
The models (in coded form) for respective metal adsorptions are presented in Eqs. (4)–(6), with positive sign of the coefficient indicating the term affecting adsorption positively while negative sign points to the adsorption been affected negatively by the term in the model equations.
Results of the significance and non-significance of the model and lack of fits respectively are displayed in Table 5, the p-value of all the models are less than 0.05 indicating that they are significant. The p-value of all the models lack of fit are greater than 0.05 indicating the models lack of fit not significant. These were further confirmed by the less than 0.2 differences between the adjusted and predicted R2 of the lack of fits (Design expert, 2018).
Response
Source
Sum of Squares
df
Mean Square
F-value
p-value
Verdict
Cd removal
Model
512.28
5
102.46
44.24
<0.0001
Significant
A-Initial Cd
82.11
1
82.11
35.46
<0.0001
R2 = 0.9240
D-pH
280.24
1
280.24
121.02
<0.0001
AD
57.16
1
57.16
24.68
<0.0001
A2
6.22
1
6.22
2.69
0.1104
D2
70.96
1
70.96
30.64
<0.0001
Residual
78.73
34
2.32
Lack of Fit
70.33
29
2.43
1.44
0.3671
not significant
R2 = 0.8668
R2adj. = 0.8472
R2pred. = 0.7123
Pure Error
8.40
5
1.68
Cr removal
Model
3526.75
12
293.90
43.76
<0.0001
Significant
A-Initial Cd
48.11
1
48.11
7.16
0.0125
R2 = 0.9691
B-Initial Cr
84.58
1
84.58
12.59
0.0014
C-Initial Pb
2.30
1
2.30
0.3428
0.5631
D-pH
2312.30
1
2312.30
344.31
<0.0001
E-Dosage
0.0890
1
0.0890
0.0133
0.9092
F-Time
0.0053
1
0.0053
0.0008
0.9779
AB
52.09
1
52.09
7.76
0.0097
BD
42.86
1
42.86
6.38
0.0177
CF
27.77
1
27.77
4.13
0.0519
EF
22.35
1
22.35
3.33
0.0792
A2
121.47
1
121.47
18.09
0.0002
D2
109.81
1
109.81
16.35
0.0004
Residual
181.33
27
6.72
Lack of Fit
157.17
22
7.14
1.48
0.3541
not significant
R2 = 0.9511
R2adj. = 0.9294
R2pred. = 0.8881
Pure Error
24.16
5
4.83
Pb removal
Model
8998.31
20
449.92
101.50
<0.0001
Significant
A-Initial Cd
3.13
1
3.13
0.7066
0.4110
R2 = 0.9939
B-Initial Cr
65.94
1
65.94
14.88
0.0011
C-Initial Pb
118.71
1
118.71
26.78
<0.0001
D-pH
5479.24
1
5479.24
1236.12
<0.0001
E-Dosage
361.02
1
361.02
81.45
<0.0001
F-Time
8.38
1
8.38
1.89
0.1851
AC
12.25
1
12.25
2.76
0.1128
AF
91.62
1
91.62
20.67
0.0002
BC
16.49
1
16.49
3.72
0.0688
BD
75.47
1
75.47
17.03
0.0006
BE
18.98
1
18.98
4.28
0.0524
BF
18.15
1
18.15
4.10
0.0573
CD
102.85
1
102.85
23.20
0.0001
CE
100.20
1
100.20
22.61
0.0001
DE
286.85
1
286.85
64.71
<0.0001
DF
11.62
1
11.62
2.62
0.1219
EF
108.11
1
108.11
24.39
<0.0001
C2
46.30
1
46.30
10.44
0.0044
D2
1033.43
1
1033.43
233.14
<0.0001
E2
88.51
1
88.51
19.97
0.0003
Residual
84.22
19
4.43
Lack of Fit
76.34
14
5.45
3.46
0.0888
not significant
R2 = 0.9907
R2adj. = 0.9810
R2pred. = 0.9251
Pure Error
7.88
5
1.58
The first five solutions of the optimum factors predicted by the software for maximum adsorption of the three metals were presented in Table 6 below. These were further validated by comparing experimental results to the predicted results. Strong coefficients of determination (R2) ranging from 0.8267 to 0.9775 as shown in Table 7 were obtained, signifying less variation between the predicted and actual values.
Solution
Initial Cd (mg/L)
Initial Cr (mg/L)
Initial Pb (mg/L)
pH
Dosage (g)
Time (min)
%Cd removal
%Cr removal
%Pb removal
Desirability
1
145.06
144.15
63.83
8.00
0.17
8.46
98.54
100.00
99.96
0.97
2
142.99
148.59
58.20
7.98
0.18
8.11
98.53
100.00
99.96
0.97
3
64.42
57.80
62.03
8.00
0.18
12.4
98.41
100.00
99.96
0.97
4
146.81
143.62
56.00
8.00
0.17
10.1
98.50
99.79
99.96
0.97
5
149.00
140.55
71.41
8.00
0.15
9.77
98.44
99.79
99.95
0.97
Solution
%Cd removal
%Cr removal
%Lead removal
Actual
Predicted
Actual
Predicted
Actual
Predicted
1
98.76
98.54
100.00
100.00
96.89
99.96
2
97.06
98.53
100.00
100.00
96.64
99.96
3
95.02
98.41
99.90
100.00
97.00
99.96
4
98.00
98.50
97.00
99.79
98.48
99.96
5
95.47
98.44
96.22
99.79
90.00
99.95
R2
0.8267
0.9775
0.953
3.5 Effects of factors on adsorption
Independent effects of each factor on Cd, Cr and Pb adsorption are presented in Fig. 3a, b and c respectively;
a) Cd adsorption. b) Cr adsorption. c) Pb adsorption.
a Initial concentration
The initial concentration of each metal was varied between 56 mg/L and 175.3 mg/L. The adsorption of each metal was affected positively as initial concentration of the metal increases, which could be due to availability of more adsorptive (Sun et al., 2012). Each metal adsorption was affected negatively as the initial concentrations of other metals increases, which could be due to competition posed by the other ions for the available active sites (Dong et al., 2016). On a general note, when there is equal concentration of the three metals, removal of Pb was favored at lower pH while the removal of Cr was favored at higher pH as shown in Table 4, this could be because Cr6+ is reported to be the most dominant specie of Cr at higher pH and leading to increase in electrostatic force of attraction between the species and adsorbent active sites (Arim et al., 2019)
b pH
This played the most important role in the removal of the respective ions as indicated on Fig. 3. Cd, Cr and Pb adsorptions were affected mostly by pH as shown by the steepness of pH curves in Fig. 3 above, this could be due to reduction in solubility as well as possible precipitation of the metals (Ahuja et al., 1999; Sun et al., 2012). This could also be due to reduction in hydrogen ions (H+) competing for the available active sites as the pH increases (Lü et al., 2017). These increase in adsorption with pH agree with typical cations adsorption behavior (Oyetade et al., 2017; Wang et al., 2018; Shi et al., 2019).
c Contact time
The adsorption efficiencies of the metals at first increase with time which is due to the abundancy of active sites at initial stage of the experiment and begin to reduce as the experiment progresses which is as a result of lesser active sites available (Mouni et al., 2018). The reduction in adsorption after some time could also be due to increase in thickness of boundary layer with contact time, adsorption efficiency reduces as it is been opposed by this boundary layer (Zheng et al., 2018).
d Adsorbent dose
Adsorption efficiencies of all the metals also increases with adsorbent doses, which was as a result of increase in active sites available for adsorption (Xu et al., 2017).
3.6 Some interactive effects on adsorption
The 3-D plot of the interactive effect of pH and initial metal concentration on the adsorption of Cd, Cr and Pb respectively, are presented in Figs. 4, 5 and 6f showed that the removal of the ions increases with these factors, this could be due to the reduction in solubility as pH increases and also more adsorptive available for adsorption as the concentration increases. Competitive adsorption also occurred which could be deduced from decline in adsorption of Pb as concentrations of Cd and Cr increases (Oladipo and Gazi, 2014). This was supported by the 3-D plots presented in Figs. 6a, 6b, 6c, 6e, 6g and 6h.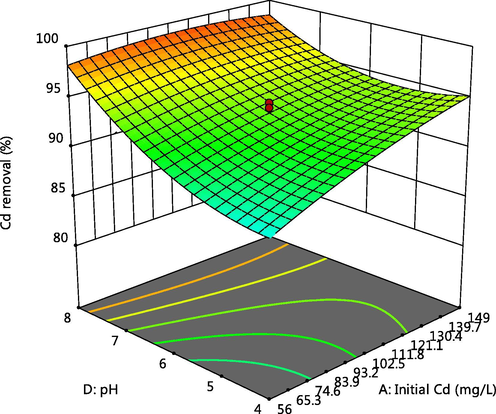
Effect of pH and Cd initial concentration on Cd adsorption.
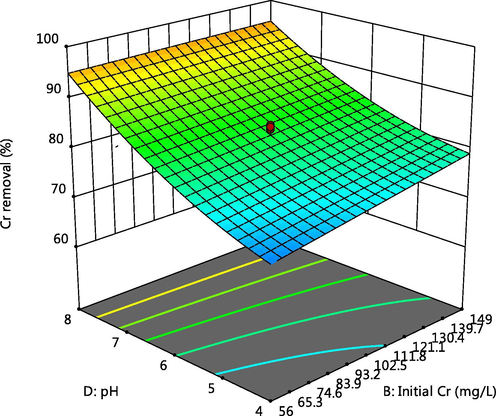
Effect of pH and Cr initial concentration on Cr adsorption.
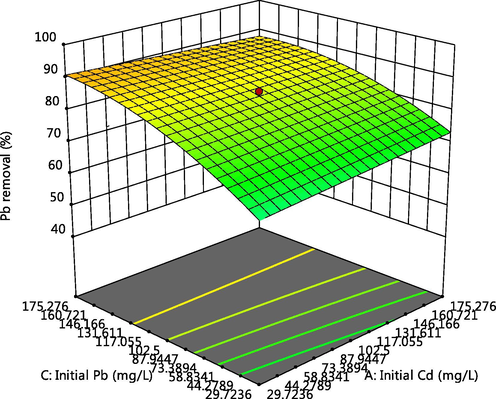
Effect of Pb and Cd initial concentrations on Pb adsorption.
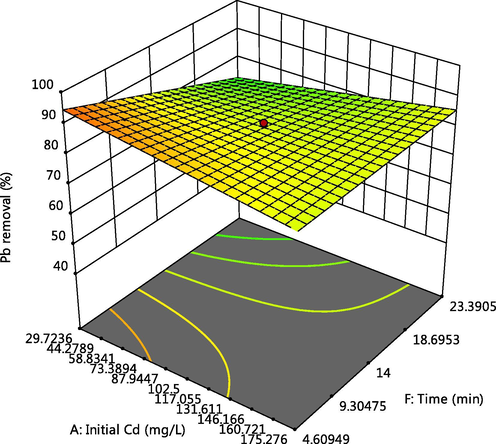
Effect of time and Cd initial concentration on Pb adsorption.
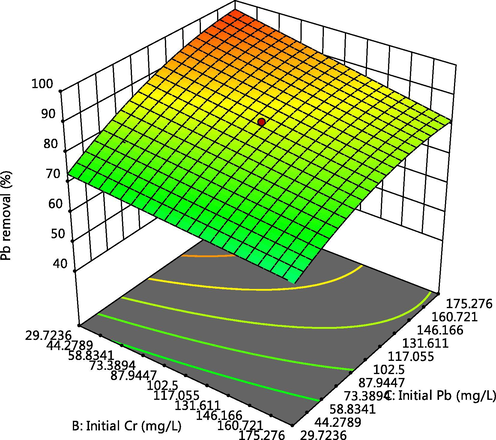
Effect of Cr and Pb initial concentration on Pb adsorption.
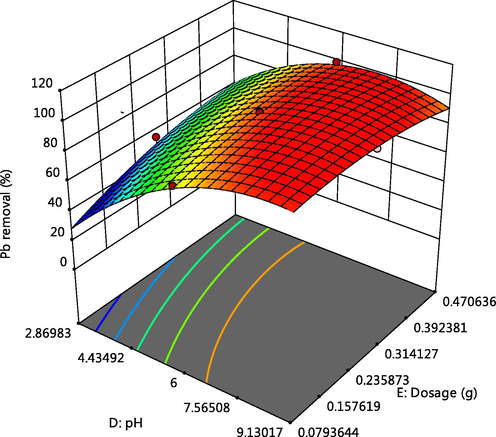
Effect of pH and adsorbent dosage on Pb adsorption.
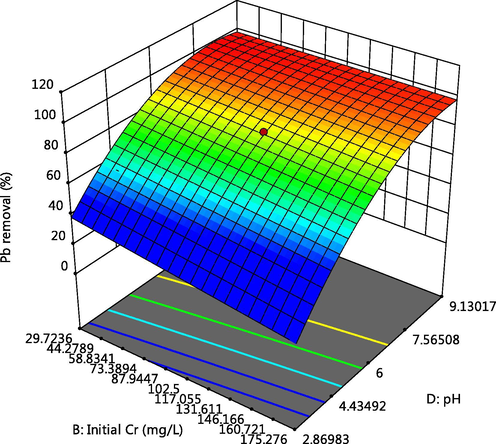
Effect of pH and Cr initial concentration on Pb adsorption.
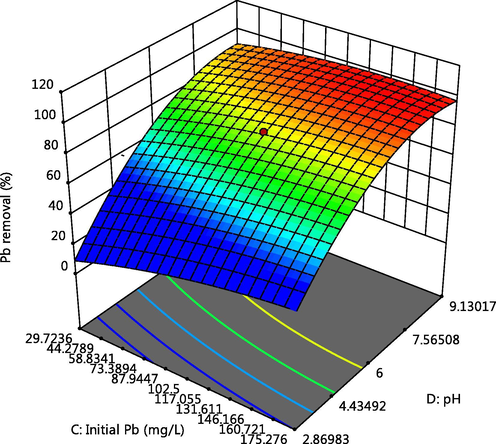
Effect of pH and Pb initial concentration on Pb adsorption.
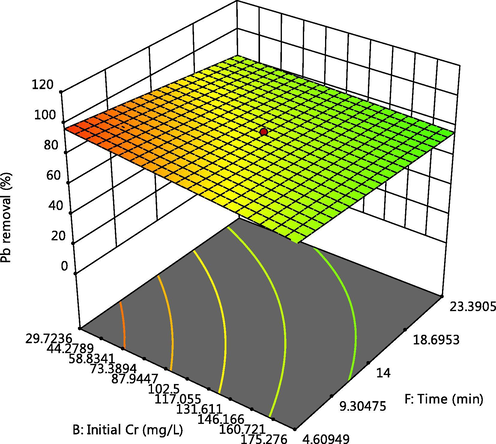
Effect of time and Cr initial concentration on Pb adsorption.
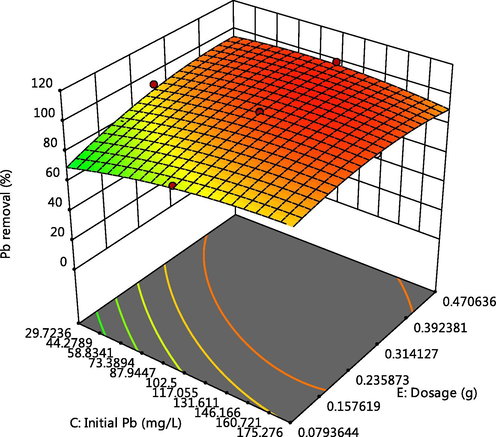
Effect of dosage and Pb initial concentration on Pb adsorption.
3.7 Reuse assessment
The result of the reusability of the adsorbent is shown in the Table 8 below, there was marginal decrease in percentage removal of the ions between the first and second cycle but there was pronounced decrease in percentage removal after the third cycle. This could be due to the reduction in activity of the sites and possible blockade of the pores of the adsorbent (Oladipo et al., 2017).
Cycle
%Cd removal
%Cr removal
%Lead removal
1st
98.76
100
96.89
2nd
92.5
97.3
90.73
3rd
81.7
83.72
73.8
4th
62.8
60.5
48.9
5th
43.5
50.2
39.7
3.8 Real water experiment
The concentrations of metals of interest and pH of the water samples from ABU dam and tannery are presented in Table 9 below, there is a noticeable higher concentration of the metals in TW compared to ABU, which could be resulting of chemicals employed and source of water used in the tannery. The predicted variables for optimum removal of Cd, Cr and Pb from each of the sample water are presented in Table 10. The experimental percentage adsorptions as well as the predicted are shown in Table 11, the differences noticed between the two might occur as a result of competitive adsorption of other constituents in the water and/or modification of the surface functional groups of the adsorbent by impurities which consequently led to increase or decrease in the percentage adsorbed compared to the predicted values.
Parameters
Tannery waste-water (TW)
ABU dam (ABU)
Cadmium (mg/L)
0.11
0.09
Chromium (mg/L)
2.50
0.545
Lead (mg/L)
0.37
0.17
pH
8.5
7.5
Sample
Initial Cd (mg/L)
Initial Cr (mg/L)
Initial Pb (mg/L)
pH
Dosage (g)
Time (min)
%Cd removal
%Cr removal
%Pb removal
Desirability
TW
0.11
2.5
0.37
5.10
0.20
11.7
83.82
100.00
64.40
1.00
ABU
0.09
0.545
0.17
5.40
0.40
18.0
84.80
99.86
74.70
1.00
Sample
%Cd removal
%Cr removal
%Lead removal
Actual
Predicted
Actual
Predicted
Actual
Predicted
TW
62.75
83.82
85.20
100.00
77.83
64.40
ABU
73.00
84.80
82.54
99.86
87.23
74.70
Table 12 showed the residual concentration of Cd, Cr and Pb after adsorption, it can be noticed that their concentrations that were way beyond WHO limit, has been reduced to the extent that some of the metals like Cd in both samples and Pb in ABU water were within permissible limit (WHO, 2004).
Parameter
TW
ABU
WHO guideline
Cd (mg/L)
0.04
0.02
0.03
Cr (mg/L)
0.37
0.09
0.05
Pb (mg/L)
0.08
0.02
0.01
Table 13 showed comparison of adsorption of metals using AC from Acacia senegal with other biomass derived AC.
Adsorbent
Adsorbate
% removal
References
Rice straw biochar
Cd2+
80.8
Gao et al., 2019
Acacia senegal pods
Cd2+
98.76
This work
Xanthate pine bark
Cr3+
98.5
Arim et al., 2019
Peanut shell
Cr6+
99.97
Cai et al., 2018
Acacia senegal pods
Cr3+
100
This work
Wheat straw biochar
Pb2+
98.86
Cao et al., 2019
Modified lignin
Pb2+
71.1
Jin et al., 2019
Acacia senegal pods
Pb2+
96.89
This work
4 Conclusion
In conclusion, the results obtained in this research demonstrate that activated carbon prepared from Acacia senegal pods has high adsorption abilities for adsorption of Cadmium, Chromium and Lead ions from both simulated and real wastewater. pH was noticed to be the most prominent factor followed by the initial concentration of the metal as they affect the adsorption of respective metal positively, the adsorption of metal ions was also noticed to decrease with increase in concentration of other ions in the solution. Recovery and reuse assessment of the adsorbent also showed that the efficiency of the activated carbon for the adsorption reduces appreciably after the third cycle, hence can be employed in water treatment process.
Nevertheless, this work is based on one precursor and limited activation conditions, more extensive researches are needed on optimization of activation conditions as well as other common toxic metals present in water to facilitate the development of adsorption technology for water treatment.
Conflict of interest
The authors declare no conflict of interest.
Acknowledgement
Sincere gratitude of the authors goes to Stat-Ease, Inc., USA for providing trial version of Design-Expert software version 11.0.3 which was employed during the course of this research.
References
- Evaluation of removal efficiency of heavy metals by low-cost activated carbon prepared from African palm fruit. Appl. Water Sci.. 2017;7(6):3151-3155.
- [CrossRef] [Google Scholar]
- Absorption table. (2014). Infrared Spectroscopy Absorption Table. Retrieved September 10, 2018 from https://chem.libretexts.org/Reference/Reference_Tables/Spectroscopic_Parameters/Infrared_Spectroscopy_Absorption_Table.
- Isothermal and Batch Adsorption Studies of the Use of Borassus aethiopium and Cocos nucifera for Wastewater Treatment. Am. Int. J. Contemp. Res.. 2012;2(7):119-130.
- [Google Scholar]
- Poly (amidoxime) modified magnetic activated carbon for chromiumand thallium adsorption: Statistical analysis and regeneration. Process Safety Environ.. 2019;121:254-262.
- [CrossRef] [Google Scholar]
- Zn2C biosorption by Oscillatroria anguistissima. Process Biochem.. 1999;34:77-85.
- [CrossRef] [Google Scholar]
- Application of coconut shell's activated carbon for heavy metal removal from wastewater. Am.-Eurasian J. Toxicol. Sci.. 2016;8(2):77-82.
- [CrossRef] [Google Scholar]
- Biosorption of Zinc on to Gracilaria corticata (Red Algae) Powder and Optimization using Central Composite Design. J. Appl. Sci. Eng. Methodologies. 2016;2(3):412-425.
- [Google Scholar]
- Modification of commercial activated carbon for the removal of 2,4-dichlorophenol from simulated wastewater. J. King Saud Univ.-Sci.. 2015;27:318-330.
- [Google Scholar]
- APHA.1999. Standard Methods for the Examination of Water and Wastewater.
- Uptake of trivalent chromium from aqueous solutions by xanthate pine bark: characterization, batch and column studies. Process Saf. Environ. Prot.. 2019;121:374-386.
- [CrossRef] [Google Scholar]
- Applicability of activated carbon obtained from peach stone as an electrochemical sensor for detecting caffeine. J. Electroanal. Chem. 2018
- [CrossRef] [Google Scholar]
- The trace metal levels in milk and dairy products consumed in middle Anatolia-Turkey. J. Environ. Monit. Assess.. 2009;152:1-12.
- [Google Scholar]
- Health risk assessment of some frequently consumed yoghurt in malumfashi local government area, Katsina State. ATBU J. Sci., Technol. Educ.. 2016;4(2):122-132.
- [Google Scholar]
- Heavy metals removal from industrial wastewater by activated carbon prepared from coconut shell. Res. J. Chem. Sci.. 2013;3(8):3-9.
- [Google Scholar]
- Evaluation of tannery effluent content in Kano metropolis, Kano State Nigeria. Int. J. Phys. Sci.. 2015;10(9):306-310.
- [Google Scholar]
- Statistics for Experimenters: An Introduction to Design, Data Analysis and Model Building. New York: Wiley; 1987.
- Abatement of heavy metals concentration in mine wastewater using activated carbons prepared from coconut shells in a gas-fired static bed pyrolysis/activation reactor. Ghana J. Technol.. 2016;1(1):46-52.
- [Google Scholar]
- Cadmiuma (2018). International Programme on Chemical Safety. World Health Organization, Retrieved August 22, 2018 from http://www.who.int/ipcs/assessment/public_health/cadmium/en/.
- Synthesis of peanut shell based magnetic activated carbon with excellent adsorption performance towards electroplating wastewater. Chem. Eng. Res. Des. 2018
- [CrossRef] [Google Scholar]
- Carbonization and ball milling on the enhancement of Pb(II) adsorption by wheat straw: Competitive effects of ion exchange and precipitation. Bioresour. Technol.. 2019;273:70-76.
- [CrossRef] [Google Scholar]
- Modern Analytical Chemistry. USA: McGraw-Hill; 2000.
- Design expert. (2018). Design-Expert software version 11.0.3. Stat-Ease, Inc., Minneapolis, MN 55413, USA.
- Efficient and selective adsorption of multi-metal ions using sulfonatedcellulose as adsorbent. Carbohydr. Polym.. 2016;151:230-236.
- [CrossRef] [Google Scholar]
- Response Surface Methods Optimization of Ni2+ Adsorption On Activated Carbon Prepared From Hazelnut Shells. Anadolu Univ. J. Sci. Technol. A-Appl. Sci. Eng.. 2017;18(1):1-12.
- [Google Scholar]
- Relative distribution of Cd2+ adsorption mechanisms on biochars derived from rice straw and sewage sludge. Bioresour. Technol.. 2019;272:114-122.
- [CrossRef] [Google Scholar]
- Potential of Borassus aethiopum shells as precursor for activated carbon preparation by physico-chemical activation; optimization, equilibrium and kinetic studies. J. Environ. Chem. Eng.. 2014;2:1423-1433.
- [CrossRef] [Google Scholar]
- Optimization of adsorption conditions using central composite design for the removal of copper (II) and lead (II) by defatted papaya seed. Karbala Int. J. Mod. Sci.. 2016;2:20-28.
- [Google Scholar]
- Evaluation of optimum adsorption conditions for Ni (II) and Cd (II) removal from aqueous solution by modified plantain peels (MPP) Beni-Suef Univ. J. Basic Appl. Sci.. 2016;5:170-179.
- [Google Scholar]
- Application of factorial and response surface methodology in modern experimental design and optimization. Crit. Rev. Anal. Chem.. 2006;36 3–4, 141–151
- [CrossRef] [Google Scholar]
- Gum Arabic tree (n.d). Retrieved February 5, 2018 from www.feedipedia.org/node/342.
- Manual of symbols and terminology for physicochemical quantities and units. London: Butterworths; 1972.
- Integrated criteria document chromium: effects. Appendix. Bilthoven, Netherlands. Nat. Inst. Publ. Health Environ. Prot. 1990
- [Google Scholar]
- Efficient adsorption of methylene blue and lead ions in aqueous solutions by 5-sulfosalicylic acid modified lignin. Int. J. Biol. Macromol.. 2019;123:50-58.
- [CrossRef] [Google Scholar]
- Application of response surface methodology and artificial neural network methods in modelling and optimization of biosorption process. Bioresour. Technol.. 2014;160:150-160.
- [Google Scholar]
- Response surface methodology approach for optimization of biosorption process for removal of Cr(VI), Ni(II) and Zn(II) ions by immobilized bacterial biomass sp. Bacillus brevis. Chem. Eng. J.. 2009;146:401-407.
- [CrossRef] [Google Scholar]
- Lead (2018). Retrieved March 22, 2018 from http://www.who.int/ipcs/assessment/public_health/lead/en/.
- Green Practices to Save Our Precious “Water Resource”. In: Sharma K.S., Shangai R., eds. Advances in Water Treatment and Pollution Prevention. Dordrecht: Springer Science Business Media; 2012.
- [CrossRef] [Google Scholar]
- Kinetic and thermodynamic studies on adsorption of Cu2+, Pb2+, methylene blue and malachite green from aqueous solution using AMPS-modified hazelnut shell powder. Chem. Res. Chin. Univ.. 2017;33:112-118.
- [Google Scholar]
- Preparation and molten salt-assisted KOH activation ofporous carbon nanofibers for use as supercapacitor electrodes. J. Porous Mater.. 2017;24:1437-1445.
- [Google Scholar]
- Activated carbon. 2006
- [CrossRef]
- Removal of methylene blue from aqueous solutions by adsorption on Kaolin: kinetic and equilibrium studies. Appl. Clay Sci.. 2018;153:38-45.
- [Google Scholar]
- Physicochemical and Bacteriological Assessment of Tannery Effluent from Samaru-Zaria, Kaduna State, Nigeria. J. Appl. Sci. Environ. Manag.. 2017;21(4):734-740.
- [Google Scholar]
- Response Surface Methodology. Allyn and Bacon, Boston; 1971.
- Green synthesis of CuO nanoparticles using aqueous extract of Thymus vulgaris L. leaves and their catalytic performance for N-arylation of indoles and amines. J. Colloid Interface Sci.. 2016;466:113-119.
- [Google Scholar]
- Removal of heavy metals from simulated wastewater using physically and chemically modified palm shell activated carbon. J. Appl. Sci.. 2014;14(12):1294-1298.
- [CrossRef] [Google Scholar]
- Microwaves initiated synthesis of activated carbon-based composite hydrogel for simultaneous removal of copper(II) ions and direct red 80 dye: A multi-component adsorption system. J. Taiwan Inst. Chem. Eng. 2014
- [CrossRef] [Google Scholar]
- Bio-derived MgO nanopowders for BOD and COD reduction from tannery wastewater. J. Water Process Eng.. 2017;16:142-148.
- [CrossRef] [Google Scholar]
- Preparation of phosphoric acid activated carbons from Canarium Schweinfurthii Nutshell and its role in methylene blue adsorption. J. Chem. Eng. Mater. Sci.. 2015;6(2):9-14.
- [Google Scholar]
- Experimental and DFT studies on the selective adsorption of Pb2+ and Zn2+ from aqueous solution by nitrogen-functionalized multiwalled carbon nanotubes. Sep. Purif. Technol.. 2017;188:174-187.
- [Google Scholar]
- Process Optimization. (2018). Retrieved 30 May, 2018 from https://www.heflo.com/blog/process- optimization/what-is-process-optimization/.
- The minerals and heavy metals in cow’s milk from China and Japan. J. Health Sci.. 2009;55(2):300-305.
- [Google Scholar]
- Synthesis and characterization of activated carbon from the biomass of Saccharum bengalense for electrochemical supercapacitors. J. Storage Mater.. 2018;20:418-426.
- [CrossRef] [Google Scholar]
- Synthesis and characterization of activated carbon produced from kenaf core fiber using H3PO4 activation. Procedia Chem.. 2016;19:558-565.
- [Google Scholar]
- Evaluation of metal oxides and activated carbon for lead removal: Kinetics, isotherms, column tests, and the role of co-existing ions. Sci. Total Environ.. 2019;648:176-183.
- [CrossRef] [Google Scholar]
- Spectroscopic tools. (2018). Accessed on September 10, 2018 from http://www.science-and-fun.de/tools/.
- Heavy Metal Removal Through Biosorptive Pathways. In: Sharma K.S., Shangai R., eds. Advances in WaterTreatment and Pollution Prevention. Dordrecht: Springer Science Business Media; 2012.
- [CrossRef] [Google Scholar]
- Effect of pyrolysis temperatures and times on the adsorption of cadmium onto orange peel derived biochar. Waste Manag. Res.. 2016;34(2):129-138.
- [Google Scholar]
- USGS (2018). Domestic water use. Retrieved from https://water.usgs.gov/edu/wudo.html on 21 March, 2018.
- Characteristics and mechanisms of cadmium adsorption onto biogenic aragonite shells derived biosorbent: Batch and column studies. J. Environ. Manage. 2018
- [CrossRef] [Google Scholar]
- Sorption and desorption of Pb(II) to biochar as affected by oxidation and pH. Sci. Total Environ.. 2018;634:188-194.
- [Google Scholar]
- Water Pollution (n.d). Retrieved February 5, 2017 from http://www.nios.ac.in/media/documents/313courseE/L34.pdf.
- WHO.Retrieved 21 March, 2018 from http://www.who.int/topics/water/en/.
- World Health organization (WHO, 2004): Guidelines for Drinking Water Quality. 3rd Edition, Vol. 1, Geneva, Switzerland.
- Production and Characterization of Active Carbon from Epicarp of Balanite aegyptiaca and Detarium mirocarpum Shells. Int. J. Sci. Technoledge. 2016;4(3):19-25.
- [Google Scholar]
- Fabrication of reduced glutathione functionalized iron oxide nanoparticles for magnetic removal of Pb(II) from wastewater. J. Taiwan Inst. Chem. Eng.. 2017;71:165-173.
- [Google Scholar]
- Characterization of activated carbon prepared by phosphoric acid activation of olive stonses. Arabian J. Chem.. 2011;9:S1155-S1162.
- [Google Scholar]
- Pore classification in the characterization of porous materials: a perspective. Cent. Eur. J. Chem.. 2007;5(2):385-395.
- [CrossRef] [Google Scholar]
- Promotion Effects of Nitrogenous and Oxygenic Functional Groups on Cadmium (II) Removal by Carboxylated Corn Stalk. J. Cleaner Prod. 2018
- [CrossRef] [Google Scholar]


