

Total concentration, speciation, source identification and associated health implications of trace metals in Lemna dumpsite soil, Calabar, Nigeria
⁎Corresponding author. godwinebong@uniuyo.edu.ng (G.A. Ebong)
-
Received: ,
Accepted: ,
This article was originally published by Elsevier and was migrated to Scientific Scholar after the change of Publisher.
Peer review under responsibility of King Saud University.
Abstract
Total concentration, speciation, sources and potential health problems of Pb, Cd, Cu, Fe and Ni in a dumpsite soil within Calabar Municipality were evaluated in this work. The influence of organic matter and pH of the studied dumpsite soil on metal availability was also assessed. Results obtained indicated that; mean concentration of all the metals were higher in studied dumpsite soil than in the Control and higher than their recommended limits for Nigerian soil as well. Metal speciation revealed that, Pb and Fe existed mainly in the reducible form; Cd occurred in acid extractable fraction, Cu in oxidisable form while Ni existed primarily in inert (residual) fraction. Pb and Cu originated primarily from anthropogenic source whereas, natural source contributed mostly to the existence other metals in studied soil. All the environmental models utilized confirmed that, the studied dumpsite soil has been highly contaminated by these metals. Principal component analysis identified impact of wastes and industrial/agricultural wastes as the two major factors affecting the studied soil. Cluster analysis recognized the parameters with similar chemical properties and common source. Metals assessed exhibited variable correlations among themselves, while soil organic matter and pH displayed both significant positive and negative influence on metal availability. Results obtained identified Pb as the element with high risk potential in the studied soil and children as the highly vulnerable class.
Keywords
Soil pollution
Speciation
Metal pollution index
Calabar Municipality
Potential ecological risk index and non-carcinogenic risks

1 Introduction
Urban soils are highly contaminated by both essential and non essential metals from anthropogenic sources such as industrial and domestic wastes, vehicular emissions, combustion of fossil fuels, atmospheric depositions (Ebong et al., 2015; Ebong and Moses, 2016; Facchinelli et al., 2001; Li et al., 2008; Nabuloa et al., 2006; Nicholson et al., 2003). These metals also emanate from natural soil forming processes but their quantities are rarely above recommended limits (Kabata-Pendias and Pendias, 2001; Pierzynski et al., 2000). The persistent and non-biodegradable nature of metals in soil has made their elimination from soil environment almost impossible. Consequently, there has been persistent negative influence by these metals on human beings and other living cells exposed directly or indirectly to these toxic metals as indicated in literature (Birke and Rauch, 2000; Grzebisz et al., 2002; Lawan et al., 2012; Nicholson et al., 2003). Lăcătuşu et al. (1996) reported that, contamination of soil and vegetables by metals in Romania reduced life expectancy of people in the affected areas by 9–10 years. Thus, assessing metal load in urban soils has become a necessary and routine task to forestall bioaccumulation of these metals and their associated health implications. Metals exist in soil in different chemical forms, which influence their reactivity and hence their mobility and bioavailability (Nelson and Donkin, 1985; Ratuzny et al., 2009). Nevertheless, previous studies within the study area concentrated mainly on the accumulation of total metals in soil without assessing metal species, influence of soil factors, associated health risks and source of these metals. Alborès et al. (2000) reported that, assessing total metal content in soil is a vital step in evaluating concentration of metals in contaminated soils, but cannot provide the necessary information on the risks associated with the metal. Risks associated with the presence of trace metals in soil vary and depend mainly on their chemical forms (Kirpichtchikova et al., 2006). An accurate assessment of trace metals, their forms in soil and their dependence on soil properties is the foundation for proper soil management hence, will reduce drastically their negative impacts on the environment (Aydinalp and Marinova, 2003). Thus, this research was undertaken to assess the total metal concentration; their different species, their sources, associated health risks and pollution status of studied dumpsite soil. This study also appraised the influence of soil organic matter and pH on the concentration of total metals and their species. Above all, this research did a comprehensive evaluation of a particular waste contaminated soil environment within a specific area.
2 Materials and methods
2.1 Study location
This study was conducted in a contaminated soil beneath a municipal waste dumpsite located along Lemna Road, Calabar. Calabar is the capital of Cross River state in Niger Delta Region of Nigeria. It lies between latitude 04° 57! and 05° 05! N and longitude 08° 19! and 08° 25! E. Calabar Municipality covers an area of about 406 square kilometers with a population of over 370,000. Calabar Municipality is characterized by two major seasons namely: dry and wet seasons. The dry season lasts 3–4 months while the wet season lasts longer between 8 and 9 months. Calabar Municipality has a mean rainfall of 2360 mm and mean relative humidity between 82 to 87%. The mean daily minimum temperature ranges from 21 to 24 °C and the mean maximum from 27 to 30 °C. Calabar experiences high industrial and commercial activities consequently; the volume of waste materials generated within the municipality is high. The studied dumpsite is an open one with waste materials such as broken glasses, garbage, sludge, plastics, demolition wastes, hospital wastes, human and animal wastes, industrial and agricultural wastes, commercial wastes, abandoned automobile wastes etc (Fig. 1).
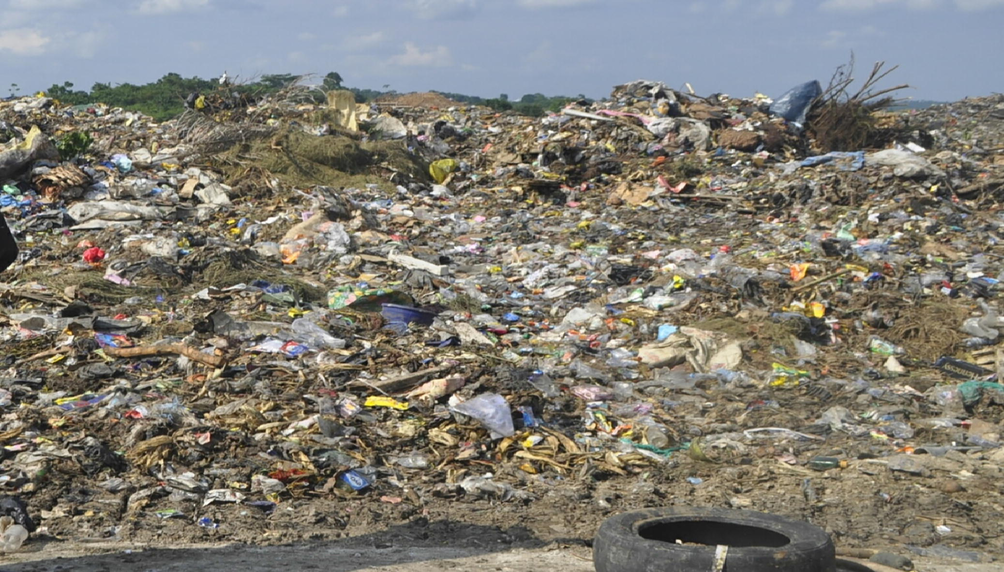
- Waste Materials at Lemna Dumpsite in Calabar Municipality.
2.2 Sample collection, treatment and analysis of total metals
Top soil samples were obtained from four different locations within Lemna dumpsite soil in Calabar Municipality after removing the waste materials from the surface of the soil. At each location, three sub-samples were obtained and merged together to form one composite sample for the location. Sample collection was done between January and March 2014 during the dry season of the study area to avoid leaching of metal into sub-soil by rainwater. Top soil samples were also collected from 50 m away from the studied dumpsite and used as Control. Top soil was collected by using Soil Auger to obtain soil from the depth of 0–15 cm. A total of thirty-six sub-samples and four composite samples were obtained for this study. Samples and Control were air dried for three days, ground and sieved using a 2 mm mesh. One gram of the sieved samples and Control was mixed with Aqua Regia and digested on a hot plate. The filtrate obtained was used for the determination of total Pb, Cd, Cu, Fe and Ni levels using Agilent 710 inductively Coupled Plasma Optical Emission Spectrometer (ICP-OES).
2.3 Metal speciation procedures
Optimized BCR procedures were used for the sequential extraction of metal fractions from soil as described by Rauret et al. (2000). Fraction 1 (Acid extractable): To 1 g of sieved soil sample, 40 ml of 0.11 M CH3COOH solution was added. The mixture shaken with a mechanical shaker at room temperature for hours and extract separated by centrifugation at 3000 rpm and stored in polyethylene bottles. Fraction 2 (Reducible): 40 ml of 0.50 M NH2OH. HCl solution was added to the residue from step 1, shaken for hours at room temperature and centrifuged to separate the supernatant from the residue. Fraction 3 (Oxidisable): Residue from step 2 was treated with 10 ml 8.8 M H2O2 and allowed to digest for 1 h. The mixture was evaporated to dryness and 50 ml of 11 M CHCOONH4 added, shaken for hours at room temperature and centrifuged to separate the extract from residue. Fraction 4 (Residual): To the residue from step 3, a mixture of 5 ml Conc. HNO3 and 15 ml Conc. HCl was added and placed on hot plate for 2 h. The mixture was cooled and filtered through Whatman No. 50 filter paper into a volumetric flask for analysis. The different filtrates obtained were used for the determination of concentration of different metal fractions using Agilent 710 inductively Coupled Plasma Optical Emission Spectrometer (ICP-OES).
2.4 Determination of soil properties
2.4.1 Soil pH and organic matter
pH of studied dumpsite soil and Control was determined in a 1: 2.5 (v/v) soil/water suspension as described by Van Reeuwijk (1993).
Soil organic in studied soil and Control was measured by wet oxidation methods of Walkley and Black as reported by Ebong et al. (2014).
2.5 Determination of pollution status of trace metals and studied dumpsite soils
2.5.1 Metal pollution index (MPI)
Metal pollution index (MPI) according to Lacatusu (2000) indicates the relationship between metal in studied soil and in reference soil (Control); it was determined in this study using Eq. (1).
The classifications of MPI according to Lacatusu (2000) are given in Table 1 below:
| MPI | Significance | Remarks |
|---|---|---|
| <0.1 | Very slight contamination | No negative effect on soil, plant and environment |
| 0.10–0.25 | Slight contamination | No negative effect on soil, plant and environment |
| 0.26–0.5 | Moderate contamination | No negative effect on soil, plant and environment |
| 0.51–0.75 | Severe contamination | No negative effect on soil, plant and environment |
| 0.76–1.00 | Very severe contamination | No negative effect on soil, plant and environment |
| 1.1–2.0 | Slight pollution | Will pose negative effect on soil, plant and environment |
| 2.1–4.0 | Moderate pollution | Will pose negative effect on soil, plant and environment |
| 4.1–8.0 | Severe pollution | Will pose negative effect on soil, plant and environment |
| 8.1–16.0 | Very severe pollution | Will pose negative effect on soil, plant and environment |
| >16.0 | Excessive pollution | Will pose negative effect on soil, plant and environment |
2.5.2 Degree of contamination (Cdeg)
Degree of contamination of each location within the studied dumpsite soil was calculated using Eq. (2) below:
The different classifications of Cdeg according to Hakanson (1980) are as follows: Cdeg < 8 = low degree of contamination, 8 < Cdeg < 16 = moderate degree of contamination, 16 < Cdeg < 32 = considerable degree of contamination and 32 < Cdeg = very high degree of contamination.
2.5.3 Enrichment factor (EF)
Enrichment factor (EF) used for identification of source of trace metals in studied dumpsite soil was determined using Eq. (3).
2.5.4 Percentage of enrichment factor (EF%)
Percentage of enrichment factor (EF%) was determined using Eq. (4) as proposed by Zonta et al. (1994).
2.5.5 Geoaccumulation index (Igeo)
Geo-accumulation index (Igeo) of trace metals was determined using Eq. (5) below:
2.5.6 Pollution load index (PLI)
Pollution load index (PLI) of metals in a particular location was obtained using Eq. (6).
2.5.7 Ecological risk factor (Eir)
Ecological risk factor used for the expression of potential ecological risk for a particular metal in studied dumpsite soil was determined using Eq. (7).
2.5.8 Potential ecological risk factor (RI)
Potential ecological risk factor (RI) of all the metals determined in studied dumpsite soil was calculated using Eq. (8).
| Grade | Eir value | Grade of ecological risk of single trace metal | RI | Grade of potential ecological risk of the environment |
|---|---|---|---|---|
| A | Eir < 40 | Low ecological risk | RI < 150 | Low ecological risk |
| B | 40 < Eir ≤ 80 | Moderate ecological risk | 150 < RI < 300 | Moderate ecological risk |
| C | 80 < Eir ≤ 160 | Appreciable ecological risk | 300 < RI < 600 | High ecological risk |
| D | 160 < Eir ≤ 320 | High ecological risk | RI ≥ 600 | Significantly high ecological risk |
| E | Eir > 320 | Serious ecological risk |
2.5.9 Pollution intensity (Ipoll)
Pollution intensity (Ipoll) of studied dumpsite soil was appraised using Eq. (9) below:
2.6 Percentage recovery was determined using Eq. (10)
2.7 Mobility factor (MF) was calculated using Eq. (11) below
2.8 Health risk assessment
2.8.1 Daily intake (DI)
Risk associated with human exposure to these metals in studied dumpsite soil was carried out to appraise the non-cancer toxicity on people within the study area. This was calculated using USEPA (1989) and HESP model (Veerkamp and Ten-Berge, 1999). Daily Intake (DI) of soil ingested was verified using Eq. (12).
| Parameters | Values Applied |
|---|---|
| Ingestion rate (IR) (mg/day) | 0.0002 kg/day – child a,b |
| 0.0001 kg/day – adult a,b | |
| Exposure frequency (day/yr) | 350 days/yearc |
| Exposure duration (yr) | 6 years – childb |
| 30 years – adultb | |
| Average time for non-carcinogens (day/yr) | 365 days/yeard |
| Body weight (kg) | 15 kg – childad |
| 70 kg – adultd |
2.8.2 Non-carcinogenic risk (HQ)
Non-carcinogenic risk for individual metal expressed as hazard quotient was evaluated using Eq. (13).
2.8.3 Total chronic hazard index (THI)
Total chronic hazard index (THI) which is the sum of all the individual hazard quotients (HQ) was determined using Eq. (14).
3 Results and discussion
3.1 Total metals, organic matter and pH in studied dumpsite soil and Control
Results in Table 4 indicate total concentration (mg/kg) of metals and some physicochemical properties of studied dumpsite soil and Control.
| Location | Pb | Cd | Cu | Fe | Ni | OM (%) | pH |
|---|---|---|---|---|---|---|---|
| North | 193.14 | 1.24 | 45.85 | 2241.19 | 46.26 | 12.76 | 7.21 |
| East | 196.42 | 1.06 | 43.16 | 2135.56 | 45.75 | 12.34 | 7.16 |
| South | 211.75 | 1.35 | 46.23 | 2248.27 | 51.03 | 12.81 | 7.23 |
| West | 209.87 | 1.12 | 41.84 | 2236.36 | 57.82 | 12.66 | 7.18 |
| Min | 193.14 | 1.06 | 41.84 | 2135.56 | 45.75 | 12.34 | 7.16 |
| Max | 211.75 | 1.35 | 46.23 | 2248.27 | 57.82 | 12.81 | 7.23 |
| Mean | 202.80 | 1.19 | 44.27 | 2215.36 | 50.22 | 12.64 | 7.20 |
| SD | 9.38 | 0.13 | 2.12 | 53.41 | 5.60 | 0.21 | 0.03 |
| Control | 6.10 | 0.66 | 3.47 | 368.51 | 4.38 | 4.37 | 5.65 |
Results for the concentration of total metals, organic matter and pH in studied dumpsite soil and Control are shown in Table 4. Results in Table 4 show a range of 193.14–211.75 mgkg−1 and a mean concentration of 202.80 ± 9.38 for Pb. The obtained mean is higher than 6.10 mgkg−1recorded in the Control sample, indicating additional source of the metal at the studied dumpsite soil. The mean is also higher than 1.60 mgkg−1 limit for Pb in Nigerian soil by FEPA (1997). Concentrations of Cd varied between 1.06 mgkg−1 and 1.35 mgkg−1 with a mean concentration of 1.19 ± 0.13 mgkg−1. The obtained mean is higher than 0.6 mgkg−1 recorded in the Control thereby revealing anthropogenic inputs of Cd at dumpsite soil studied. The obtained mean of Cd is higher than 0.80 mgkg−1 as well recommended for soil by FEPA (1999). The range and mean concentrations of Cu shown in Table 4 are 41.84–46.23 mgkg−1 and 44.27 ± 2.12 mgkg−1respectively. Relatively, this mean is higher than 3.47 mgkg−1reported in Control site thus, indicating that waste materials at the studied dumpsite could have contributed significant amount of Cu to soil environment beneath. The obtained mean concentration of Cu is higher than the stipulated limit for Nigerian (10.10 mgkg−1) by FEPA (1999). Distribution of Fe within the studied dumpsite soil ranged from 2135.56 mgkg−1 to 2248.27 mgkg−1. A mean concentration of 2215.36 ± 53.41 mgkg−1 was recorded for Fe, which is higher than 368.51 mgkg−1 obtained in Control sample. This signifies the presence of Fe-containing waste materials at studied dumpsite that are leached into the underlying soil. The mean concentration of Fe reported is higher than 400.00 mgkg−1 recommended by FEPA (1997) for soil in Nigeria. Results obtained for Ni ranged between 45.75 mgkg−1 and 57.82 mgkg−1 with a mean of 50.22 ± 5.60 mgkg−1. This mean is relatively higher than 4.38mgkg−1recorded in the Control sample thereby indicating the presence of Ni-containing wastes at the studied dumpsite. The obtained mean is also higher than 35.00 mgkg−1 stipulated for Nigerian soil by FEPA (1999).
Organic matter (OM) content of the studied dumpsite soil ranged between 12.34 and 12.81%. A mean OM content obtained (12.64 ± 0.21%) is much higher than 4.37% recorded in Control site. This higher OM content of studied dumpsite soil maybe attributed to the presence of high quantity of biodegradable waste materials (Yahaya et al., 2009). The high organic matter content of dumpsite soil encourages the cultivation of dumpsite soil by local farmers which is risky for living organisms along the food chain. pH of studied dumpsite soil varied from 7.16 to 7.23 with a mean of 7.20 ± 0.03. The obtained range is favourable for availability of mineral elements for most crops (Sanchez et al., 2003). This condition coupled with high organic content could be responsible for luxuriant plant growth at waste dumpsite soil. The mean pH obtained in studied dumpsite soil is higher than the pH level of Control (5.65). This could be attributed to low organic matter in the Control site which may permit a high leaching rate by rainwater. Generally, the ranges obtained for trace metals in this study are lower than recent values reported by Ediene and Umoetok (2017) for a dumpsite soil within Calabar Municipality. This could be attributed to discrepancy in age of dumpsite, volume and type of waste materials as reported by Awokunmi et al. (2010) and Olufunmilayo et al. (2014). The general results obtained for total metals also indicated that, mean concentration of all the metals assessed were higher than their recommended limits for Nigerian soil by FEPA. Thus, these metals could be regarded as pollutants in the studied dumpsite soil. However, since toxicity and mobility of metals in soil have directly relationship with their forms it is their speciation that can identify their potential risks.
3.2 Speciation of trace metals
Results obtained for the optimized BCR sequential extraction of metal species are shown in Table 5 above. Results obtained revealed that at both studied dumpsite soil and Control, Pb associated mostly with oxides of iron and manganese (reducible form). The obtained results also indicate that, reducible fraction contributed 43.78% and 33.98% of the total Pb fractions in studied dumpsite soil and Control respectively. This result is consistent with that reported by Ekwere et al. (2014) in urban soil within South-Eastern Nigeria. The availability of Pb mainly in reducible form is an indication of anthropogenic inputs (Farkas et al., 2007; Samannidou and Fytianos, 1987). Result obtained for speciation of Pb in studied soil and Control as shown in Table 5 follows the order: Reducible > Oxidisable > Residual > Acid Extractable. Pb displayed a low mobility factor value of 17 but a high percentage recovery (94%). The low mobility of Pb reported could be credited to high organic content and pH of the studied dumpsite soil (Essen and El-Bassam, 1981; Evans et al., 1995).
| AEX F1 |
% | RED F2 |
% | OX F3 |
% | RES F4 |
% | TF | TM | % REC |
MF | |
|---|---|---|---|---|---|---|---|---|---|---|---|---|
| Pb | 131.76 | 17.20 | 335.11 | 43.78 | 157.69 | 20.60 | 140.97 | 18.42 | 765.53 | 811.18 | 94 | 17 |
| Cd | 1.55 | 34.44 | 1.23 | 27.33 | 1.00 | 22.22 | 0.72 | 16.00 | 4.50 | 4.77 | 94 | 34 |
| Cu | 30.10 | 17.72 | 41.83 | 24.70 | 73.08 | 43.15 | 24.43 | 14.43 | 169.35 | 177.08 | 96 | 18 |
| Fe | 847.86 | 9.93 | 3617.54 | 42.40 | 1543.76 | 18.09 | 2523.83 | 29.58 | 8532.99 | 8861.38 | 96 | 10 |
| Ni | 27.26 | 14.15 | 36.39 | 18.89 | 46.96 | 24.37 | 82.07 | 42.59 | 192.68 | 200.86 | 96 | 14 |
| Control | ||||||||||||
| Pb | 0.18 | 17.48 | 0.35 | 33.98 | 0.23 | 22.33 | 0.27 | 26.21 | 1.03 | 1.10 | 94 | 18 |
| Cd | 0.21 | 33.87 | 0.17 | 27.42 | 0.14 | 22.58 | 0.10 | 16.13 | 0.62 | 0.66 | 94 | 34 |
| Cu | 0.75 | 22.80 | 0.87 | 26.44 | 1.09 | 33.13 | 0.58 | 17.63 | 3.29 | 3.47 | 95 | 23 |
| Fe | 66.27 | 18.73 | 130.08 | 36.75 | 74.03 | 20.92 | 83.54 | 23.60 | 353.92 | 368.51 | 96 | 19 |
| Ni | 0.72 | 16.82 | 0.87 | 20.33 | 0.98 | 22.90 | 1.71 | 39.95 | 4.28 | 4.38 | 98 | 17 |
Cd existed mostly in acid extractable fraction in both studied dumpsite soil and Control with 34.44% and 33.87% respectively. Thus, Cd is highly available and mobile in the studied area as indicated in the obtained high mobility factor of 34. This is in agreement with that reported by Olajire et al. (2003) in soil within Southern Nigeria. The high mobility of Cd is consistent with reports that the metal is highly mobile and metals existing mostly in acid extractable fraction are highly mobile (Nessner and Esposito, 2010; Prasad and Freitas, 2003). This result also confirmed that; Cd-containing waste materials at the studied dumpsite could have contributed some Cd into the underlying soil. Accordingly, Cd could be readily available in the studied dumpsite soil which is risky hence; should be closely monitored and controlled. The percentage recovery of Cd as shown in Table 5 above is 94%. Results for speciation of Cd in dumpsite soil and Control followed the order: Acid extractable > Reducible > Oxidisable > Residual; this shows that, Cd was more in the mobilisable fractions.
Cu occurred mainly in Oxidisable form (fraction bound to organic matter and sulphide) in both studied dumpsite soil and Control. Oxidisable fraction of Cu constituted 43.15% and 33.13% of the total fractions in dumpsite soil and Control respectively. The existence of Cu more in the oxidisable fraction in studied dumpsite soil corroborates the finding by Karakaševa et al., 2012. This could be accredited to the tendency of the metal to form organic-Cu complexes with organic matter (Haung et al., 2007). Consequently, Cu as an essential element may not be readily available for plant uptake however; under strong oxidizing conditions it could be released into the environment (Ashraf et al., 2012). Cu showed a low mobility factor of 18 and a high recovery percentage of 96%. The low mobility factor of Cu may be attributed to the high organic matter content of the studied dumpsite soil (Haung et al., 2007). Speciation of copper in both the studied dumpsite soil and Control site followed the trend: Oxidisable > Reducible > Acid extractable < Residual.
Results in Table 5 show that, Fe existed mainly as oxides and hydroxides (Reducible fraction) in both studied dumpsite soil and Control. Reducible fraction contributed 42.40% and 36.75% to the total Fe fractions in dumpsite soil and Control respectively. The existence of Fe mostly in reducible fraction in studied soil is similar to that reported by Adewuyi and Osobamiro (2016). This could be attributed to the high affinity of Fe for oxides (Abollino et al., 2006). Fe as an essential element may not be readily available in the studied soil but if the condition is highly acidic, it could be released from the oxides (Ashraf et al., 2012). The obtained Fe results also revealed some anthropogenic sources of the metal at studied dumpsite soil (Surthland et al., 2000; Tack and Verloo, 1995). Fe exhibited very low mobility potential in studied dumpsite soil with mobility value of 10 and this could attributed to the influence of high organic matter (Chen and Wang, 2001; Ma et al., 2001). Trend for the distribution of Fe in the different fractions is as follows: Reducible > Residual > Oxidisable > Acid extractable.
Ni existed primarily in residual fraction in both studied dumpsite soil and Control with 42.59% and 39.95% respectively of total fractions obtained, this is consistent with report by Gungshik et al. (2007). Accordingly, Ni concentrations in studied dumpsite soil were mainly from natural source and inert/unavailable form for plant uptake (Forghani et al., 2009). Nickel displayed low mobility factor of 14 and high percentage recovery (96%). The low mobility potential could be accredited to the high organic matter content of studied dumpsite soil (Essen and El-Bassam, 1981). This finding confirms the report by Evans et al. (1995) that Ni has mobility potential in soil. Results in Table 5 also indicate that, distribution of Ni in the different fractions in studied soil and Control follow the order Residual > oxidisable > Reducible > Acid extractable. Generally, results obtained showed that all the trace metals studied except Cd exhibited higher mobility factor in Control site than studied dumpsite soil. This could be attributed to low organic matter and high acidity in Control site. The high percentage recovery recorded for metals assessed in this study confirms the reliability of analytical procedures and results obtained.
3.3 Pollution indices
The distinction between soil contamination and pollution by metals could be evaluated using metal pollution index (MPI). MPI signifies the ratio between metal content in studied soil and reference value acquired in the Control (Hong et al., 2014). The different classes of MPI as shown in Table 1 reveal that, Pb recorded a mean MPI value of 33.26. This is an indicative of excessive pollution of the studied dumpsite soil by Pb and negative impacts of the metal on the soil, plants and environment are envisaged. Results in Table 6 also indicate mean MPI values for Cd, Cu, Fe and Ni as 1.81, 12.76, 6.01 and 11.03 respectively. Cd slightly polluted the studied soil however; its high mobility in studied soil and as a known toxic element even at a very low concentration the low men MPI value should be closely monitored. Copper and nickel were in very severe pollution class thus, could have impending serious negative effects on studied soil, plants within the vicinity of the dumpsite and along the food chain. Nevertheless, the low mobility of Cu and Ni may hinder their bioavailability and subsequent toxicity in the area. Iron was in severe pollution class and could exert severe negative impacts on the studied soil, plants within the vicinity of studied dumpsite and along the food chain. Nevertheless; Fe is an essential element with very low mobility in studied soil hence, it may not be as dangerous as Cd. Results obtained for MPI revealed that, concentrations of all trace metals assessed had accumulated above contamination class into pollution status.
| Descriptive Statistics | Elements | ||||
|---|---|---|---|---|---|
| Pb | Cd | Cu | Fe | Ni | |
| MPI | |||||
| Min | 31.66 | 1.61 | 12.06 | 5.80 | 10.45 |
| Max | 34.71 | 2.05 | 13.32 | 6.10 | 11.65 |
| Mean | 33.26 | 1.81 | 12.76 | 6.01 | 11.03 |
| EF | |||||
| Min | 5.07 | 0.28 | 1.99 | 1.00 | 1.72 |
| Max | 5.54 | 0.33 | 2.19 | 1.00 | 2.16 |
| Mean | 5.39 | 0.30 | 2.13 | 1.00 | 1.89 |
| EF% Igeo |
52 | 45 | 55 | 71 | 37 |
| Min | 4.40 | 0.10 | 3.01 | 1.95 | 2.80 |
| Max | 4.53 | 0.44 | 3.15 | 2.03 | 3.14 |
| Mean | 4.47 | 0.26 | 3.09 | 2.01 | 2.93 |
| Er | |||||
| Min | 158.30 | 48.30 | 60.30 | – | 52.25 |
| Max | 173.55 | 61.50 | 66.60 | – | 58.25 |
| Mean | 166.23 | 54.30 | 63.79 | – | 55.16 |
Results for enrichment factor (EF) of trace metals assessed are shown in Table 6. As shown in the Table 6, the mean EF value for Pb is 5.39 with 52% of enrichment. Consequently, there was significant enrichment of Pb in the studied dumpsite soil and 52% of the soil studied has been enriched by the element (Kartal et al., 2006; Zonta et al., 1994). This according to Fagbote and Olanipekun, 2010 reveals substantial anthropogenic inputs of the metal at the studied dumpsite soil. This could be attributed to aerial deposition from vehicular emissions and Pb-containing wastes at the studied dumpsite (Kuang et al., 2004). The mean EF value for cadmium in Table 6 is 0.30 with 45% enrichment. This shows that majority of Cd accumulation at the studied dumpsite soil could be mainly from natural processes and 45% of the total soil studied was enriched by the element (Hernandez et al., 2003). EF results in Table 6 indicate that, Cu originated mostly from anthropogenic source as confirmed by mean EF value of 2.13 (Hernandez et al., 2003). Result in Table 6 also indicates that, Cu enriched 55% of the entire dumpsite soil evaluated consequently; Cu had moderate enrichment in the studied dumpsite soil (Kartal et al., 2006). Fe exhibited a mean EF value of 1.00 indicating the natural soil forming process as the major source of the metal (Hernandez et al., 2003). According to Kartal et al. (2006) classifications, Fe belongs to the deficiency to mineral enrichment class. Nevertheless; Fe enriched 71% of the studied dumpsite soil and may be due to the high Fe content in Nigerian soil enhanced by high clay (Tening and Omueti, 2011). Mean EF value of Ni as shown in Table 6 is 1.89 indicating natural source as the basis of the metal in studied dumpsite soil (Kartal et al., 2006; Yongming et al., 2006). Nevertheless, some wastes such as Ni-plated materials, fossil fuel and sewage sludge related materials may have also contributed some additional Ni into the soil beneath (Khodadoust et al., 2004). Nickel enriched 37% of the entire dumpsite soil investigated which was the lowest and it could be attributed to the inert nature of Ni in the area.
Results obtained for geo-accumulation index (Igeo) of trace metals in dumpsite soil studied are given in Table 6. As indicated in Table 6, Igeo values recorded for Pb vary between 4.40 and 4.53; which is an indication that the metal is in class of 5 (strongly to extremely polluted) (Huu et al., 2010). Consequently, the studied dumpsite soil has been severely polluted by Pb. Table 6 also indicates that, Igeo values for Cd range from 0.10 to 0.44 hence; the metal is in Igeo class of 1. Accordingly, concentrations of Cd in studied dumpsite soil varied from unpolluted to moderately polluted class. The range of Igeo values obtained for Cu is 3.01–3.15, so the metal is in class 4 (strongly polluted) thus; Cu strongly polluted the studied dumpsite soil. Igeo values for Fe and Ni vary as follows: 1. 95–2.03 and 2.80–3.14 respectively. These results show that Fe and Ni belong to class 3 hence; their concentrations in studied soil fluctuate between moderately to strongly polluted class.
According to Yang et al. (2009) potential ecological risk index (RI) signifies metal toxicity and environmental response to all the risks associated with trace metals assessed in studied environment. Elevated RI values of trace metals in an environment could result in severe health problems in human (Mugosa et al., 2016). Results in Fig. 2 indicate that, RI values range from 323.75 to 359.90 in the studied dumpsite soil. This is an indication that, the potential ecological risk index of the studied dumpsite soil is at the high ecological risk class (Yang et al., 2009). Consequently, there is high risk associated with the studied trace metals and exposure to this dumpsite soil either directly or indirectly may result in metal toxicity and their attendants’ health problems. Proper waste treatment and disposal methods should be adopted to avoid bioaccumulation of these metals and forestall a devastating consequence along food chain.

- Results of ecological risk index (RI), degree of contamination (Cdeg) and pollution load index (PLI).
Results for degree of contamination (Cdeg) utilized to determine the extent of contamination of the different locations of the studied dumpsite soil is shown in Fig. 2. Results obtained revealed the following mean Cdeg values: 63.39; 62.50; 67.83 and 65.71 for Northern, Eastern, Southern and Western parts of the dumpsite soil respectively. This indicates that, all the different parts of the dumpsite soil were at a very high degree of contamination (Hakanson, 1980). However, the southern part exhibited the highest level of soil contamination while the eastern part was the relatively the least contaminated part. The obtained Cdeg results followed the order: South > West > North > East. The high accumulation of metals in southern part may be attributed to the topography of the soil as metallic wastes leached at other parts are washed down to the southern part by rainwater.
Results of pollution load index of the different locations within the studied dumpsite soil are shown in Fig. 2. Results obtained showed that, all the locations were heavily polluted by metals assessed. PLI values obtained ranged from 7818 obtained in eastern part to 13,471 recorded in southern part of the studied dumpsite soil. These values according to Tomilson et al. (1980) classifications are within the extremely heavy pollution class (PLI > 3). The PLI results obtained corroborate that reported by degree of contamination of the different parts assessed.
Values obtained for ecological risk factor (Eir) for individual element studied are shown in Table 7. Eir values for Pb ranged from 158.30 to 173.55 thus, it belongs to high ecological risk class according to Yang et al. (2009). Cd exhibited an Eir range of 48.30–61.50 which is in the moderate ecological risk category. Cd has no useful role to play in both plant and animal systems thus even at a very low concentration the metal is toxic to living cells (Alloway, 1990). Hence, there is high risk of Cd toxicity to human exposed to the studied dumpsite soil either directly or indirectly. Eir values for Cu in Table 7 vary between 60.30 and 66.60 placing it also in the moderate ecological risk class. Nevertheless, as an essential element its toxicity may not be as risky as that of Cd. However, at very high concentrations copper is very toxic and dangerous to all living organisms. Fe is an essential element for all living cells hence; toxic response factor has not been assigned thereby resulting in no Eir values for the element. The Eir values for nickel were within the moderate risk class indicating the risky nature of the element. Results obtained have shown that, if human has direct or indirect contact with soil particles from the studied dumpsite soil it may result in severe metal toxicity and associated health implications. Consequently, this dumpsite soil should not be used for the cultivation of edible crops in its present status and even after reclamation to avoid serious health problems along the food chain.
| Location | Pb | Cd | Cu | Fe | Ni |
|---|---|---|---|---|---|
| North | 158.30 | 56.40 | 66.05 | – | 52.80 |
| East | 161.00 | 48.30 | 62.20 | – | 52.25 |
| South | 173.55 | 61.50 | 66.60 | – | 58.25 |
| West | 172.05 | 51.00 | 60.30 | – | 57.35 |
Pollution index (Ipoll) proposed by Karbassi et al. (2008) for evaluation of metal pollution in both aquatic and terrestrial environments was employed for the estimation of extent metal pollution in studied dumpsite soil. Results obtained for metal pollution intensity based on Ipoll are shown in Table 8. The obtained results revealed that, Pb, Cd and Cu exhibited moderate risk while Fe and Ni showed low level of risk. Accordingly, substantial amounts of Pb; Cd and Cu may have been released into the studied soil environment from waste products dumped. This may ultimately lead to high level of these metals along food chain and their attendants’ health problems.
| Category | Pollution intensity class | Element | Ipoll | Risk assessment |
|---|---|---|---|---|
| Extremely polluted | >5 | Pb | 2.44 | Moderately polluted |
| Strongly polluted | 4–5 | Cd | 2.64 | Moderately polluted |
| High polluted | 3–4 | Cu | 2.79 | Moderately polluted |
| Moderately polluted | 2–3 | Fe | 1.76 | Lowly polluted |
| Low polluted | 1–2 | Ni | 1.23 | Lowly polluted |
| Unpolluted | <0–1 |
3.4 Multivariate analysis
3.4.1 Pearson correlation analysis
Pearson’s correlation analysis was used to determine the interrelationship among parameters assessed and results obtained are shown in Table 9. Results obtained revealed positive and significant correlation between Pb and Ni (r = 0.810 at P < 0.01). Pb exhibited weak positive association with Cd, Fe, OM and pH with r values of 0.354; 0.467; 0.407 and 0.326 respectively at P < 0.02. The strong relationship between Pb and Ni corroborates that shown by Factor 2 in Principal component analysis (PCA). Pb showed weak negative correlation with Cu (r = −0.131 at P < 0.02). Cd displayed strong and positive correlation with Cu, OM and pH with r values of 0.862, 0.867 and 0.994 respectively at P < 0.01. Cd also exhibited significant positive association with Fe and no relationship with Ni with r values of 0.748 and −0.009 respectively at P < 0.02. Cu correlated positively and significantly with pH (r = 0.848) at P < 0.01. The relationship between the pairs Cu-Fe and Cu-OM was a weak positive one with r values of 0.421 and 0.601 respectively at P < 0.02. Nevertheless, a weak negative relationship was observed between Cu and Ni with r = −0.510 at P < 0.05. Fe showed significant positive relationship with OM and pH with r values of 0.977 and 0.806 respectively at P < 0.01. The relationship between Fe and Ni was a weak positive one with r value of 0.491 at P < 0.02. Ni showed weak positive relationship with OM and no relationship with pH with r values of 0.326 and 0.022 respectively at P < 0.02. OM exhibited significant positive correlation with pH (r = 0.912 at P < 0.01). Generally, this has confirmed common source of these metals and soil properties determined in the studied dumpsite soil and this may be primarily anthropogenic inputs from waste materials (Romic and Romic, 2002; Al-Khashman and Shawabkeh, 2006; Yang et al., 2011).
| Pb | Cd | Cu | Fe | Ni | OM | pH | |
|---|---|---|---|---|---|---|---|
| Pb | 1.000 | ||||||
| Cd | 0.354 | 1.000 | |||||
| Cu | −0.131 | 0.862 | 1.000 | ||||
| Fe | 0.467 | 0.748 | 0.421 | 1.000 | |||
| Ni | 0.810 | −0.009 | −0.510 | 0.491 | 1.000 | ||
| OM | 0.407 | 0.867 | 0.601 | 0.977 | 0.326 | 1.000 | |
| pH | 0.326 | 0.994 | 0.848 | 0.806 | 0.022 | 0.912 | 1.000 |
3.4.2 Principal component analysis
This study utilized principal component analysis (PCA) for identification of sources of contamination and relationship among parameters determined in studied dumpsite soil (Facchinelli et al., 2001; Wu and Kuo (2012). Principal component analysis revealed two major factors with Eigen values greater than one with 93.808% of total variance (Table 10). Factor one (F1) contributed 62.942% of the total variance with strong positive loadings on pH, organic matter, Cd, Fe and Cu, but weak positive loading on Ni and Pb (Table 11). This represents the anthropogenic impact of waste materials on the underlying soil (Mugoša et al., 2016; Olabanji et al., 2015). The second factor (F2) contributed 30.867% of the total variance with strong loading on Ni and Pb; strong negative loading on Cu (Table 11). This second factor indicates significant impacts of industrial and agricultural wastes on the studied dumpsite soil (Wu et al., 2008).
| Component | Initial Eigenvalues | Extraction Sums of Squared Loadings | Rotation Sums of Squared Loadings | ||||||
|---|---|---|---|---|---|---|---|---|---|
| Total | % of Variance | Cumulative% | Total | % of Variance | Cumulative % | Total | % of Variance | Cumulative % | |
| 1 | 4.406 | 62.942 | 62.942 | 4.406 | 62.942 | 62.942 | 4.225 | 60.363 | 60.363 |
| 2 | 2.161 | 30.867 | 93.808 | 2.161 | 30.867 | 93.808 | 2.341 | 33.446 | 93.808 |
| 3 | 0.433 | 6.192 | 100.000 | ||||||
| 4 | 3.462E−016 | 4.946E−015 | 100.000 | ||||||
| 5 | 6.786E−017 | 9.694E−016 | 100.000 | ||||||
| 6 | −1.130E−016 | −1.615E−015 | 100.000 | ||||||
| 7 | −1.918E−016 | −2.740E−015 | 100.000 | ||||||
Extraction Method: Principal Component Analysis.
| Factor 1 (F1) | Factor 2 (F2) | |
|---|---|---|
| Pb | 0.460 | 0.767 |
| Cd | 0.959 | −0.219 |
| Cu | 0.717 | −0.683 |
| Fe | 0.904 | 0.263 |
| Ni | 0.229 | 0.970 |
| OM | 0.968 | 0.087 |
| pH | 0.977 | −0.202 |
3.4.3 Cluster analysis
The pair-wise relationships between trace metals and physicochemical properties of studied soil are shown in a cluster analysis represented in Fig. 3. Results obtained from the cluster analysis revealed two major clusters namely: one associated with Organic matter (OM), pH, Cd, Cu, Ni and Pb and another one with Fe. Consequently, the waste materials at studied dumpsite soil could have influenced the levels of OM, pH, Cd, Cu, Ni and Pb while iron may have originated mainly from natural source.
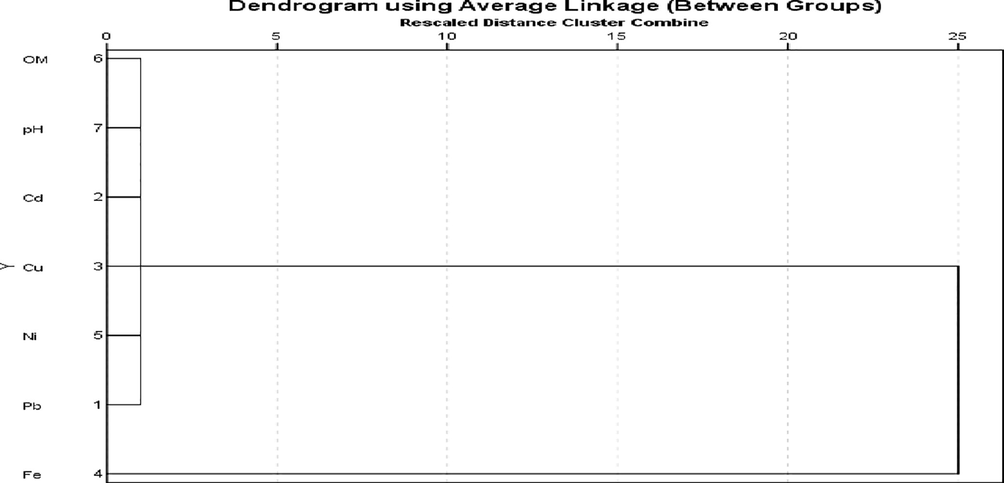
- Hierarchical clusters formed among parameters in studied dumpsite soil.
A plot of component 1 against component 2 also resulted in two clusters. Results obtained from are usually interpreted based on values of rotation matrix and not on the way components appear in the plot. Based on rotation matrix, Cluster 1 showed significant loading for pH, Cd, organic matter, Cu, Fe, and moderate positive loading on Pb which is similar to Factor 1. This shows a common source and similarities for members of cluster 1 (Romic and Romic, 2002; Wai et al., 2010). Cluster 2 indicated positive and significant loading for Ni and Pb, thereby signifying impacts from industrial and agricultural wastes on the studied dumpsite soil (Wu et al., 2008).
3.5 Health risk assessment
3.5.1 Daily intake rate (DI)
Results recorded for daily intake (DI) of trace metals by both adults and children via oral ingestion of contaminated soil studied are shown in Table 12. Daily intake of metals determines the intensity of their toxicity to human beings. However, results obtained revealed that the daily intake rate for all the metals studied except Pb were below their recommended oral reference dose (RfDs) by USEPA (2010). Consequently, if soil particles from the studied dumpsite soil are ingested orally, both children and adults may have elevated quantity of Pb. This may result in severe health problems such as slow growth, headaches, damage to the brain and nervous system, anemia, liver and kidney damage, reduction in learning ability, and abnormal behaviours in both children and adults (USEPA, 2004). This study has also shown that, children will be more vulnerable to Pb toxicity in the area studied because their daily intake rate is much higher than that of adults. The high intake rate of Pb recorded in this study is in conformity with that reported by Song et al. (2015) in Suxian County, South China. Generally, the daily intake rate for both children and adults followed the sequence Fe > Pb > Ni > Cu > Cd. Accordingly, the daily intake rate of Fe was the highest while that of cadmium was the lowest. The high DI for Fe may not pose serious threat since the metal is essential for life but should be monitored to avoid accumulation along food chain (Goyer, 1995; WHO, 1996). However, the low daily intake rate of Cd should not be neglected since the metal is highly toxic and mobile (Tchounwou et al., 2012).
| Metal | Summary | DI | HQ | ||
|---|---|---|---|---|---|
| Child | Adult | Child | Adult | ||
| Fe | Min | 9.00E−2 | 8.00E−3 | 0.13 | 0.01 |
| Max | 2.00E−1 | 1.10E−1 | 0.30 | 0.16 | |
| Mean | 1.30E−1 | 6.00E−2 | 0.19 | 0.09 | |
| Pb | Min | 1.00E−3 | 6.00E−4 | 0.30 | 0.17 |
| Max | 4.00E−2 | 2.00E−3 | 4.30 | 0.57 | |
| Mean | 7.00E−3 | 1.00E−3 | 1.08 | 0.36 | |
| Cd | Min | 1.00E−4 | 3.00E−5 | 0.10 | 0.03 |
| Max | 1.00E−3 | 8.00E−5 | 1.00 | 0.08 | |
| Mean | 7.00E−4 | 5.67E−5 | 0.68 | 0.06 | |
| Cu | Min | 1.00E−3 | 9.00E−4 | 0.03 | 0.03 |
| Max | 6.00E−3 | 3.00E−3 | 0.15 | 0.08 | |
| Mean | 3.00E−3 | 1.70E−3 | 0.08 | 0.05 | |
| Ni | Min | 1.00E−4 | 7.00E−4 | 0.01 | 0.03 |
| Max | 2.00E−3 | 7.00E−3 | 0.10 | 0.10 | |
| Mean | 1.00E−3 | 1.40E−3 | 0.05 | 0.04 | |
| THI (Children) | 1.22–5.14 | ||||
| THI (Adults) | 0.35–0.92 | ||||
3.5.2 Non-carcinogenic risk expressed as hazard quotient (HQ)
Results in Table 12 reveal that, Pb has potential higher non-carcinogenic risks to human than other trace metals studied. Table 12 shows that individual metal HQ values for other metals studied are less than 1.00. Thus; these metals may not pose any serious health risk in both children and adults. The HQ values for Pb varied between 4.00 and 4.57 in children and 2.29 and 2.67 in adults. Consequently, the high risk of oral exposure in children and adults in studied dumpsite soil has been exposed. The potential risk of Pb is higher in children than in adults as confirmed by the higher HQ values of Pb in children than in adults. Nevertheless, as the THI is less than 1.00, there is probability of these people being exposed to non-carcinogenic health problems which varies directly with THI value (Man et al., 2010).
3.5.3 Total chronic hazard index (THI)
Values obtained for total chronic hazard quotient index (THI) of oral exposure to soil contaminated by trace metals by human beings are shown in Table 12. Table 12 shows that, THI values for children range from 4.56 to 5.16 while that of adults vary between 2.60 and 2.99. Figs. 4 and 5 indicate that, the hazard quotient of Pb in both children and adults contribute 88% of the total hazard index recorded. The THI values for children and adults are more than 1.00 thus; both the young ones and adults being living within the studied dumpsite soil are at risk of Pb toxicity and associated health implications (USEPA, 2010). The vulnerability is higher in children than in adults as the THI values of children are much higher than that of the adults; this is consistent with the report by Singh et al. (2010). The other trace metals (Cd, Cu, Fe and Ni) contributed 12% to the overall hazard index recorded for both children and adults. The THI values for these metals were also lower than 1.00 hence, these people may not likely experience unpleasant health problems associated with their toxicities. However, the availability of these metals should be checked to forestall bioaccumulation and related health/environmental problems. Man et al. (2010) reported that as the THI is less than 1.00, there is likelihood of human being exposed to non-carcinogenic health problems which has direct relationship with THI value. THI values in both children and adults followed the order: Pb > Fe > Ni > Cd > Cu.
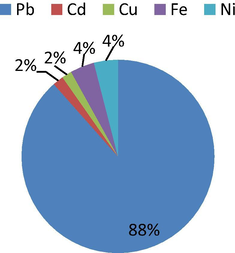
- Average hazard quotients for children.
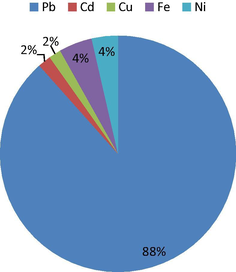
- Average hazard quotients for adult.
3.6 Validation of analytical procedures and Results obtained
Standard reference material SRM 2710a (Montana 1 soil) from National Institute of Standards and Technology, USA was used for the validation of analytical technique and results obtained. The standard reference soil was digested following the procedures used for samples obtained and concentrations of Pb, Cd, Cu, Fe and Ni were determined using Agilent 710 inductively coupled optical emission spectrometer. Results obtained are shown in Table 13 and are consistent with those in Certified Results. The obtained results also demonstrate high percentage recovery for the metals thereby validating the analytical procedures and results obtained.
| Element | Certified value ± SD | Measured mean value value ± SD | Recovery (%) |
|---|---|---|---|
| Pb (%) | 0.552 ± 0.003 | 0.507 ± 0.05 | 92 |
| Cd (mgkg−1) | 12.30 ± 0.30 | 11.26 ± 0.38 | 92 |
| Cu (mgkg−1) | 3420.00 ± 50.00 | 3162.00 ± 35.12 | 93 |
| Fe (%) | 4.32 ± 0.08 | 4.13 ± 0.53 | 96 |
| Ni (mgkg−1) | 8.00 ± 1.00 | 7.02 ± 0.48 | 88 |
Sources: Gaithersburg et al. (2003).
4 Conclusion
This research has exposed the metal load of Lemna dumpsite soil in Calabar Municipality, the interaction among these metals and soil properties. The health implications of these metals in the studied dumpsite soil have been identified. The public has now been exposed to the risk involved in the cultivation of studied dumpsite soil in its present state or after the soil might have been reclaimed. This study has shown that children living within the vicinity of this open dumpsite soil are more vulnerable to Pb toxicity, hence should be avoided. Factors responsible for the contamination of the studied dumpsite soil have been revealed and actual impact of waste materials at the dumpsite on metal load in soil has also been determined.
References
- Assessment of metal availability in contaminated soil by sequential extraction. Water Air Soil Pollut.. 2006;137:315-338.
- [Google Scholar]
- Chemical speciation and potential mobility of some toxic metals in tropical agricultural soil. Res. J. Environ. Toxicol.. 2016;10:159-165.
- [Google Scholar]
- Comparison between sequential extraction procedures and single extractions for metal partitioning in sewage sludge samples. Analysts. 2000;125:1353-1357.
- [Google Scholar]
- Metals distribution in soils around the cement factory in southern Jordan. Environ. Pollut.. 2006;140:387-394.
- [Google Scholar]
- Heavy Metal in Soils (second ed.). Glasgow: Blackie Publishers; 1990. p. :50.
- Chemical speciation and potentialmobility of heavymetals in the soil of former tinmining catchment. Sci. World J.. 2012;2012:1-11.
- [Google Scholar]
- Effect of leaching on heavy metals concentration of soil in some dumpsites. Afr. J. Environ. Sci. Technol.. 2010;4(8):495-499.
- [Google Scholar]
- Distribution and forms of heavy metals in some agricultural soils. Polish J. Environ. Stud.. 2003;12(5):629-633.
- [Google Scholar]
- Urban geochemistry: investigations in the Berlin metropolitan area. Environ. Geochem. Health. 2000;22:233-248.
- [Google Scholar]
- Potential ecological risk of cadmium lead and arsenic in agricultural black soil in Jilin province China. Stoch Environ Res Risk Assess.. 2007;23:57-64.
- [Google Scholar]
- Bioavailability of natural colloidal-bound iron to marine phytoplankton: Influences of colloidal size and aging. Limnol. Oceanogr.. 2001;46:1956-1967.
- [Google Scholar]
- Metal Speciation and Pollution status of Trace Metals in Roadside Dusts in high traffic density areas of Akwa Ibom State, Nigeria. Iranica J. Energy Environ.. 2016;7(4):340-349.
- [Google Scholar]
- Seasonal variations in trace metal levels, speciation and physicochemical determinants of metal availability in dumpsite soils within Akwa Ibom State, Nigeria. Chem. Ecol.. 2014;2014:1-15.
- [Google Scholar]
- Pollution indices of trace metals in some Urban dumpsite soils within Akwa Ibom State, Nigeria. Int. Res. J. Pure Appl. Chem.. 2015;6(2):84-94.
- [Google Scholar]
- Concentration of heavy metals in soils at the municipal dumpsite in Calabar Metropolis. Asian J. Environ. Ecol.. 2017;3(2):1-11.
- [Google Scholar]
- Distribution of Heavy Metals in Urban Soils; A Case Study of Calabar Area, South-Eastern Nigeria. Geosciences. 2014;4(1):23-28.
- [Google Scholar]
- On the mobility of cadmium under aerobic soil conditions. Environ. Pollut. Ser. A. 1981:15-31.
- [Google Scholar]
- Chemical aspects of heavy metal solubility with reference to sewage sludge-amended soils. Int. J. Environ. Anal. Chem.. 1995;59(2–4):291-302.
- [Google Scholar]
- Multivariate statistical and GIS-based approach to identify heavy metal sources in soils. Environ. Pollut.. 2001;114:313-324.
- [Google Scholar]
- Speciation of heavy metals in sediment of Agbabu Bitumen deposit area, Nigeria. J. Appl. Sci. Environ. Manage.. 2010;14(4):47-51.
- [Google Scholar]
- Assessment of the environmental significance of heavy metal pollution in surfucical sediments of the River Po. Chemosphere. 2007;68:761-768.
- [Google Scholar]
- FEPA, 1997. Guidelines and standard for environmental impact assessment in Nigeria. pp. 87–95.
- Federal Environmental Protection Agency (FEPA) (1999). National Guidelines and Standards for Soil Quality in Nigeria. FEPA, Rivers State Ministry of Environment and Natural Resources, Port Harcourt.
- Geochemistry and speciation of metals in sediments of the Maharlu Saline Lake, Shiraz, SW Iran. Environ. Earth Sci.. 2009;59:173-184.
- [Google Scholar]
- Standard Material Reference (SRM) 2710a (Montana soil 1), Highly Elevated Trace Element Concentrations. London: National Institute of Standards and Technology Certificate of Analysis; 2003. p. :1-6.
- Geochemical Assessment of heavy metals pollution of Urban Soils. Polish J. Environ. Stud.. 2002;11(5):493-499.
- [Google Scholar]
- Potential health risk assessment for soil heavy metal contamination in the central zone of Belgrade (Serbia) J. Serb. Chem. Soc.. 2008;73(8–9):923-934.
- [Google Scholar]
- Speciation of trace metals in topoils in Jos industrial areas. Afr. J. Nat. Sci.. 2007;10:15-19.
- [Google Scholar]
- Ecological risk index for aquatic pollution control, a sedimentological approach. Water Res.. 1980;14(8):975-1001.
- [Google Scholar]
- Speciation and mobility of heavy metals in mud, in coastal reclamation areas in Chenzhen, China. Environ. Geol.. 2007;53(1)
- [Google Scholar]
- Heavy metal distribution in some French forest soils: Evidence for atmosphere contamination. Sci. Total Environ.. 2003;312(1–3):195-210.
- [Google Scholar]
- Environmental burden of heavy metal contamination levels in soil from sewage irrigation area of Geriyo Catchment, Nigeria. Civil Environ. Res.. 2014;6(10):118-124.
- [Google Scholar]
- Distribution and contamination status of heavy metals in estuarine sediments near Cau Ong harbor, Ha Long Bay, Vietnam. Geologica Belgica. 2010;13(1–2):37-47.
- [Google Scholar]
- Trace Elements in Soils and Plants. Boca Raton, Florida, USA: CRC Press LLC; 2001.
- Total and extractable forms of Cu, Zn, Ni, Cr, Pb and Fe in vineyard soil (Valandovo valley, Macedonia) determined by a sequential extraction procedure. Maced. J. Chem. Chem. Eng.. 2012;31(2):271-283.
- [Google Scholar]
- Metal pollution assessment of sediment and water in the Shur River. Environ. Monit. Assess.. 2008;147:107-116.
- [Google Scholar]
- Fractionation of metals in street sediment samples using the BCR sequential extraction procedure and multivariate statistical elucidation of the data. J. Hazard. Mater.. 2006;132:80-89.
- [Google Scholar]
- Removal of nickel and phenanthrene from kaolin soil using different extractants. Environ. Eng. Sci.. 2004;21(6):691-704.
- [Google Scholar]
- Speciation and solubility of heavy metals in contaminated soil using X-ray micro fluorescence, EXAFS spectroscopy, chemical extraction and thermodynamic modeling. Geochimica et Cosmochimica Acta. 2006;70:2163-2190.
- [Google Scholar]
- Land use-related chemical composition of street sediments in Beijing. Environ. Sci. Pollut. Res.. 2004;11:73-83.
- [Google Scholar]
- Soil-plant-man relationships in heavy metal polluted areas in Romania. Appl. Geochem.. 1996;11:105-107.
- [Google Scholar]
- Lacatusu, R., 2000. Appraising levels of soil contamination and pollution with heavy metals in: Heinike H.J., Eckselman W., Thomasson, A.J., Jones, R.J.A, Montanarella L and Buckeley B (eds.). Land information systems for planning the sustainable use of land resources. European Soil Bureau Research Report No. 4. Office of Official Publication of the European Communities, Luxembourg, pp. 393 – 402.
- Study of vertical migration of heavy metals in dumpsites soil. ARPN J. Sci. Technol.. 2012;2(2):50-55.
- [Google Scholar]
- Spatial distribution characteristics of heavy metals in street dust in Shenyang city. Ecol. Environ.. 2008;17:560-564.
- [Google Scholar]
- Contamination assessment of copper, lead, zinc, manganese and nickel in street dust of Baoji, NW China. J. Hazardous Mater.. 2009;161:1058-1062.
- [Google Scholar]
- Alumnium tolerance in plants and the complexing role of organic acids. Trends Plant Sci.. 2001;6(6):273-298.
- [Google Scholar]
- Health risk assessment of abandoned agricultural soils based on heavy metal contents in Hong Kong, the world's most populated city. Environ. Int.. 2010;36(6):570-576.
- [Google Scholar]
- Assessment of ecological risk of heavy metal contamination in coastal municipalities of Montenegro. Int. J. Environ. Res. Public Health. 2016;13(4):393-405.
- [Google Scholar]
- Assessment of lead, cadmium, and zinc contamination of roadside soils, surface films, and vegetables in Kampala City, Uganda. Environ Res. 2006;101:42-52.
- [Google Scholar]
- Processes of bioaccumulation: The importance of chemical speciation. Mar. Pollut. Bull.. 1985;16:164-169.
- [Google Scholar]
- Biotechnological strategies applied to the decontamination of soils polluted with heavy metals. Biotechnol. Adv.. 2010;28:61-69.
- [Google Scholar]
- An inventory of heavy metals inputs to agricultural soils in England and Wales. Sci. Total Environ.. 2003;311:205-219.
- [Google Scholar]
- Nondestructive analysis of dumpsite soil and vegetable for elemental composition. J. Environ. Chem. Ecotoxicol.. 2015;7(1):1-10.
- [Google Scholar]
- Levels and speciation of heavy metals in soils of industrial Southern Nigeria. Environ. Monit. Assess.. 2003;85(2):135-155.
- [Google Scholar]
- Determination of concentrations of heavy metals in municipal dumpsite soil and plants at Oke-ogi, Iree, Nigeria. Int. Res. J. Pure Appl. Chem.. 2014;4(6):656-669.
- [Google Scholar]
- 2000 (second ed.). CRC Press, London, UK: Soils and Environmental Quality; 2000.
- Metal hyperaccumulation in plants Biodiversity prospecting for phytoremediation technology. Electron. J. Biotechnol.. 2003;6:275-321.
- [Google Scholar]
- Total concentrations and speciation of heavy metals in soils of the Shenyang Zhangshi Irrigation Area, China. Environ. Monitor. Assess.. 2009;156(1–4):171-180.
- [Google Scholar]
- Application of a modified BCR sequential extraction (three-step) procedure for the determination of extractable trace metal contents in a sewage sludge amended soil reference material (CRM 483), complemented by a three-year study of acetic acid and EDTA extractable metal content. J. Environ. Monit.. 2000;2:228-233.
- [Google Scholar]
- Heavy metal distribution in agricultural top soils in urban areas. Environ. Geol.. 2002;43:795-805.
- [Google Scholar]
- Geochemistry of major and trace elements in sediments of the Ria de Vigo (NW Spain) an assessment of metal pollution. Mar. Pollut. Bull.. 2000;40(11):968-980.
- [Google Scholar]
- Partitioning of heavy metals into selective chemical fractions from rivers in northern Greece. Sci. Total Environ.. 1987;67:279-285.
- [Google Scholar]
- Fertility capability classification: A tool to help assess soil quality in the tropics. Geoderma. 2003;114:157-185.
- [Google Scholar]
- Health risk assessment of heavy metals via dietary intake of foodstuffs from the wastewater irrigated site of a dry tropical area of India. Food Chem. Toxicol.. 2010;48:611-619.
- [Google Scholar]
- Integrated Health Risk Assessment of Heavy Metals in Suxian County, South China. Int. J. Environ. Res. Public Health. 2015;12:7100-7117.
- [Google Scholar]
- Bed sediment-associated trace metals in an urban stream, Oahu. Hawaii. Environmental Geology. 2000;39:611-627.
- [Google Scholar]
- Characterization of selected element concentration and enrichment ratios in background and anthropogenically impacted roadside areas. Arch. Environ. Contam. Toxicol.. 2000;38:428-438.
- [Google Scholar]
- Chemical speciation and fractionation in soil and sediment heavy metal analysis: a review. Int. J. Environ. Anal. Chem.. 1995;59:225-238.
- [Google Scholar]
- Heavy metals toxicity and the environment. NIH Public Access, EXS.. 2012;101:133-164.
- [Google Scholar]
- Suitability of extractants for predicting iron in soils of the humid zone of South-Western Nigeria. Agric. Biol. J. N. Am.. 2011;2(8):1244-1250.
- [Google Scholar]
- Problems in assessment of heavy metals in esturaies and formation of pollution index. Helgol Meeresanlter. 1980;33:566-575.
- [Google Scholar]
- Sequential extraction procedure for partitioning of lead, copper, cadmium, chromium and zinc in contaminated arable soils of Nigeria. Am. J. Environ., Energy Power Res.. 2013;1(9):186-208.
- [Google Scholar]
- Risk assessment guidance for superfund. Human health evaluation manual. EPA/540/1-89/002, vol. I. Office of solid waste and emergency response. US Environmental Protection Agency; 1989.
- Risk-Based Concentration Table. Philadelphia PA. United States. Washington DC, USA: Environmental Protection Agency; 2000.
- USEPA, 2004. U.S. Environmental Protection Agency, The OAQPS Air Toxic Risk Assessment Library. Available at EPA’s fate, exposure, and risk analysis (FERA) website: http://www.epa.gov/ttn/fera/risk_atra_main.html.
- USEPA, 2010. Integrated Risk Information System. (IRIS). United States Environmental Protection. Available online: http://www.epa.gov/iris/index.html (accessed on 4 October 2011).
- Van-Reeuwijk, L.P., 1993. Procedures for soil analysis. Wageningen: Technical Paper 9, ISRIC; pp. 16–18.
- Veerkamp, W., Ten-Berge, W., 1999. Human Exposure to Soil Pollutants (HESP). Shell Internationale Petroleum, Maatschappijb.v. The Hague. Shell.
- Comparing biosorbent ability of modified citrus and durian rind pectin. Carbohydrate Polymer. 2010;79(3):584-589.
- [Google Scholar]
- Comparing the health risk of toxic metals through vegetable consumption between industrial and non-polluted fields in Shaoguan, South China. Int. J. Food Agric. Environ.. 2012;10(2):943-948.
- [Google Scholar]
- WHO/FAO/IAEA. World Health Organization. Switzerland: Geneva. (1996). Trace Elements in Human Nutrition and Health.
- Applying a multivariate statistical analysis model to evaluate the water quality of a watershed. Water Environ. Res.. 2012;84(12):2075-2085.
- [Google Scholar]
- Atmospheric deposition of metals in TSP of Guiyang, PR China. Bull Environ Contam Toxicol.. 2008;80(5):465-468.
- [Google Scholar]
- Seasonal variations of heavy metals concentration in abattoir dumping site soil in Nigeria. J. Appl. Sci. Environ. Manage.. 2009;13(4):9-13.
- [Google Scholar]
- Distribution and speciation of heavy metals in sediments from the mainstream, tributaries, and lakes of the Yangtze River catchment of Wuhan, China. J. Hazardous Mater.. 2009;166(2–3):1186-1194.
- [Google Scholar]
- Assessment of heavy metals contamination in urban topsoil from Changchun City, China. J. Geochemical Explor.. 2011;108:27-38.
- [Google Scholar]
- Multivariate analysis of heavy metal contamination in urban dusts in Xian, central China. Sci. Total Environ.. 2006;355:176-186.
- [Google Scholar]
- Heavy metal and grain-size distribution in estuarine shallow water sediments of the Cona Marsh (Venice Lagoon, Italy) Sci of Total Environ.. 1994;151:19-28.
- [Google Scholar]


