Translate this page into:
Solvent fractionation of rambutan (Nephelium lappaceum L.) kernel fat for production of non-hydrogenated solid fat: Influence of time and solvent type
⁎Corresponding author. Fax: +66 2562 5021. utai.k@ku.ac.th (Utai Klinkesorn) utai27@yahoo.com (Utai Klinkesorn)
-
Received: ,
Accepted: ,
This article was originally published by Elsevier and was migrated to Scientific Scholar after the change of Publisher.
Peer review under responsibility of King Saud University.
Abstract
The present study performed isothermal (25 °C) solvent fractionation of rambutan (Nephelium lappaceum L.) kernel fat (RKF) to obtain the fat fraction that had melting properties comparable to a commercial hydrogenated solid fat. The effect of two fractionation parameters, holding time (12, 18 and 24 h) and solvent types (acetone and ethanol), on the properties of fractionated fat were investigated. The results showed that a fractionation time increase caused an increased yield and decreased iodine value for the high melting or stearin fractions. The thermal behaviors and solid fat index (SFI) of these stearin fractions were different from the original fat, especially for stearin from acetone fractionation. The major fatty acid in this stearin fraction was arachidic acid (C20:0) consisting of more than 90%. Overall, we demonstrated that acetone fractionation of RKF at 25 °C for 24 h is effective for producing a solid fat fraction, which has comparable crystallizing and melting properties to commercial hydrogenated fat. The fractionated rambutan fat obtained by this process may lead to its potential use in specific food products.
Keywords
Rambutan kernel fat
Solvent fractionation
Solid fat
Physical characteristics
Chemical characteristics
1 Introduction
Semi-solid or plastic fat is the main structural constituent of many food products, especially bakery and confectionary products. Most of these fats are hydrogenated fats which involve the addition of hydrogen to the double bonds of unsaturated fatty acids (USFAs) for converting liquid oil into plastic or hard fats via the hydrogenation process (Ariaansz, 1993; Kummerow, 2009). In addition, hydrogenated fats can be also used as a hard stock mixed with cocoa butter in chocolate products to slow down the fat bloom (Lonchampt and Hartel, 2004). Although, this process could produce the desired properties of semi-solid or plastic fats, trans-fatty acid is also generated (Han et al., 2002; Lichtenstein et al., 1999). Trans-fatty acids, which are formed during hydrogenation, doubly affect blood cholesterol, by increasing low-density lipoprotein and decreasing high-density lipoprotein. These effects of trans-fatty acids increase the risk of developing coronary heart disease (Han et al., 2002; Harris, 2011; Jala et al., 2012; Kummerow, 2009; Semma, 2002). As a result, the industry needs other sources of trans-free plastic or hard fat instead of hydrogenated fat.
Rambutan (Nephelium lappaceum L.) is the one of the seasonal fruits grown in Southeast Asian countries, especially in Malaysia, the Philippine and also in Thailand, which has become the leading producer and exporter of canned rambutan in syrup. In the canning industry, the rambutan seeds are removed from the fruits during processing and the seeds (around 4–9% of fruit weight) are a waste by-product. The increasing feedstock of rambutan for industry means that rambutan seed waste is also increasing (Solís-Fuentes et al., 2010). For Thailand, the Office of Agricultural Economics reported that the total production of rambutan fruit from 2014 to 2015 was approximately 318,000 t per year. Therefore, the yearly average discards of rambutan seeds are estimated to be 1900 t.
Rambutan seed kernels contain approximately 1.22–2.90% ash, 7.8–14.1% protein, 2.8–11.6% fiber, 28.7–48.1% carbohydrates and 33.4–38.9% fats. Extracted rambutan kernel fat (RKF) is a white, solid fat at room temperature and its physical and chemical properties are not different from other commercial edible fats (Harahap et al., 2012; Manaf et al., 2013; Sirisompong et al., 2011; Solís-Fuentes et al., 2010; Sonwai and Ponprachanuvut, 2012). The previous studies reported that rambutan seed kernel and its extract were edible and were not toxic (Eiamwat et al., 2014; Thailand Institute of Scientific and Technological Research, 2012). Therefore, RKF can be a promising alternative edible fat that has the potential to be used in the food industry, especially to replace hydrogenated fat. However, original RKF has wide crystallization and melting ranges and varies in triglyceride patterns which are unsuitable for use in specific food products (Sirisompong et al., 2011). Thus, a modification process should be applied to improve the crystallization and melting properties of RKF.
Fractional crystallization is a simple technology used for the recovery of a fat fraction with a narrower composition range and sharper melting properties. The process involves three basic steps: first, preheating the fat stock to give a homogenous mass with nil solids; second, crystallization under preset controlled conditions to form stable and uniform-sized filterable crystals; and third, filtering the fat mixture to separate the solid and liquid fractions (Gibon, 2006; Harris, 2011). Solvent fractionation is classified as fractional crystallization which is based not only on the principle of different melting points but also on the different solubilities of the oil or fat fractions in a solvent at a certain temperature. The advantages of solvent fractionation over other methods are the highest separation efficiency, a high yield of targeted fractions and sharp melting fractions (Gibon, 2006; Harris, 2011). The solvent used in this process should be a medium polarity to clearly divide between high polar triglycerides and low polar triglycerides from each other (Harris, 2011). Several factors affecting the efficiency of solvent fractionation have been reported including the cooling rate, end-crystallization temperature, ratio of solvent to fractionated oil, holding time and solvent type (Jala et al., 2012; Kang et al., 2013; Salas et al., 2009; Talbot et al., 2006). Selecting a suitable solvent depends on the polarity, energy required for solvent recovery, explosion risk and toxicology (Bruckner and Warren, 2001; Harris, 2011; Illingworth, 2002).
There is no previous research on solvent fractionation of RKF. Therefore, this present study aimed to perform the isothermal solvent fractionation of RKF to obtain fractionated fats that had the proper physical and chemical properties for use in food products. The effect of two fractionation parameters, holding time (12, 18 and 24 h) and solvent types (acetone and ethanol), on the yield, iodine value, thermal behavior, fatty acid compositions and crystal microstructure were investigated. In addition, the characteristics of fractionated RKF were compared with commercial hydrogenated fats. Besides acetone, in the present study, we used ethanol to fractionate the fat. Although, ethanol is not widely used for fat fractionation because of its high polarity, the advantage of ethanol is non-toxic and can be safely used in food processes. Moreover, ethanol has a lower flammability, lower harmful to health and lower cost than hexane (Ferreira-Dias et al., 2003).
2 Materials and methods
2.1 Materials
Rambutan seeds (N. lappaceum L.) were provided by Malee Sampran Public Company Limited (Nakornpathom, Thailand). Commercial hexane was purchased from Hope International Co Ltd. (Thailand). Acetone was a product of QRëC Quality Reagent Chemical Ltd. (New Zealand). Ethanol was ordered from Labscan Asia Co Ltd. (Thailand). Fatty acid methyl ester standard was a product of Sigma–Aldrich Chemie GmbH (Germany). Fully hydrogenated canola oil (HCO) and hydrogenated palm oil (HPO) were obtained from Palsgaard (Denmark) and a local company in Thailand, respectively. All other reagents were of analytical or high-performance liquid chromatography (HPLC) grade.
2.2 Rambutan kernel fat extraction
The rambutan seeds were cleaned and then the shells were removed to obtain the kernels. The kernels were finely ground using a blender (Matsushita Electric Co Ltd., Taiwan) and then they were dried at 65 °C using a tray dryer (Kan Seng Lee Machinery Ltd. Part, Thailand) for approximately 5 h to reach a moisture content of around 5 wt%. The ground-dried kernels underwent fat extraction using hexane in a Soxhlet apparatus with a kernel to solvent ratio of 1:5 (Sirisompong et al., 2011). The hexane in miscella was evaporated using a rotary evaporator at 60 °C under vacuum and residues of the solvent were removed using nitrogen flushing. The fat was then stored in amber bottles at −18 °C.
2.3 Fractionation of rambutan kernel fat
The fractionation was performed in a 250 mL Erlenmeyer flask. RKF was melted at 80 °C to remove any fat crystal and then mixed with warm acetone (50 °C) at a ratio of fat to solvent of 1:5 (w/v). Then, the temperature was lowered to 25 °C at an overall average rate of ∼0.4 °C/min and the mixture was separately left to crystallize in an incubator for 12, 18 and 24 h. The fat crystals (stearin fraction) were then separated at the crystallization temperature (25 °C) using vacuum filtration. The liquid fraction (olein fraction) was dried in a parallel vacuum evaporator to evaporate the solvent. The remaining solvent in the stearin and olein fractions was also removed using nitrogen flushing. The weight of each fraction was carefully measured to calculate the yield. The influence of the solvent type on the characteristics of the fractionated RKF was also studied using acetone and ethanol at 25 °C for 24 h with the same fractionated procedure as described above. The fat fractions were then stored at −18 °C before analysis of the iodine value, fatty acid compositions, thermal behavior, solid fat index and fat crystal microstructure.
2.4 Determination of iodine value
The iodine value (g I2 per g sample) of the original RKF and all fat fractions was determined according to the AOCS official method Cd 1d-92 (AOCS, 1997).
2.5 Thermal behavior and solid fat index (SFI)
The crystallizing and melting behaviors of the fat fractions were determined using differential scanning calorimetry (DSC; Pyris1, Perkin Elmer Co., USA) with the method modified from Sirisompong et al. (2011), Solís-Fuentes et al. (2010) and Sonwai and Ponprachanuvut (2012). Nitrogen gas (99.999% purity) was purged at a rate of 20 mL/min. Approximately 4–5 mg of the fat fraction were weighed on a precision balance and hermetically sealed in a DSC stainless pan with an empty DSC stainless pan used as the reference. The sample was heated from 25 °C to 80 °C at a rate of 30 °C/min and held at 80 °C for 10 min to destroy any previous structure. The crystallizing behaviors were recorded while being cooled from 80 °C to −40 °C at a rate of 5 °C/min and then the melting behaviors were also recorded while being heated from −40 °C to 80 °C at a rate of 5 °C/min.
According to Lambelet and Raemy (1983) and Md. Ali and Dimick (1994), the solid fat index (SFI) at different temperatures was determined by continuous integration of the DSC melting curves using the following equation. where
2.6 Analysis of fatty acid compositions
The fatty acid composition of the RKF fractions was performed using gas chromatography (Agilent Model 6890 Plus, Agilent Technologies, Inc., USA) and the method described in the detail by Jham et al. (1982). The fat samples (10 mg) were saponified with 1 mL potassium hydroxide in methanol (0.5 M) at 100 °C for 5 min. After cooling to room temperature, 400 μL aqueous hydrochloric acid in methanol (4:1 v/v) were added and heated at 100 °C for 15 min to methylate the free fatty acids to fatty acid methyl esters (FAMEs). The mixture was then cooled to room temperature and 3 mL hexane was added. The hexane supernatant containing FAMEs was separated and anhydrous sodium sulfate was added into the hexane phase to remove the residual water. The dried FAMEs solution (1 μL) was then injected into an HP-FFAP column (25 m × 0.32 mm id, 0.5 μm film thickness) in splitless mode. The injector and detector temperatures were maintained at 250 °C. The oven temperature was initially held at 140 °C for 4 min, and then increased to 230 °C at a rate of 3 °C/min and held at 230 °C for 20 min. Helium was used as the carrier gas at a flow rate of 1.0 mL/min. The amounts of each fatty acid were reported as percentage areas relative to the 14 component FAMEs standard (C8–C24).
2.7 Characterization of fat crystal microstructure
The crystal microstructure of the fractionated RKF was observed using polarized light microscopy (PLM; Axiolab®, Carl Zeiss Pty Ltd., Germany) according to Sonwai and Ponprachanuvut (2012). The fat samples were made molten at 80 °C for 15 min to destroy any crystalline structure. The molten samples (around 10 μL) were dropped onto the gap of a preheated glass slide and a preheated glass cover slip was placed over the molten samples, taking care to avoid creating any air bubbles. The slides were then kept at 25 °C for 24 h to allow the fat to crystallize. The fat crystal microstructure images were recorded using a color video camera (MicroPlublisher with Real-Time Viewing, QImaging Ltd., Canada). The preview and acquisition resolutions were 682 × 512, capture depth was 24 bit-color and 40× objective lens magnification was used.
2.8 Characterization of fat polymorphism
The polymorphic form of the fat fractions was determined using X-ray diffractometer with the method modified from Sirisompong et al. (2011) and Sonwai and Ponprachanuvut (2012). X-ray diffraction was measured using Cu–Ka radiation with a 1.54056 Å wavelength, 40 kV voltage and 30 mA current. The scanning was performed in wide angle X-ray scattering from 10 °2θ to 28 °2θ with a scan speed 0.02 °/s, respectively, at ambient temperature. Before XRD analysis, the fat samples were melted at 80 °C for approximately 15 min and were then poured on the glass slide. The fats were isothermally crystallized at 25 °C for 24 h and were mounted on flat stainless steel plates with a rectangular hole.
2.9 Statistical analysis
The fractionation process was conducted in duplicate replications and at least triplicate analyses were performed on each replication. The results were analyzed by a one-way analysis of variance with the SPSS statistical software program. Duncan’s multiple range test was used to determine mean differences at the P < 0.05 level of significance.
3 Results and discussion
3.1 Effect of fractionation time
3.1.1 Yield and iodine value (IV)
The crystallization process of fats consists of crystal nuclei and crystal growth states (Zaliha et al., 2004). When the melted fat was heated to a temperature lower than its melting temperature, new nuclei will continue to form, followed by crystal growth (Bootello et al., 2011; Campos, 2013; Jala et al., 2012; Kang et al., 2013; Lawler and Dimick, 2008; Metin and Hartel, 2005). Kellens et al. (2007) showed that solvent fractionation requires a shorter crystallization time compared to dry fractionation. Reducing the crystallization time will lead to a reduction in the energy costs of the fractionation process. In the present work, to compare the holding time for the isothermal fractionation, the process was performed by melting RKF at 80 °C and mixing with acetone at a ratio of fat to solvent of 1:5 (w/v) at 25 °C for the desired times (12, 18 and 24 h). The crystallization time was measured after the temperature of the sample reached 25 °C. The relationship between the yields of the olein and stearin fractions conducted from RKF and the crystallization time is shown in Table 1. The yield of the stearin fraction increased with the fractionation time (24 h), because, at the shorter fractionation times (12 and 18 h) the fat crystals could not completely form, suggesting this time period represents the mixed nucleation and crystal growth stage (Kang et al., 2013; Lawler and Dimick, 2008). When fractionation was allowed with a longer holding time (24 h), it increased the fat crystal growth leading to an increase in the yield of a higher melting fraction or stearin fraction (10.71%). On the other hand, the yield of the olein fraction was slightly decreased when the time increased up to 24 h (83.96%) because the solid fat crystals were removed to the stearin fraction. Similar results were also reported by Kang et al. (2013) who found that the stearin fraction increased with increasing fractionation time for the fractionation process of palm stearin and it reached an equilibrium state of yield at 8 h of crystallization time. The total amount of fractionated fats could be recovered by approximately 94–95% for all fractionation times. The fractionated fat losses may occur during the filtering process. There may be residual samples on the filter paper, especially stearin fraction. For the present work, the best crystallization time decided by the yield of fractions for RKF was determined to be 24 h. Although, the obtained stearin yield (10.7%) seems low for industrial applications, its purity is high and contains a narrow fatty acid composition range (Table 2). There are many factors that affect the purity and yield of fractionated fat. Not only the fractionation time, but temperature as well (Grall and Hartel, 1992; Hamm, 1995). In the present work, at 25 °C may not be an optimum temperature providing the highest yield of the stearin fraction. The effect of fractionation temperature is therefore necessary for further study. Moreover, conducting the double fractionation could be another way to improve the stearin yield. 12 h 18 h 24 h 12 h 18 h 24 h 24 h 24 h
Sample
Yield (%)
Iodine Value (g I2/g fat)
RKF
100.00Dc
48.69 ± 0.82Ad
Acetone fractionation
Olein
89.15 ± 0.05C
55.15 ± 0.16B
89.50 ± 0.09C
53.58 ± 0.61B
83.96 ± 0.50B
58.10 ± 1.85C
Stearin
4.74 ± 0.16a
15.33 ± 0.91b
4.50 ± 0.17a
14.53 ± 0.99b
10.71 ± 0.59b
9.14 ± 0.59a
Ethanol fractionation
Olein
79.60 ± 0.11A
57.21 ± 0.56C
Stearin
14.02 ± 0.12b
21.44 ± 1.08c
Fatty acid compositions
Percentages of fatty acid per total fatty acids1
RKF
Acetone fractionation
Ethanol fractionation
HCO
HPO
Olein
Stearin
Olein
Stearin
Myristic acid
(C14:0)
0.02 ± 0.00a
0.11 ± 0.01ab
0.02 ± 0.01a
0.26 ± 0.24b
0.03 ± 0.00a
0.10 ± 0.00ab
0.56 ± 0.01c
Palmitic acid
(C16:0)
4.81 ± 4.69c
5.69 ± 0.05d
1.20 ± 0.02a
5.99 ± 0.09e
1.29 ± 0.02a
3.66 ± 0.05b
36.75 ± 0.17f
Palmitoleic acid
(C16:1)
0.46 ± 0.45c
0.57 ± 0.08d
0.05 ± 0.01ab
0.67 ± 0.01e
0.07 ± 0.01ab
0.00 ± 0.00ab
0.09 ± 0.00b
Stearic acid
(C18:0)
7.55 ± 0.04c
7.70 ± 0.02d
5.62 ± 0.04a
7.43 ± 0.02b
7.43 ± 0.01b
42.34 ± 0.03f
22.94 ± 0.06e
Oleic acid
(C18:1)
37.14 ± 0.20d
43.39 ± 0.20e
3.86 ± 0.04b
43.55 ± 0.15e
22.86 ± 0.06c
0.41 ± 0.01a
37.05 ± 0.12d
Linoleic acid
(C18:2)
0.93 ± 0.01d
2.14 ± 0.01f
0.12 ± 0.00b
2.18 ± 0.01g
0.37 ± 0.00c
0.04 ± 0.01a
1.64 ± 0.01e
Linolenic acid
(C18:3)
0.08 ± 0.00e
0.20 ± 0.00f
0.00 ± 0.00a
0.21 ± 0.00g
0.03 ± 0.00c
0.01 ± 0.00b
0.05 ± 0.00d
Arachidic acid
(C20:0)
38.36 ± 0.30e
29.70 ± 0.15d
80.42 ± 0.12g
28.78 ± 0.32c
62.54 ± 0.13f
9.23 ± 0.12b
0.48 ± 0.00a
Eicosenoic acid
(C20:1)
6.59 ± 0.03e
7.05 ± 0.03f
0.52 ± 0.05d
7.47 ± 0.09g
0.40 ± 0.00c
0.02 ± 0.01a
0.14 ± 0.00b
Behenic acid
(C22:0)
3.18 ± 0.06c
2.38 ± 0.03b
7.38 ± 0.04e
2.37 ± 0.04b
4.38 ± 0.05d
43.20 ± 0.11f
0.18 ± 0.00a
Erucic acid
(C22:1)
0.53 ± 0.09b
0.57 ± 0.01b
0.00 ± 0.00a
0.57 ± 0.01b
0.00 ± 0.00a
0.01 ± 0.00a
0.00 ± 0.00a
Lignoceric acid
(C24:0)
0.35 ± 0.02b
0.26 ± 0.01b
0.78 ± 0.01d
0.26 ± 0.02b
0.53 ± 0.02c
0.97 ± 0.02e
0.13 ± 0.00a
Saturated fatty acid
54.27 ± 0.26c
46.08 ± 0.14b
95.44 ± 0.06f
45.37 ± 0.10a
76.04 ± 0.06e
99.63 ± 0.00g
61.10 ± 0.12d
Unsaturated fatty acid
45.73 ± 0.26e
53.92 ± 0.14f
4.56 ± 0.06b
54.63 ± 0.10g
23.96 ± 0.06c
0.49 ± 0.00a
38.97 ± 0.12d
The chemical compositions of the olein and stearin fractions were changed by the fat fractionation process. During the crystallization process, the liquid phase, known as olein, was gently concentrated with more unsaturated fatty acids (USFAs), while the solid phase or stearin had more SFAs (Ab Latip et al., 2013). The iodine value (IV) is normally used to measure the unsaturated degree of fats and oils (Abdalla et al., 2007; Giannelos et al., 2005). Table 1 shows that the IV of the stearin fractions from acetone fractionation (9–15 g I2/g fat) was significantly (P < 0.05) lower than for the original fat (48.69 g I2/g fat) and olein fractions (53–58 g I2/g fat). These results demonstrated that the stearin fractions had become more saturated. For acetone fractionation, an increment in the IV of the olein fractions was observed as the crystallization time increased to 24 h; this was probably due to the olein fraction becoming more unsaturated than with fractionation for a shorter time (12 and 18 h). In contrast, a decrease in the IV of the stearin fractions was observed as the crystallization time increased because of the higher saturation (Fatouh et al., 2005; Kang et al., 2013; Marikkar et al., 2013; Zaliha et al., 2004). This indicated that the stearin yield increased, because the degree of unsaturation of this fraction decreased as the residual time increased.
3.1.2 Thermal properties
The crystallization and melting behaviors of RKF and its fractions were recorded using DSC. Crystallization is a typical exothermic process and melting is a typical endothermic process (Kang et al., 2013; Zhong et al., 2013). The initial and completed phase changes were determined from the onset and endset temperatures of the peaks. The DSC phase change corresponds to different melting triglyceride groups because of their different fatty acid compositions (Solís-Fuentes et al., 2010). According to the crystallizing and melting curves, the original RKF showed three main exothermic peaks and three main endothermic peaks (Figs. 1 and 2), which represent a group of high, middle and low melting point triglycerides, respectively (Sirisompong et al., 2011; Solís-Fuentes et al., 2010; Sonwai and Ponprachanuvut, 2012). The crystal formation for high melting point triglycerides of RKF (Figs. 1a and 2a) began at 50.1 °C and ended at 21.3 °C. The middle fraction which showed a small peak began to crystallize at around 18.9 °C and completed crystallization at −7.5 °C. The lowest melting point fraction had onset and endset crystallization at temperatures of −8.4 °C and −25.6 °C, respectively. The total crystallization enthalpy was 93.35 J/g (Suppl. 1). The RKF began to melt at −15.2 °C and had completed melting at 7.8 °C for the low melting fraction (Figs. 1b and 2b). The onset and endset melting temperatures of the middle melting point triglyceride component were 8.22 and 34.9 °C, respectively. For the highest melting fraction, the fat started to melt at 36.8 °C and had completed melting at 60.4 °C. The total melting enthalpy was 111.93 J/g (Suppl. 2). The thermal curve indicated that the initial or unfractionated RKF had wide melting and crystallizing ranges which were unsuitable for use in specific food products. These results were consistent with those for other natural vegetable fats and oils rich in SFAs, such as palm or palm kernel oils, which normally contain a complex of triglyceride mixtures (Bootello et al., 2011; Garcés et al., 2009) that are also associated with wider melting ranges and which are not suitable for industrial use without fractionation (Bootello et al., 2011; Salas et al., 2009).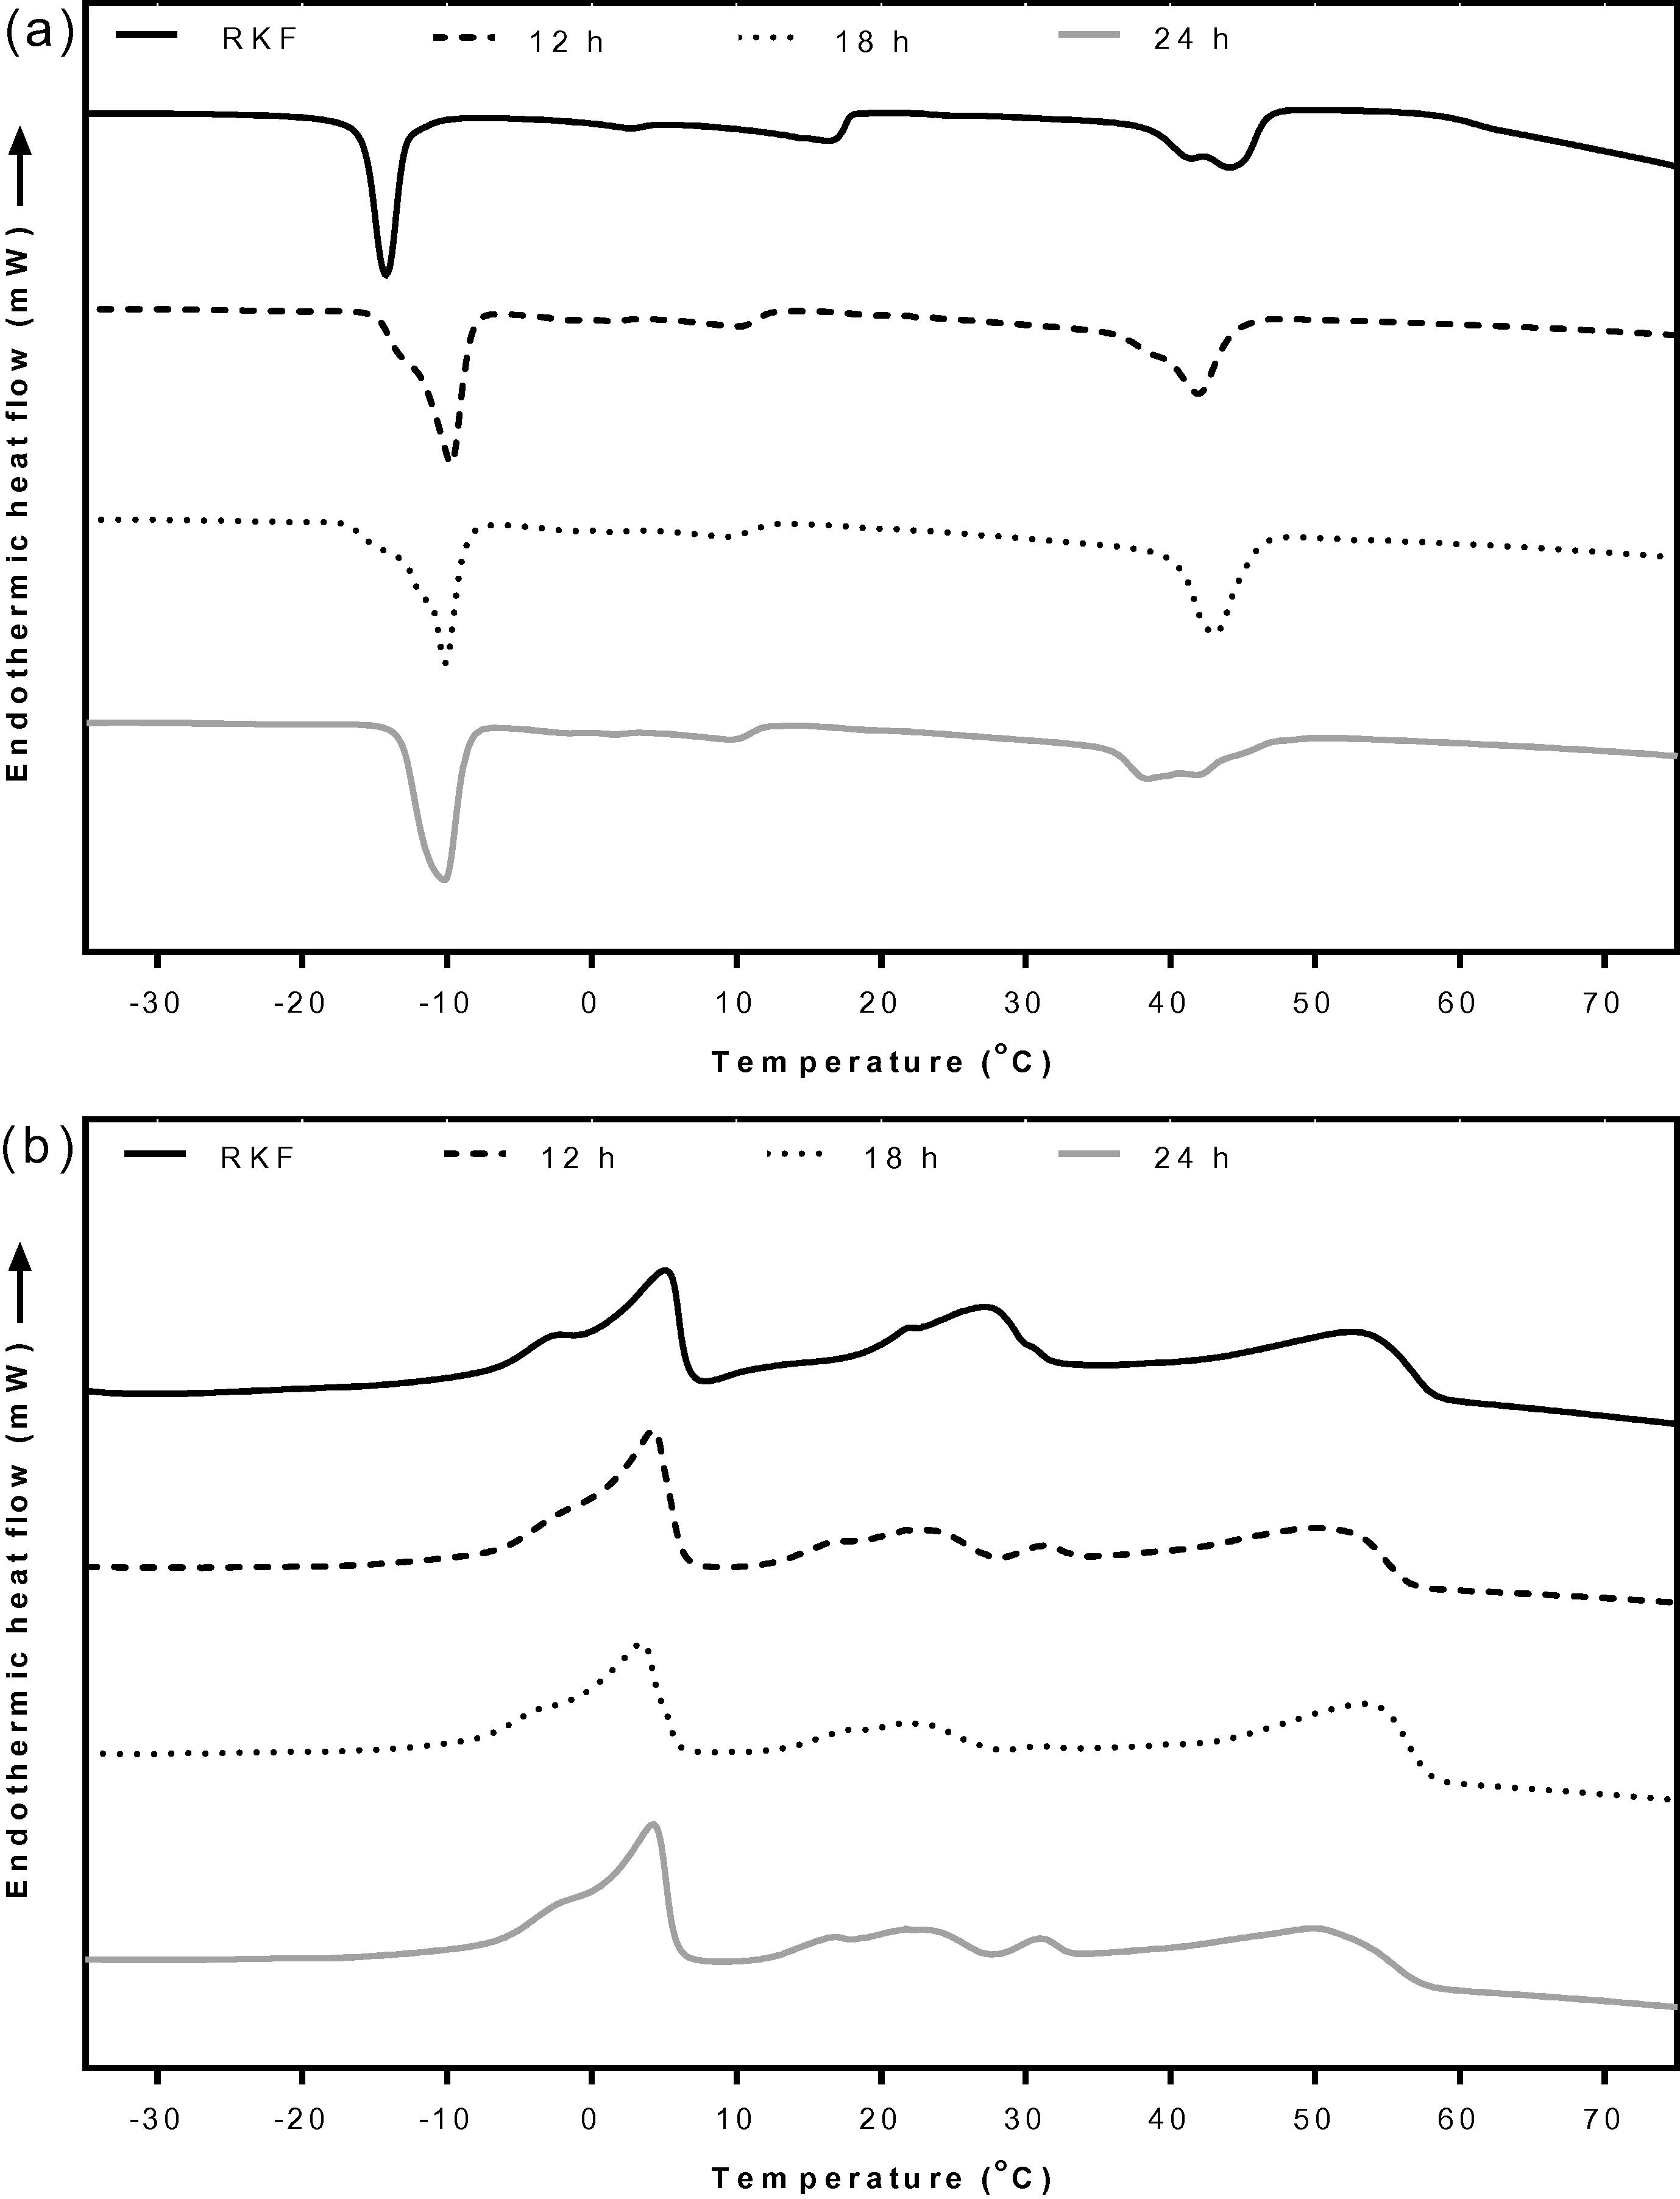
DSC crystallization (a) and melting (b) curves of RKF and olein fractions fractionated by acetone for 12, 18 and 24 h. RKF, rambutan kernel fat.
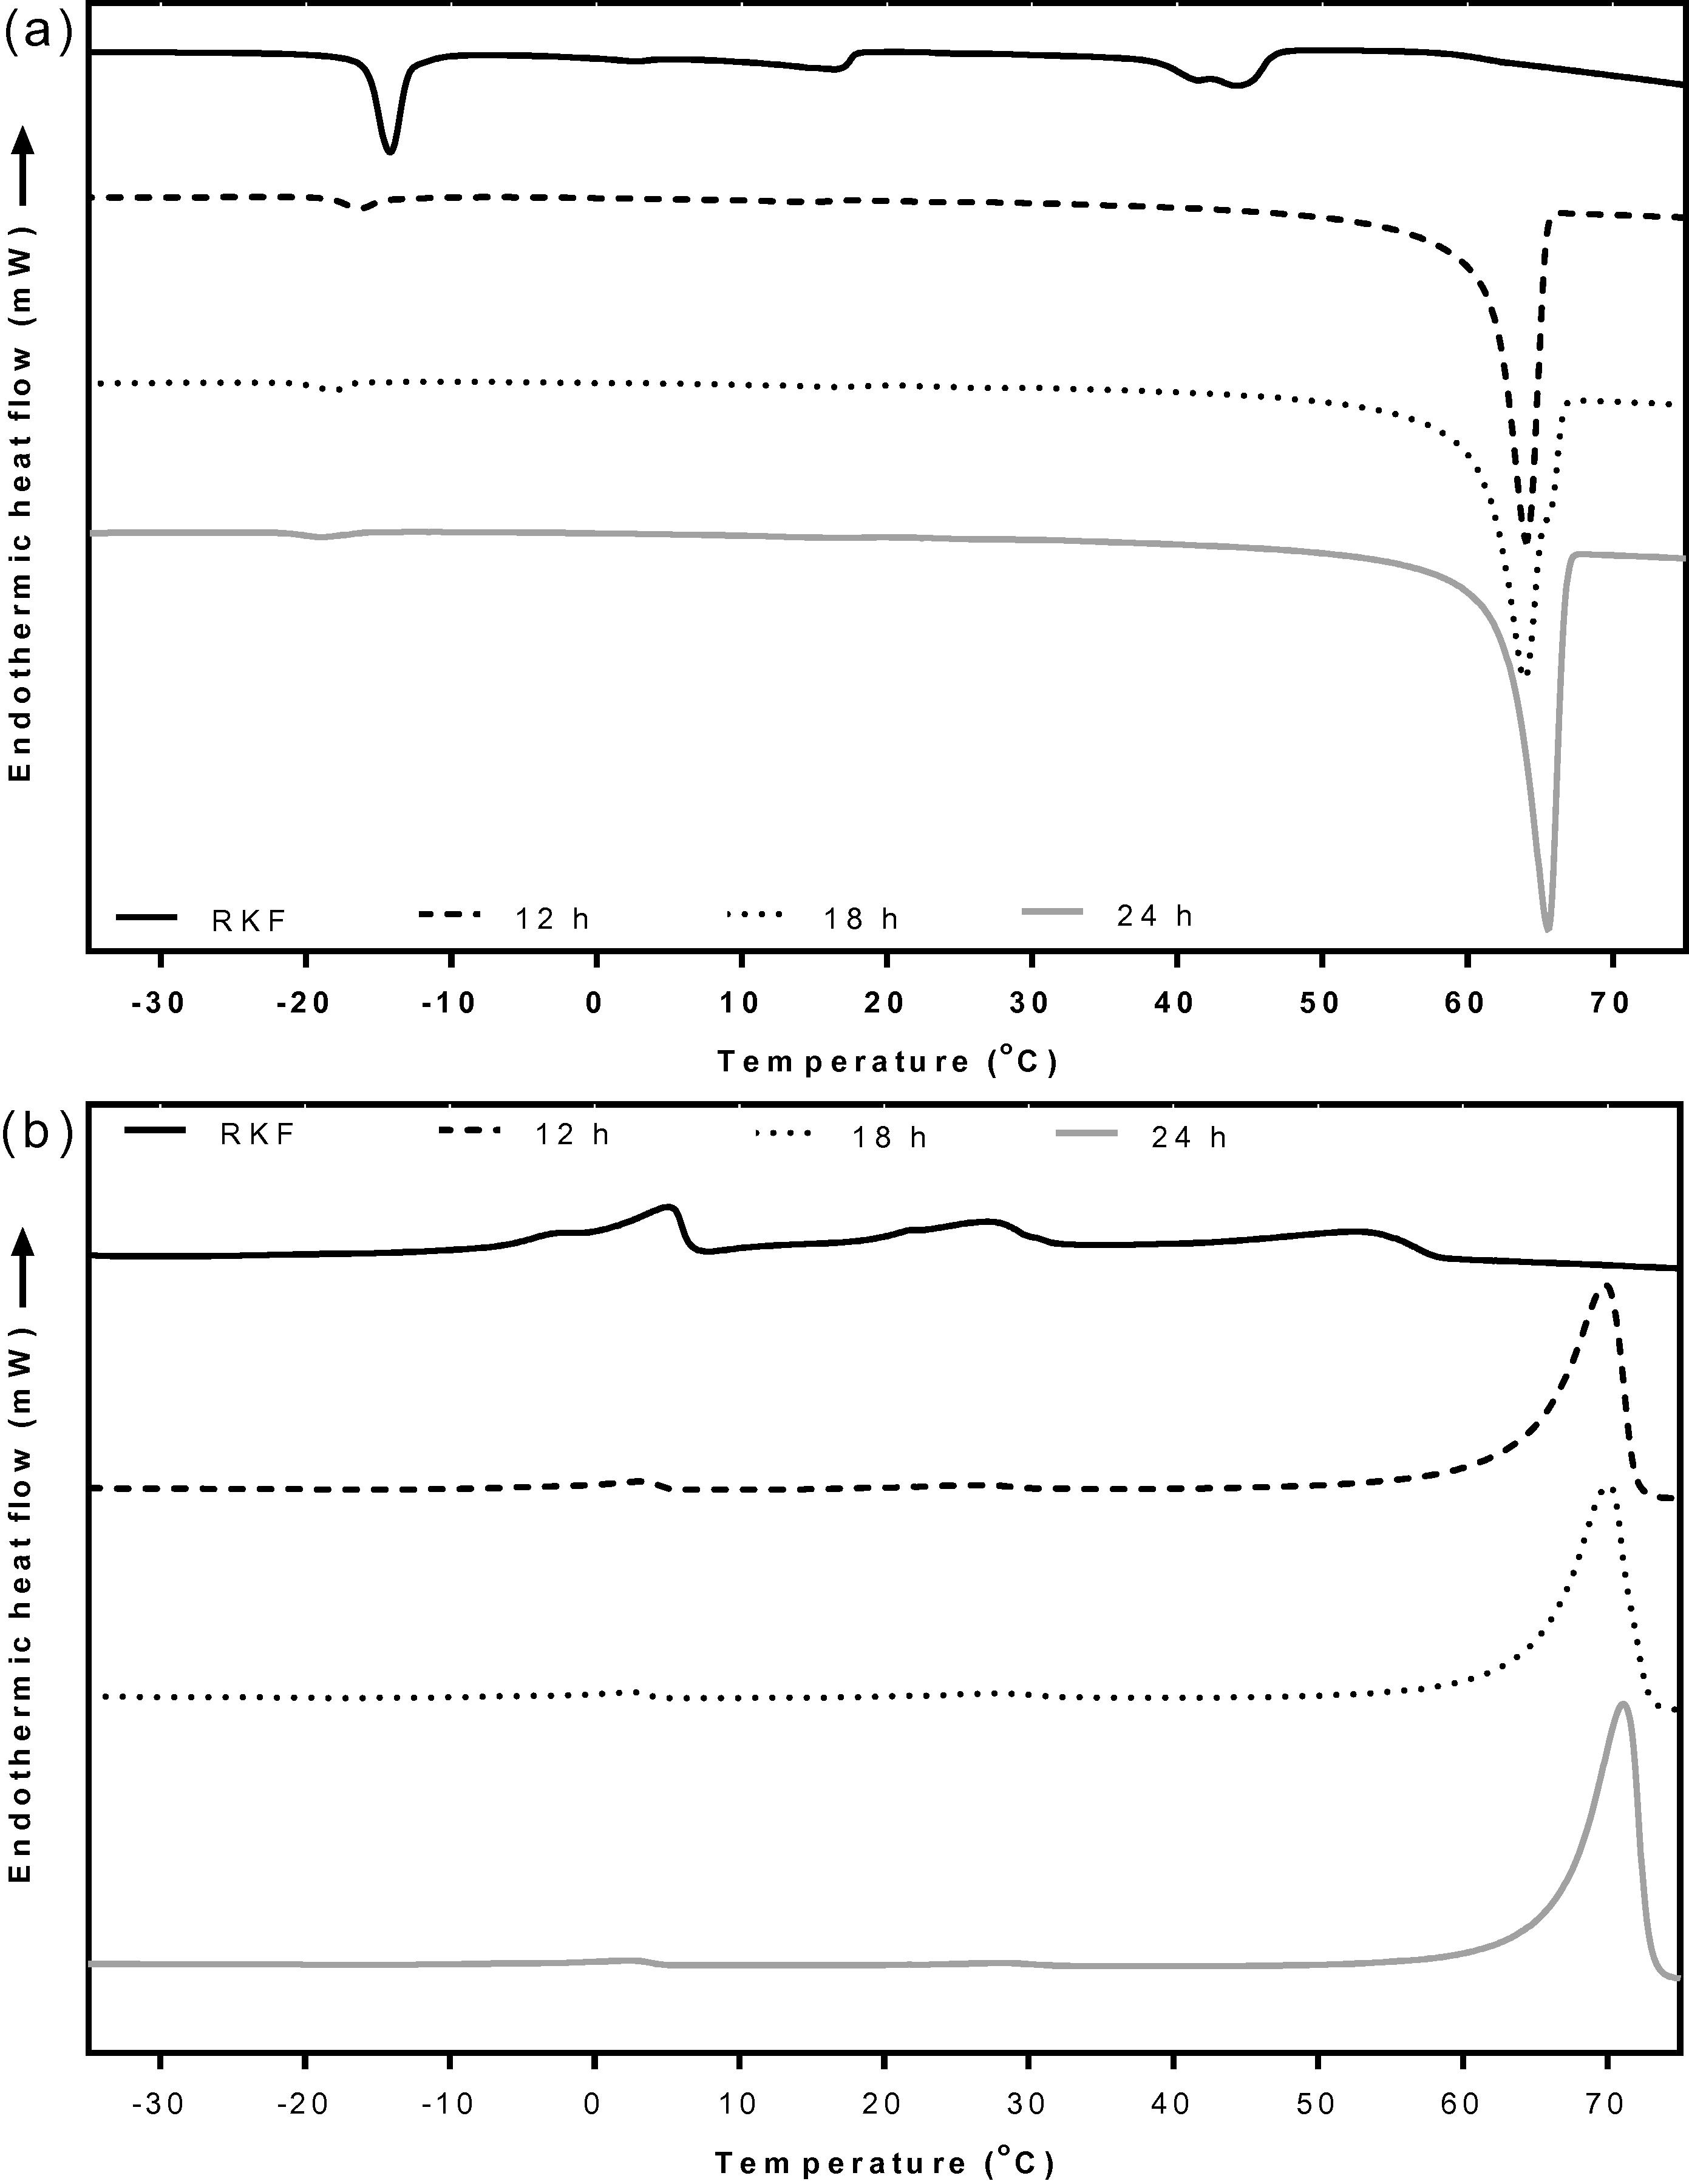
DSC crystallization (a) and melting (b) curves of RKF and stearin fractions fractionated by acetone for 12, 18 and 24 h. RKF, rambutan kernel fat.
The DSC curves of the olein and stearin components from all fractionation times are presented in Figs. 1 and 2, respectively. At all holding times, the olein fractions showed three main crystallization and melting peaks similar to original RKF with slight changes in the onset and endset temperatures (Fig. 1). All olein fractions had crystallization and melting temperatures lower than original RKF. The stearin fractions (Fig. 2), showed one main peak in the high melting region and one tiny peak in the low melting region for either crystallization or melting. The fat crystallized at a significantly (P < 0.05) higher temperature (∼67–69 °C) than the original RKF (50.1 °C) (Fig. 2a and Suppl. 1). Similarly, all stearin fractions were completely melted at significantly (P < 0.05) higher temperatures (∼76–77 °C) than the original RKF (60.4 °C) (Fig. 2b). The main melting peak of the stearin fractions showed a unique shape which was narrower than melting range from ∼37 to 77 °C compared with the original RKF (18 to 60 °C) (Suppl. 2). These results could be attributed to the high melting component being shifted to a higher temperature compared to the original fat and this is expected due to the removal of the liquid fraction (Fig. 2) in agreement with a previous study of Ab Latip et al. (2013). The stearin at 24 h started to crystallize at 69.2 °C with a sharp peak at 65.6 °C which was higher than the stearin obtained at 18 and 12 h, respectively. The ΔH values for the stearin at 24 h were also significantly (P < 0.05) higher than those of the original RKF and other stearins. Thus, fractionation over longer times favored the formation of high melting point stearin (Salas et al., 2009; Zaliha et al., 2004). The results were consistent with the solid fat index (SFI) data showing the ratio of fat in crystalline form to liquid at various specified temperatures. The SFI can be calculated from the partial area at each temperature divided by the total area of the DSC melting curve (Md. Ali and Dimick, 1994). Fig. 3 shows the SFI of original RKF and the olein and stearin fractions at various temperatures. Showing a similar trend to the thermal properties (Figs. 1 and 2), the SFI of olein fractions at all fractionation times were slightly lower than the original RKF because the high melting fatty acids were not completely separated into stearin fractions (Fig. 3a). In contrast, the SFI of all stearin fractions were higher than the original RKF at all temperatures, especially for stearin fractionated at 24 h, which had the highest SFI of all holding times (Fig. 3b). This was due to the stearins containing higher amounts of saturated fats and being crystallized out first during the fractionation process (Kang et al., 2013; Zaliha et al., 2004).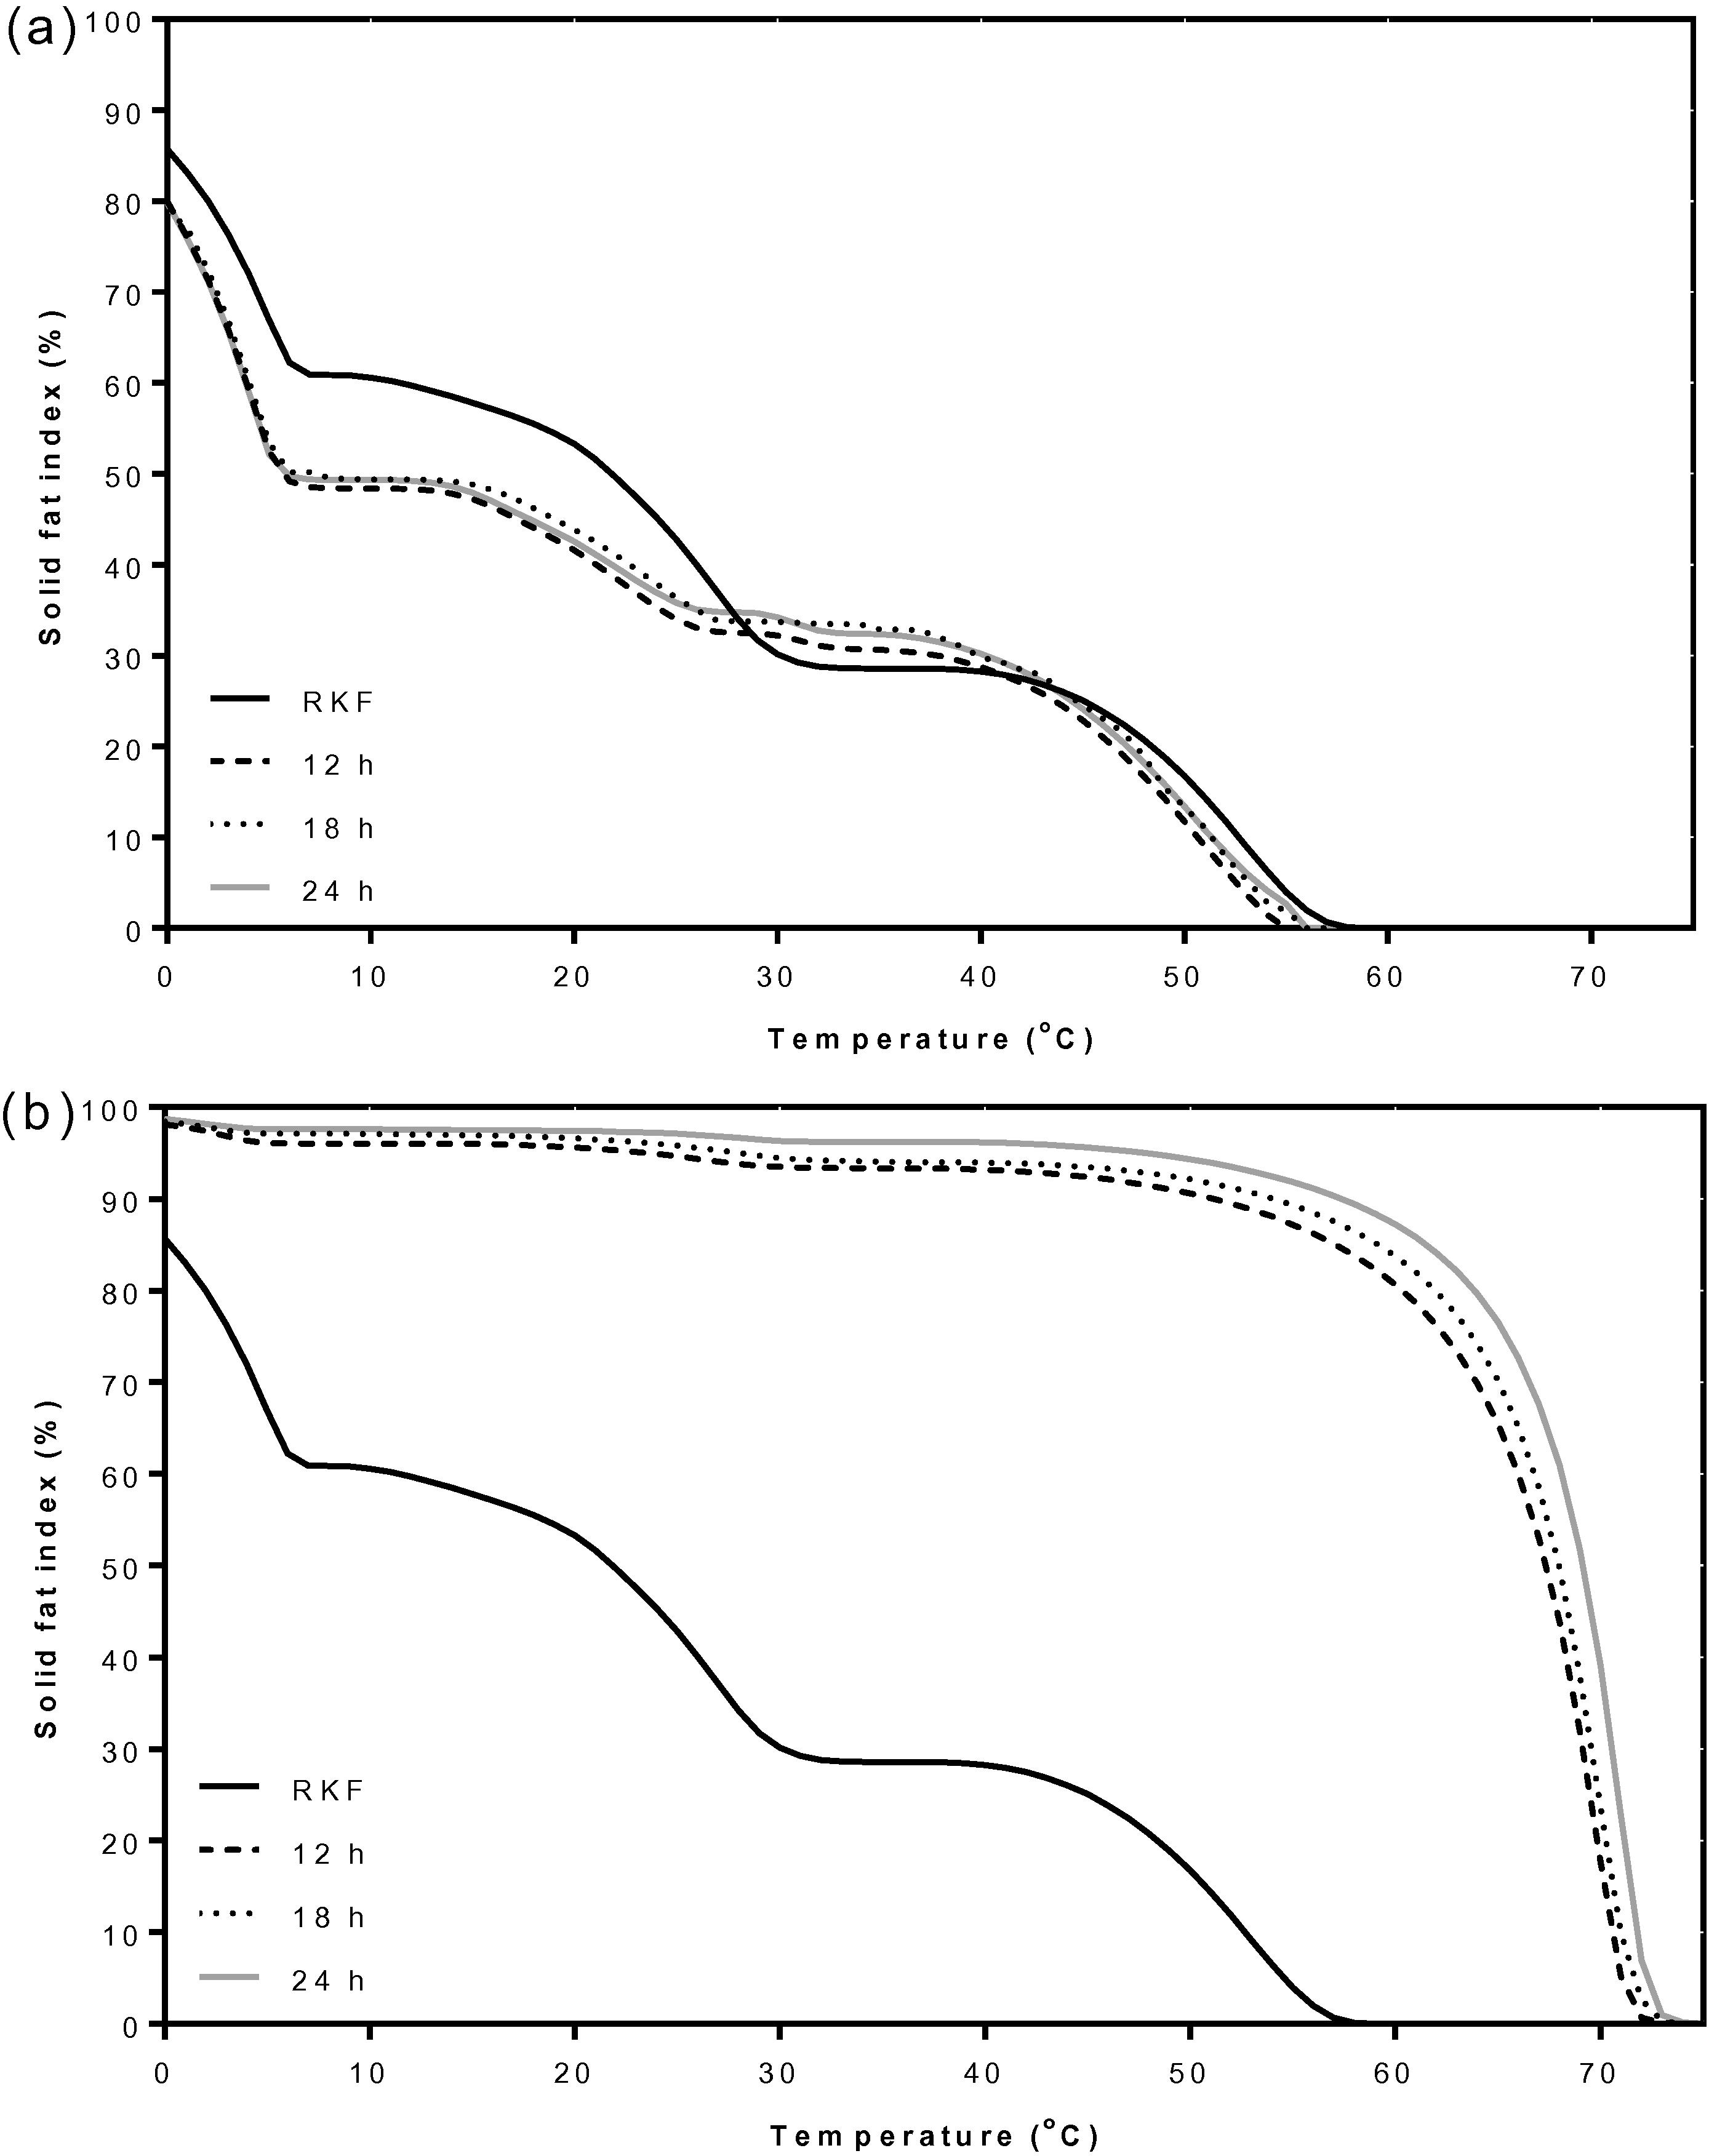
Solid fat index (%) at various temperatures of RKF, olein (a) and stearin (b) fractions that were fractionated by acetone for 12, 18 and 24 h. RKF, rambutan kernel fat.
3.2 Effect of solvent type
3.2.1 Yield and iodine value (IV)
The effect of solvent types on the RKF fractionation process was studied. Ethanol was used as another edible solvent to compare with acetone fractionation. At 24 h, the yield of stearin from acetone fractionation (10.71%) was lower than the stearin from ethanol fractionation (14.02%) (Table 1) probably because the fat preferentially dissolved in the non-polar solvent, and the polarity of ethanol is greater than acetone, so more fat dissolved in acetone than in ethanol (Calvo et al., 2009; Jala et al., 2012). Therefore some olein component was trapped in the stearin fractions for ethanol fractionation. As a result, the olein yield from the ethanol fractionation (79.60%) was lower than from the acetone fractionation (83.96%). The results were confirmed by the IV measurement which shows that the IV of stearin from the acetone fractionation (9.14 g I2/g fat) was lower than the stearin fractions from the ethanol fractionation (21.44 g I2/g fat) (Table 1). This indicated that the stearin fractionated by acetone had become more saturated (Fatouh et al., 2005; Marikkar et al., 2013). Nevertheless, the IV of the olein fractions was not significantly different between acetone and ethanol fractionations at 25 °C for 24 h.
3.2.2 Fatty acid compositions
The fatty acid compositions of all RKF fractions are given in Table 2. The results showed that the total SFAs and USFAs found in RKF were around 54 and 46%, respectively. The two major fatty acids in RKF were arachidic acid (38.36%) and oleic acid (37.14%). These two fatty acids comprised more than 75% of the total fatty acids which was consistent with previous studies (Harahap et al., 2012; Manaf et al., 2013; Sirisompong et al., 2011; Solís-Fuentes et al., 2010; Sonwai and Ponprachanuvut, 2012). The fatty acid profiles of stearin or the high-melting fraction and of olein or the low-melting fraction were significantly different from the original RKF. For the low-melting or olein fraction from both acetone and ethanol fractionations, there was an overall decrease in the proportion of SFAs (46.08% and 45.37%, respectively). The main SFAs from acetone and ethanol fractionations, namely, arachidic (29.70% and 28.78%, respectively) and behenic acid (2.38% and 2.37%, respectively), experience a decrease with a concurrent increase in the proportion of the USFAs (53.92% and 54.63%, respectively). The main USFAs, namely, oleic acid (43.39% and 43.55%, respectively), linoleic acid (2.14% and 2.18%, respectively) and eicosenoic acid (7.05% and 7.47%, respectively) experienced increments. The stearin or high-melting fractions were enriched in SFAs, especially arachidic and behenic acid. The high level of arachidic acid is the main reason for the low iodine value observed in the stearin fractions particularly in the acetone fractionation (9.14 g I2/g fat). On the other hand, the proportion of USFAs decreased, especially for oleic and eicosanoic acid due to the USFAs being separated from the stearin fractions (Marikkar et al., 2013). The total amount of USFAs in the stearin from acetone fractionation was significantly (P < 0.05) lower than in the stearin from the ethanol fraction. These results were consistent with the IV data described in the previous section.
3.2.3 Thermal properties
The crystallization behaviors of the olein fractions from both the acetone and ethanol fractionations are presented in Fig. 4a. The oleins which were fractionated at 25 °C for 24 h using acetone showed three exothermic peaks, which were the same as for the original RKF (Fig. 4a). Although the olein from acetone fractionation was not clearly different in thermal behavior, its olein was also composed of more USFAs (53.92%) than the original RKF, whereas, the olein from the ethanol fractionation showed three exothermic peaks, its onset and endset temperatures had shifted to the lower region compared with the original RKF. The onset and endset temperatures for the crystallization of this olein were 41.6 and −39.8 °C, respectively (Suppl. 3), indicating that the high melting components were partially removed from the olein. Therefore, the crystallizing onset and endset temperature of olein from ethanol fractionations shifted to a lower temperature compared to the original RKF (50.1 and −25.6 °C, respectively), because it contained more USFAs (54.63%) than the original RKF (45.73%). The high-melting or stearin fractions from both the acetone and ethanol fractionations had different exothermic patterns from the original RKF. The most fat crystals of stearin which was fractionated by acetone were crystallized at a higher temperature (32.5 to 69.2 °C) than the highest melting component of the original RKF (21.3 to 50.1 °C) (Fig. 4a). Moreover, this stearin also had the highest exothermic enthalpy of 180.7 J/g, since this fraction mostly contains long chain SFAs, especially arachidic acid which constituted more than 90% (Table 2). On the other hand, the crystallization curve of stearin from the ethanol fractionation still showed three exothermic peaks between −21.5 and 50.4 °C with the total enthalpy around 97.5 J/g. The highest melting component had a similar onset temperature of about 50.4 °C compared to the initial RKF (50.1 °C) but lower than stearin from the acetone fractionation (69.2 °C) (Suppl. 3). However, the middle and low melting point fractions had onset temperatures (30.3 and −6.2 °C, respectively) higher than the initial RKF probably because ethanol has lower selectivity than acetone as reported by Calvo et al. (2009), Foreman and Brown (1944) and Talbot et al. (2006).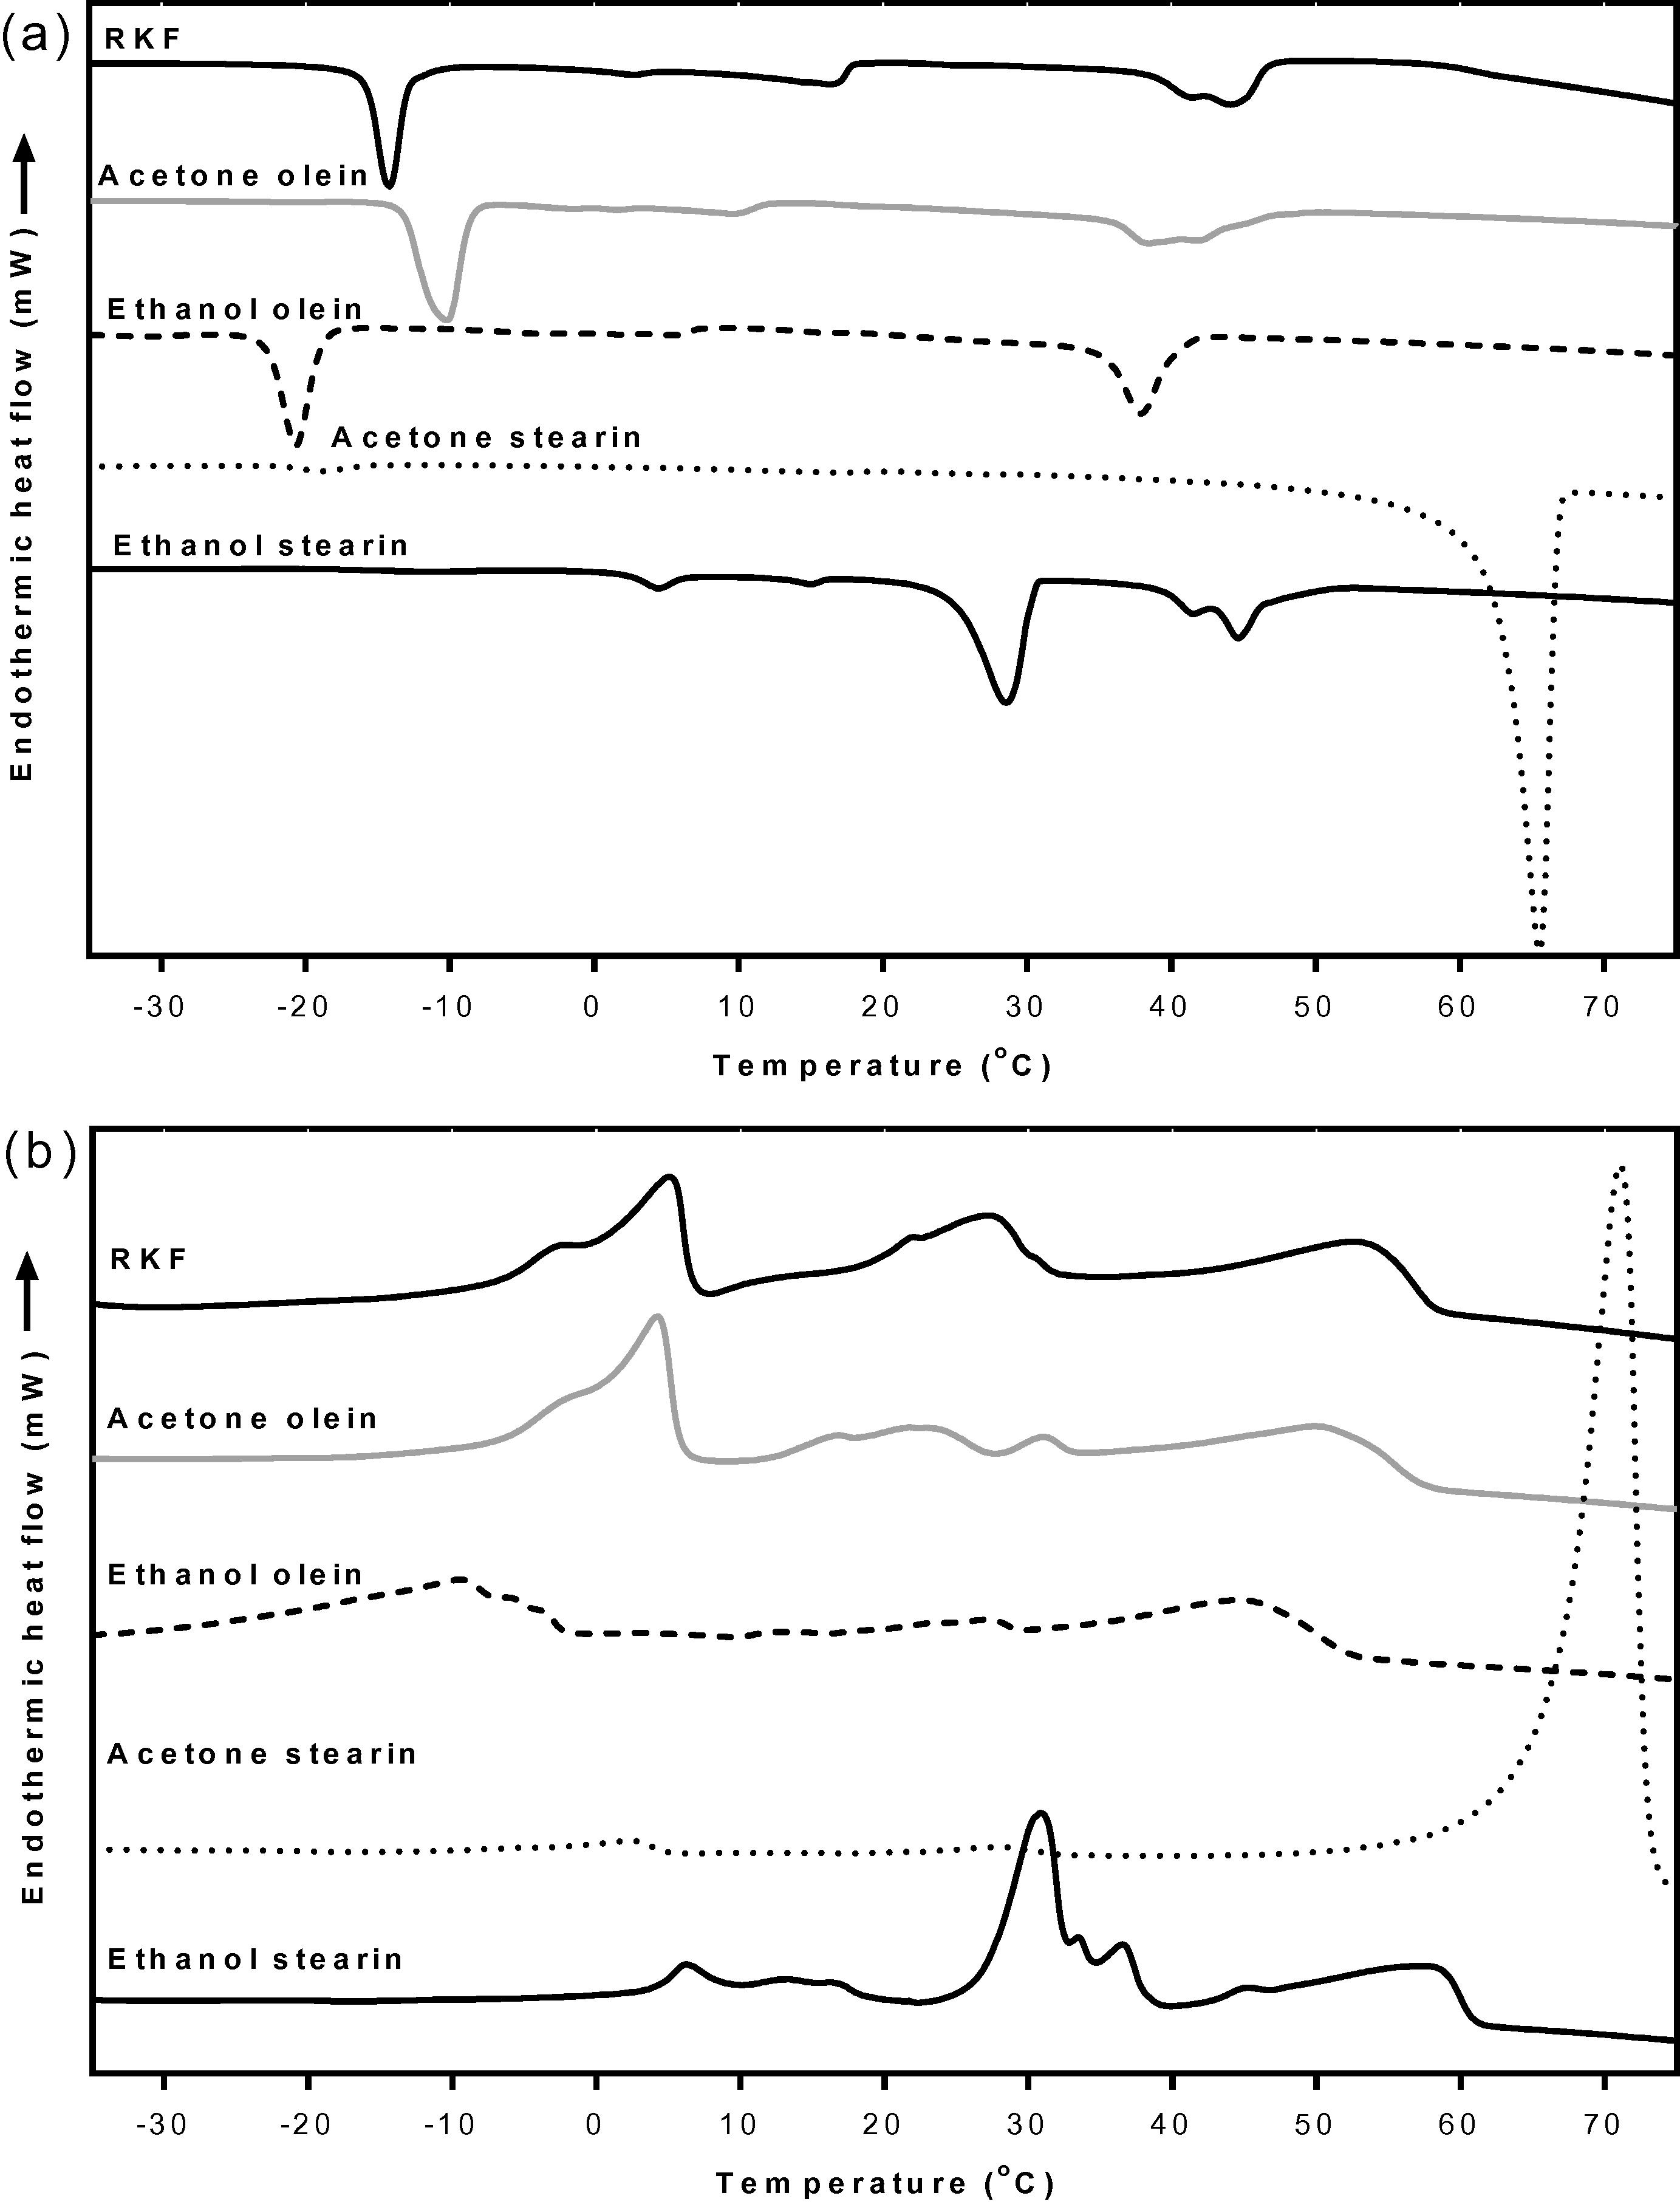
DSC crystallization curves (a) and melting curves (b) of RKF and its fractions that were fractionated at 24 h. RKF, rambutan kernel fat.
The melting behavior showed a similar result to the crystallization behavior (Fig. 4b and Suppl. 4). The melting curve of the olein fractions from the acetone fractionation showed the three endothermic peaks like the original RKF. On the contrary, the olein fractionated using ethanol showed a different pattern compared to the original and olein from the acetone fractionation. This olein had lower onset (−36.0 °C) and endset melting temperatures (53.5 °C) than the original RKF (−15.2 and 60.4 °C, respectively) probably due to being composed of more USFAs (54.63%) than the original RKF (45.73%) (Table 2).
Considering the high melting fractions, stearin from both the acetone and ethanol fractionations had different endothermic patterns from the original RKF. The stearin from the acetone fractionation showed a tiny peak in the low melting region and a large peak in the high melting region with endset temperatures of 77.0 °C. Its total enthalpy was 197.9 J/g which is quite higher than for the original fats (111.93 J/g) and for stearin from the ethanol fractionation (107.71 J/g) because there was a higher proportion of SFAs (95.44%) (Table 2). As a result, this stearin required a high level of energy to melt the fat crystals, which corresponded with the reports of Kang et al. (2013) and Zaliha et al. (2004). The stearin from the ethanol fractionation showed three endothermic peaks which were mostly composed of the middle melting component with a higher endset temperature (62.6 °C) than the original RKF (60.4 °C). These results were expected due to the high selectivity of acetone compared to ethanol that allows the complete removal of the high-melting component from the lower-melting fraction. These results were confirmed by the SFI values which showed that the SFI patterns of the olein fractions from both the acetone and ethanol fractionations were lower, while the SFI of stearin fractions were higher than for the original RKF. The SFI of stearin fractionated using ethanol was clearly higher than the original RKF at temperatures below 40 °C. However, the stearin from acetone fractionation had a higher SFI than the original RKF at all temperatures and it completely melted (0% SFI) at temperatures above 70 °C (Fig. 5). As a result, the high-melting fat fraction or stearin of RKF fractionated by acetone has a high purity and potential application with food products with a possibility to replace hydrogenated fat.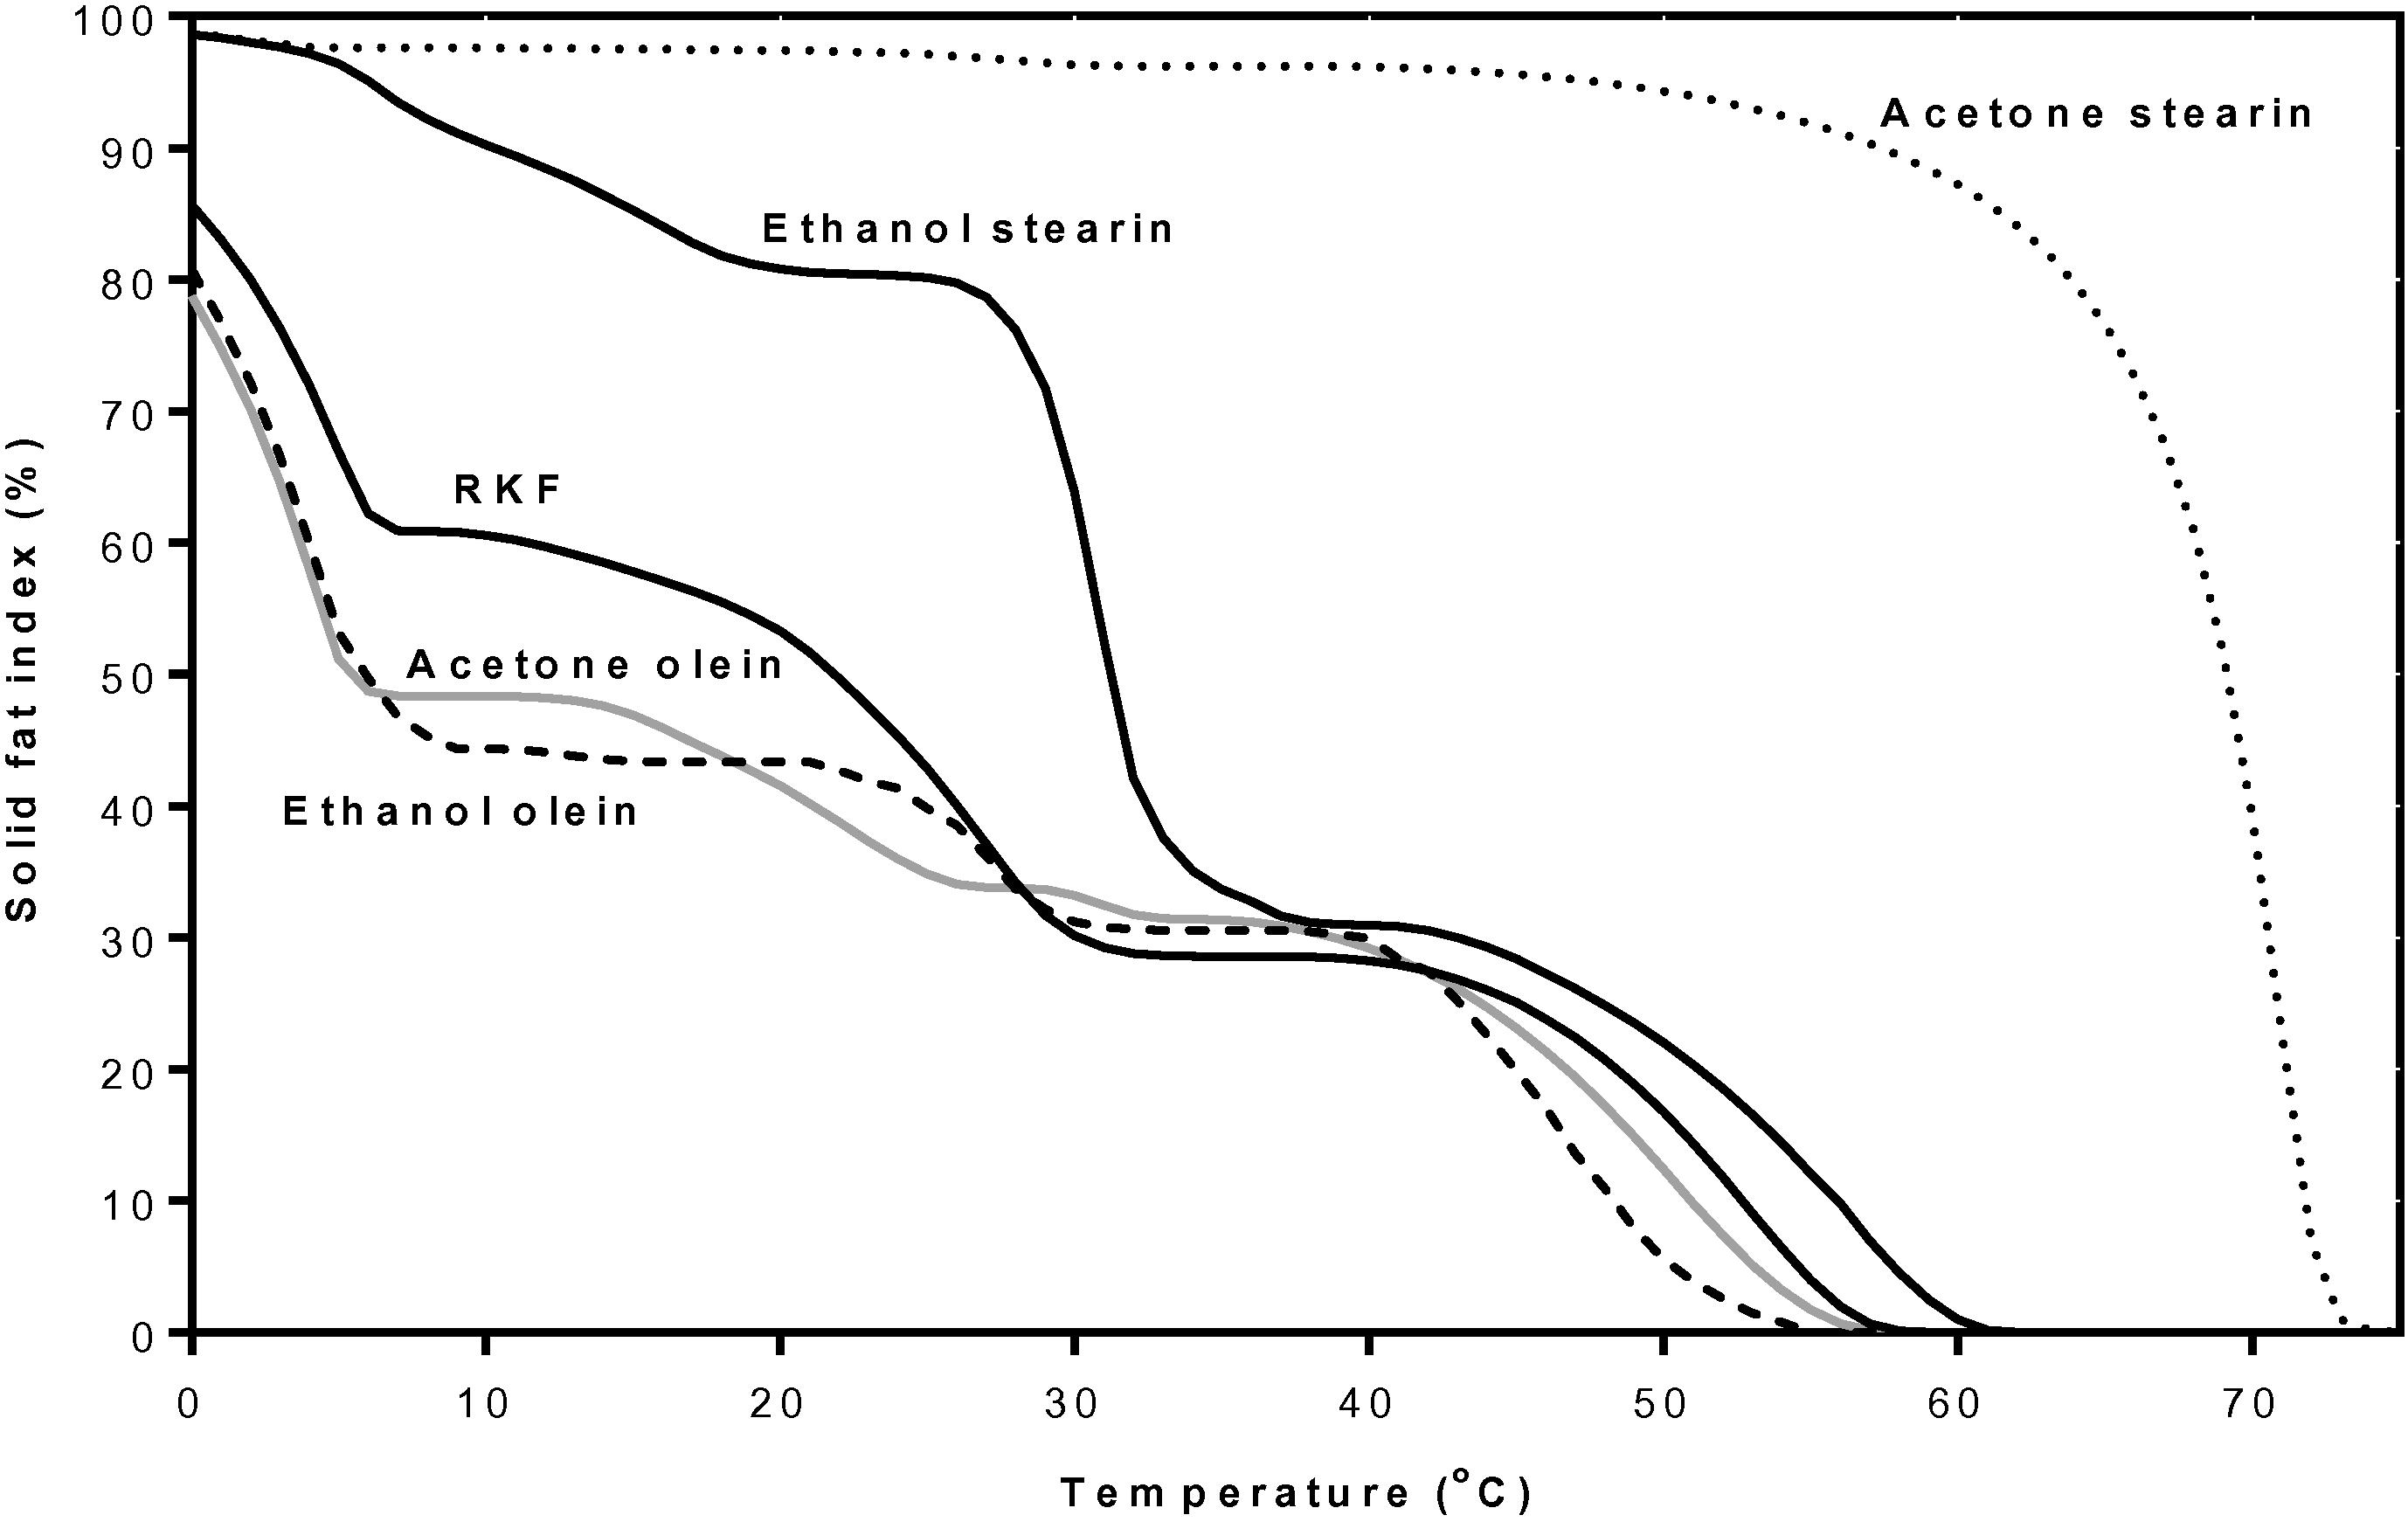
Solid fat index (%) at various temperatures of RKF and its fractions that were fractionated at 24 h. RKF, rambutan kernel fat.
3.3 Characteristics of stearin fraction compared to commercial hydrogenated fat
The formation of a fat crystal network is important in the manufacture of plastic fats because it provides firmness or solid-like properties (Martini et al., 2006). Thus, the microstructures of RKF stearin fractionated by acetone and of all the commercial hydrogenated fats were observed using a polarized microscope as shown in Fig. 6. When fats are cooled from melting to a temperature below their melting point, the melted fats will become solid and form primary crystals. These primary crystals aggregate to form clusters, resulting in the formation of a continuous three-dimensional network (Martini et al., 2006). In addition, the morphology of crystals may also relate with the polymorphic forms of fats. The RKF stearin from the acetone fractionation showed large clusters of long needle-like structures (40–60 μm) at 25 °C (Fig. 6a). This morphology of RKF stearin fraction may represent the β′ form of fat crystal (Oh et al., 2002). This assumption was therefore confirmed by measuring X-ray diffraction (XRD) short-spacing patterns of rambutan kernel stearin fraction. The XRD curve (Fig. 7) of this stearin showed 2 main peaks at 4.2 Å and 3.7 Å that corresponded to β′ and β forms, respectively (Ahmadi et al., 2008; Campos, 2013; D’souza et al., 1990; Oh et al., 2002) and a much higher signal of β′ than β was observed. For HCO, it presented tight large clusters of feather-like crystals that varied in size from 10 to 30 μm (Fig. 6b). This crystal structure was found generally where the level SFA was more than 90%. The major SFAs in HCO are 43.20% behenic acid, 42.34% stearic acid and 9.23% arachidic acid (Table 2). Considering the XRD curve of HCO (Fig. 7), this fat showed only one main peak at 4.2 Å that related to β′ form (Campos, 2013; D’souza et al., 1990). These results are probably due to the high behenic and stearic acid content in HCO that could be corresponding to a β′ form which is in agreement with previous study of de Man et al., 1989. HPO showed a large number of small spherulite-type crystals that varied in size from 10 to 15 μm. This crystal structure (generated from fat) contained 61.10% SFA and 38.97% USFA. The major FAs in HPO were 37.05% oleic acid, 36.75% palmitic acid and 22.94% stearic acid (Table 2). The XRD curve of HPO (Fig. 7) showed 2 main peaks at 4.2 and 3.8 Å that corresponded to β′ form (Campos, 2013; D’souza et al., 1990) and the weak peak at 4.4 Å was closed to the diffraction peaks of pseudo-β′ form (D’souza et al., 1990; Sonwai and Ponprachanuvut, 2012). It can be indicating that the main polymorphic form of HPO was β′ which also had been reported in the previous studies (Danthine and Deroanne, 2003; Omar et al., 2005). According to the microstructures, the stearin from acetone fractionation showed larger crystals than HCO and HPO, respectively. Corresponding to the studies of Herrera and Hartel (2000) and Wiking et al. (2009), the high purity of long chain SFA of this stearin (arachidic acid 80.42%, Table 2) leads to the formation of fewer nuclei with a higher purity that are able to grow into larger crystals, similar to HCO that contained an SFA level of more than 90%. Crupkin and Zambelli (2008) and Valenzuela et al. (2011) reported that fats rich in SFA are commonly used in formulations of fat-based products to develop elasticity and hardness of products.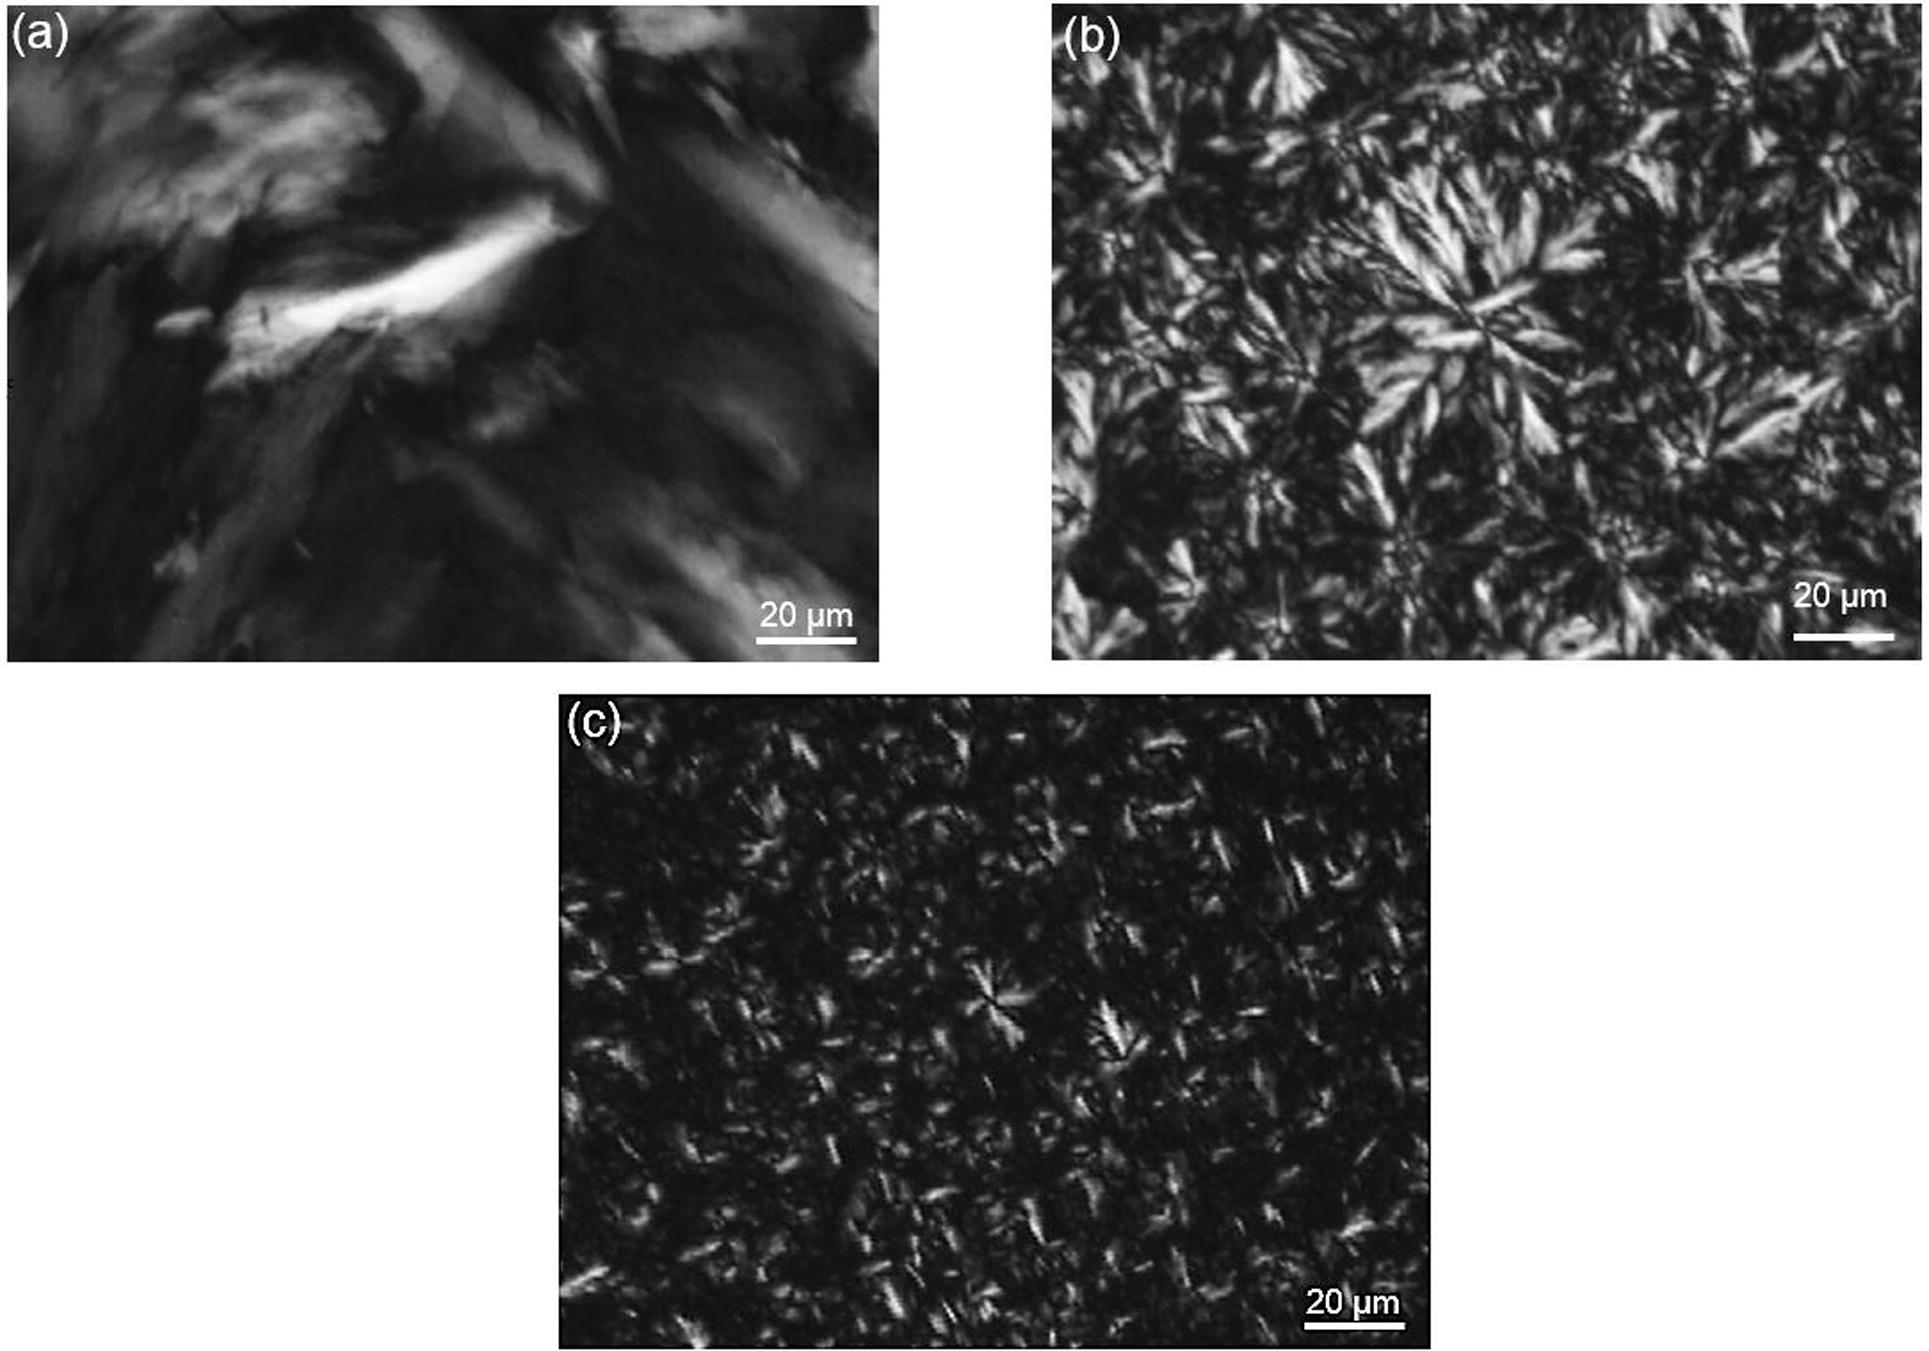
Polarized light micrographs of stearin obtained from acetone fractionation (a), fully hydrogenated canola oil (b) and hydrogenated palm oil (c) crystallized isothermally and stored at 25 °C for 24 h at 400× magnification.
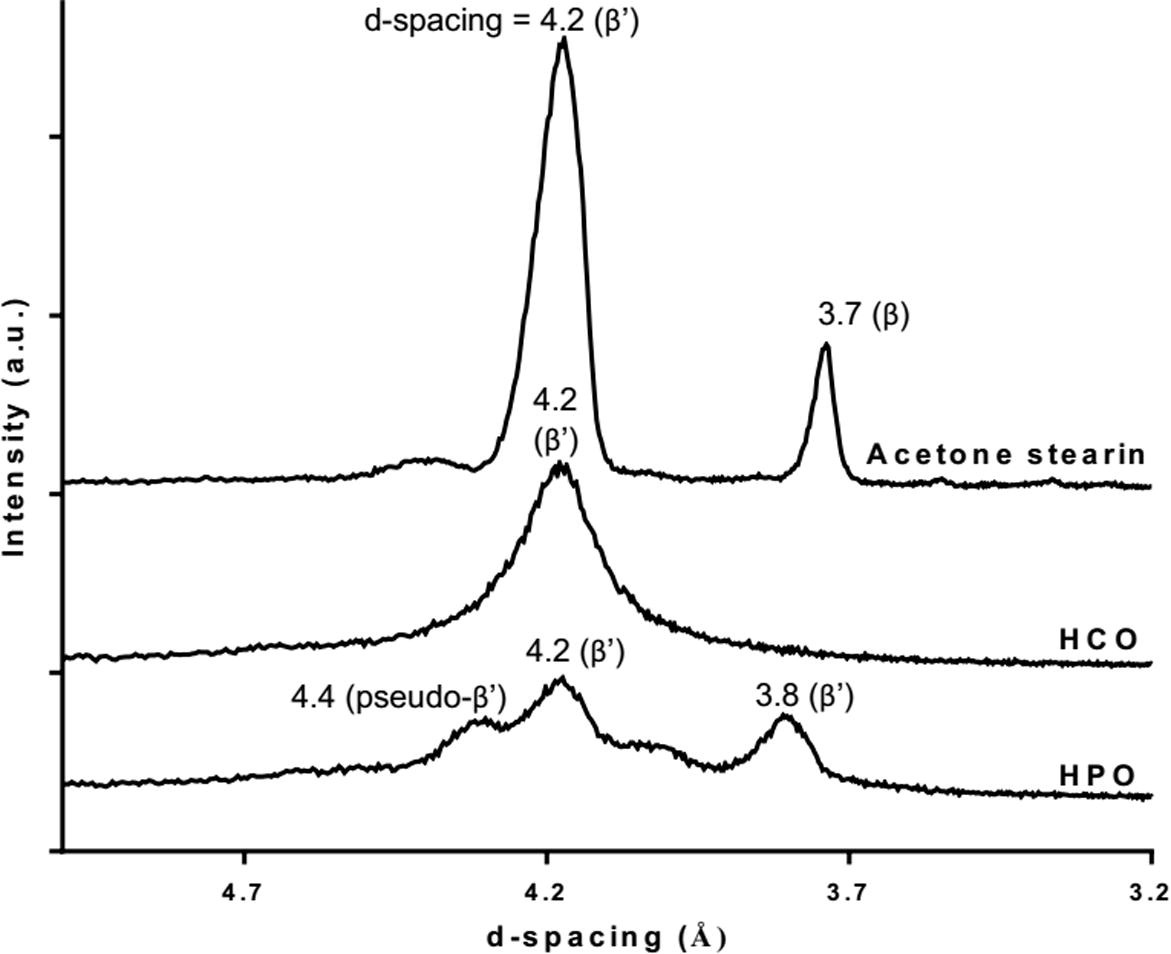
X-ray diffraction short-spacing patterns of rambutan kernel stearin fractions from acetone fractionation, fully hydrogenation canola oil (HCO) and hydrogenated palm oil (HPO) obtained after static crystallization at 25 °C for 24 h.
Fig. 8 shows the DSC curve of RKF stearin fractionated by acetone compare with commercial hydrogenated fats including HCO and HPO. All fats showed one main exothermic and endothermic peak which was different for the onset and endset temperatures. Based on the crystallizing and melting curves, HCO shows only a single exothermic and a single endothermic peak with a small shoulder at around 60 °C (Fig. 8a and b). The crystal formation began at 56.3 °C and ended at 29.8 °C with 126.32 J/g of total crystallization enthalpy (Suppl. 3). The HCO began to melt at 36.6 °C and completed melting at 64.6 °C with 131.17 J/g of total melting enthalpy (Suppl. 4). The thermal curve indicated that HCO had narrow crystallizing and melting ranges corresponding to the report of de Oliveira et al. (2015) who recorded that the single peak, narrow range and high endo- and exothermic enthalpies of thermal curves for HCO confirmed its polymorphic stability. HPO showed a single exothermic peak with a shoulder at 30 °C and a single wide endothermic peak (Fig. 8a and b). The crystal formation began at 37.3 °C and ended at −17.2 °C with total crystallization enthalpy of 90.59 J/g (Suppl. 3). The HPO began to melt at 22.8 °C and completed melting at 54.3 °C with the total melting enthalpy of 105.62 J/g (Suppl. 4). The thermal behavior indicated that HPO had lower crystallizing and melting ranges than HCO because HPO contained higher levels of USFA than HCO (38.97% and 0.49, respectively) (Table 2). When the thermal behavior of the commercial hydrogenated fats was compared with the stearin fraction from the acetone fractionation, the crystallizing onset and melting endset temperatures of HCO (56.3 °C and 64.6 °C, respectively) were quite high and close to those for stearin from the acetone fractionation (69.2 °C and 77.0 °C respectively).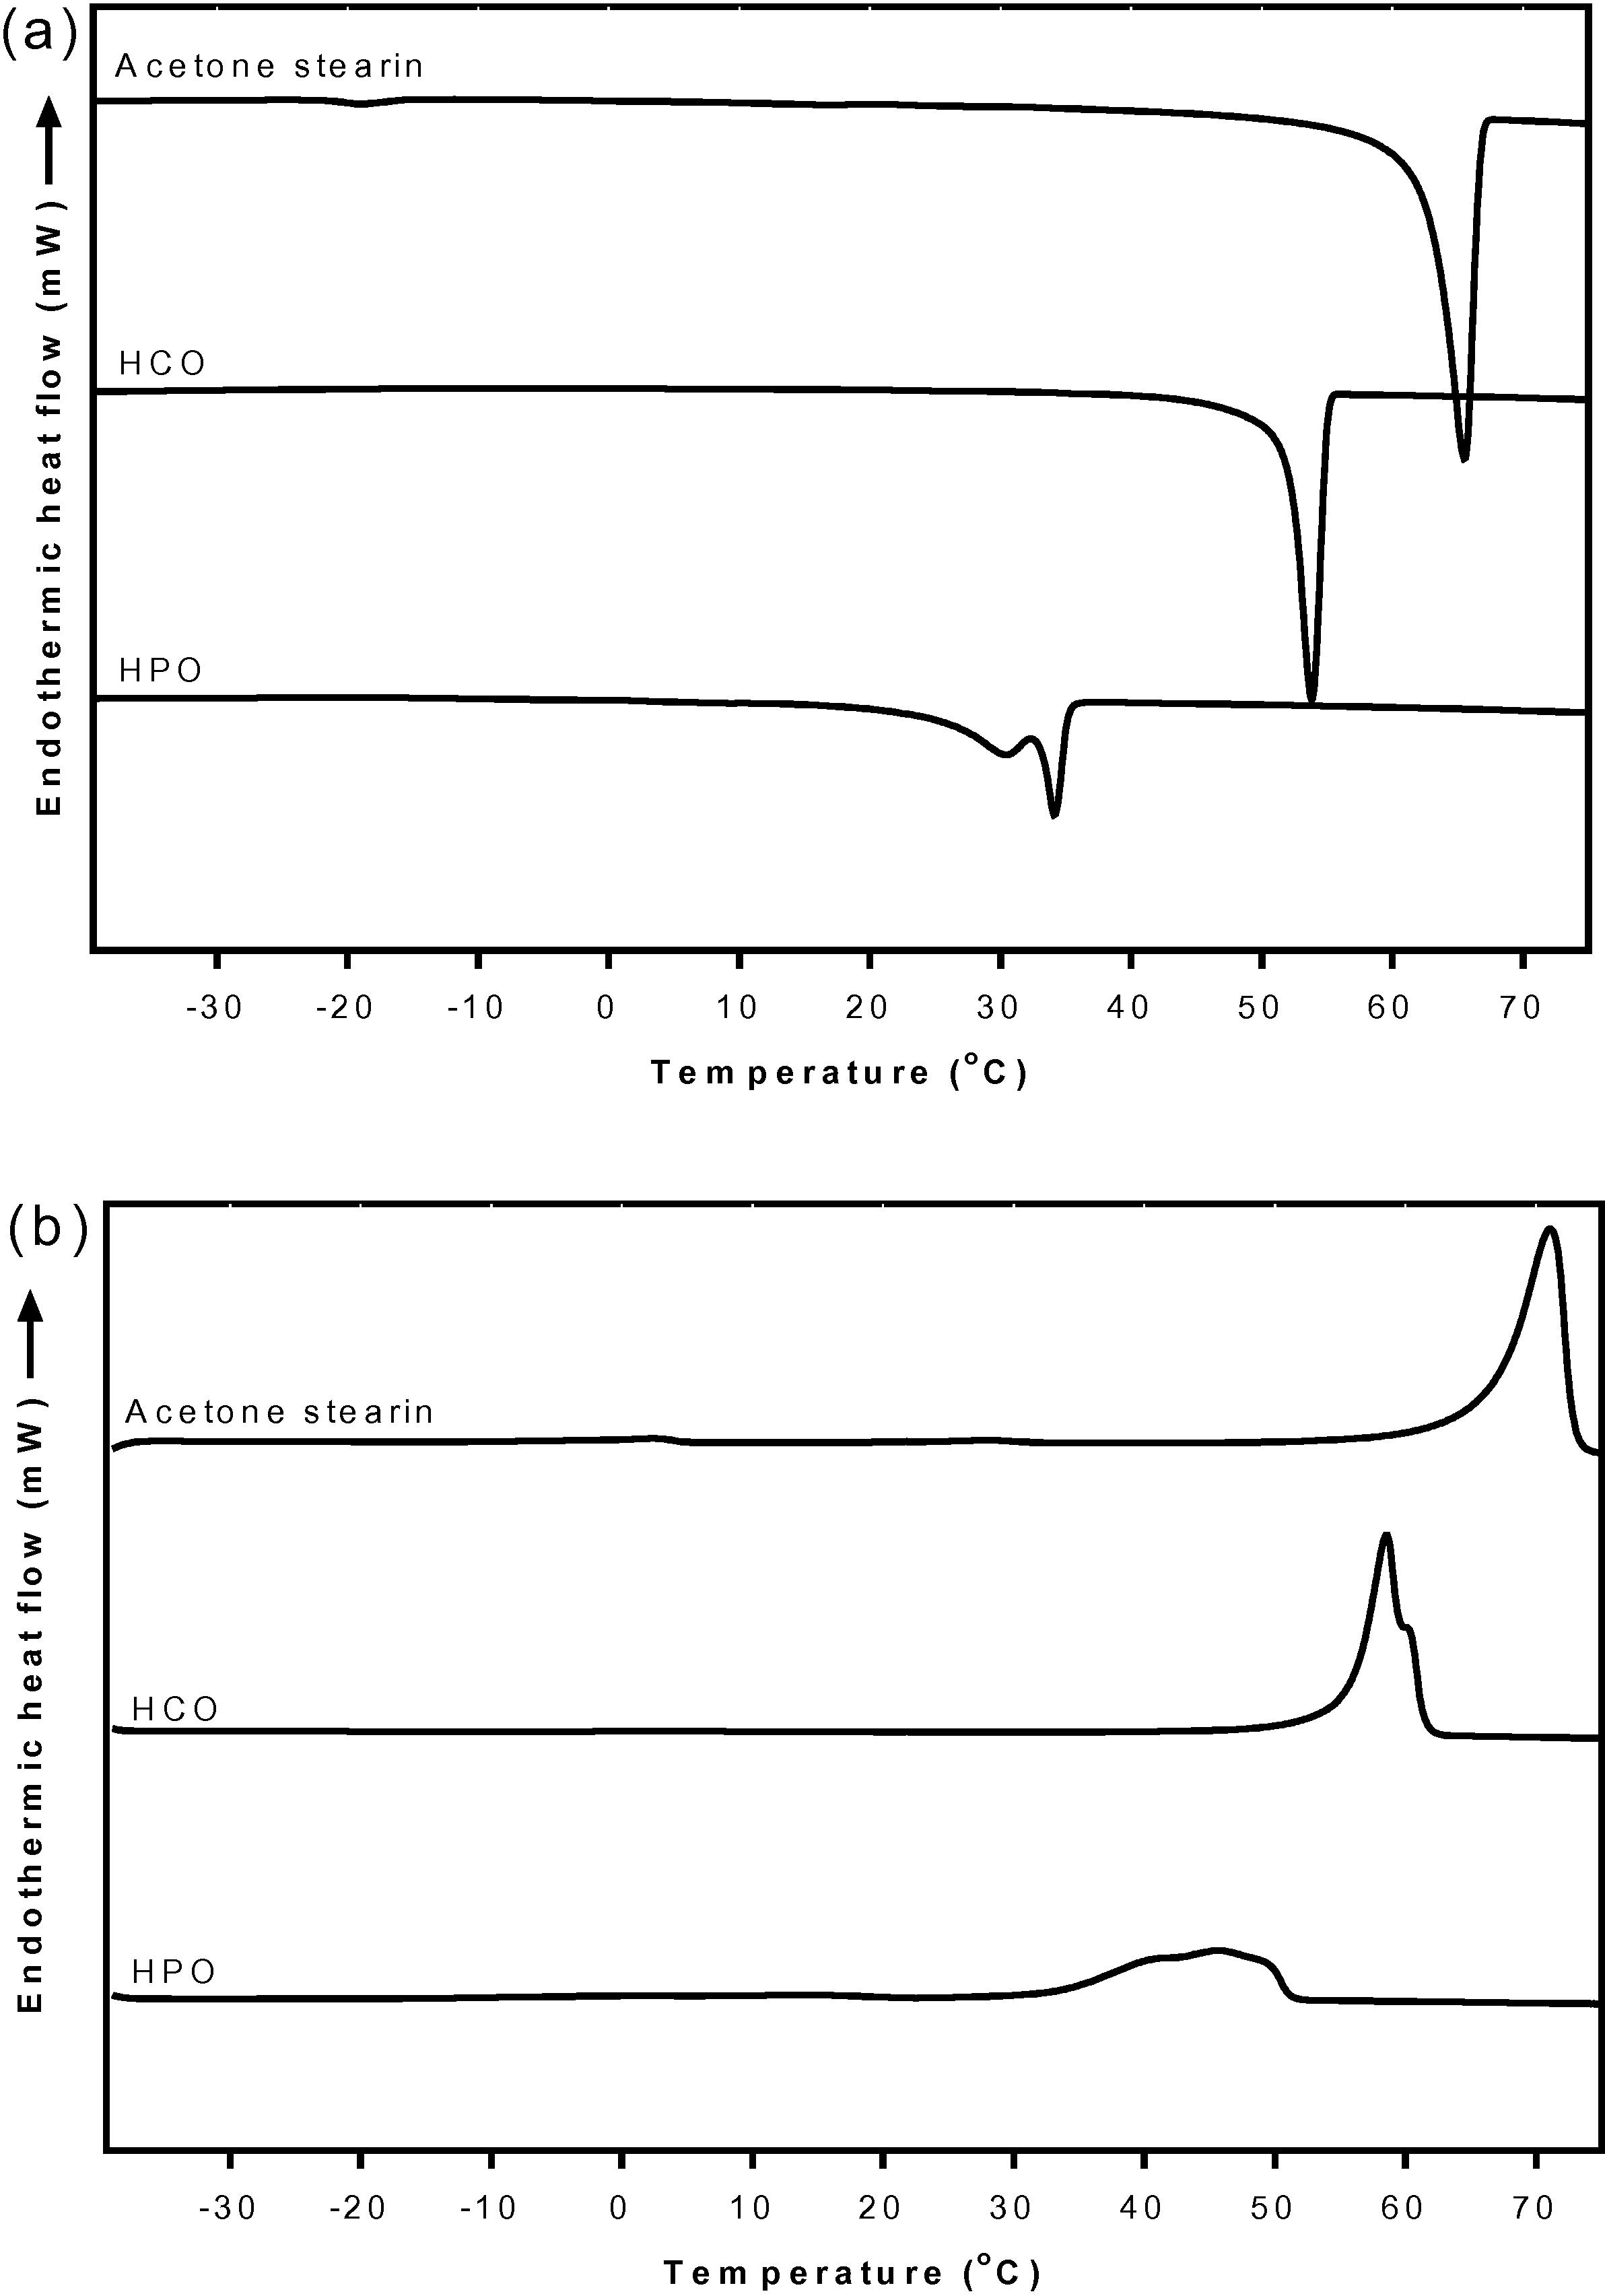
DSC crystallization curves (a) and melting curves (b) of rambutan kernel stearin fractions from acetone fractionation, HCO and HPO. HCO, fully hydrogenation canola oil; HPO, hydrogenated palm oil.
The SFI (Fig. 9) showed that the RKF stearin had more than 90% solid fat at temperatures lower than 56 °C and the solid fat was quickly reduced between 55 and 76 °C, while HCO had more than 95% solid fat at temperatures lower than 48 °C and the solid fat was sharply reduced between 45 and 63 °C. HPO has more than 85% solid fat at temperatures lower than 30 °C and the solid fat was absolutely reduced between 30 and 52 °C which was a wider range than for RKF stearin and HCO, respectively. The fat with a narrow plastic range at a temperature higher than room temperature would be brittle and hard at room temperature and still stable at a body temperature (Weiss, 1983). HCO has been reported as an additive for fat-based products to prevent filling out from the fat phase and as a crystal promoter in compound chocolate, etc. (de Oliveira et al., 2015). Our results may indicate that RKF stearin fractionated by acetone at 25 °C for 24 h has potential to be used in various products as well as HCO by the use of lower amount or mixed with other fat or oil fractions before use.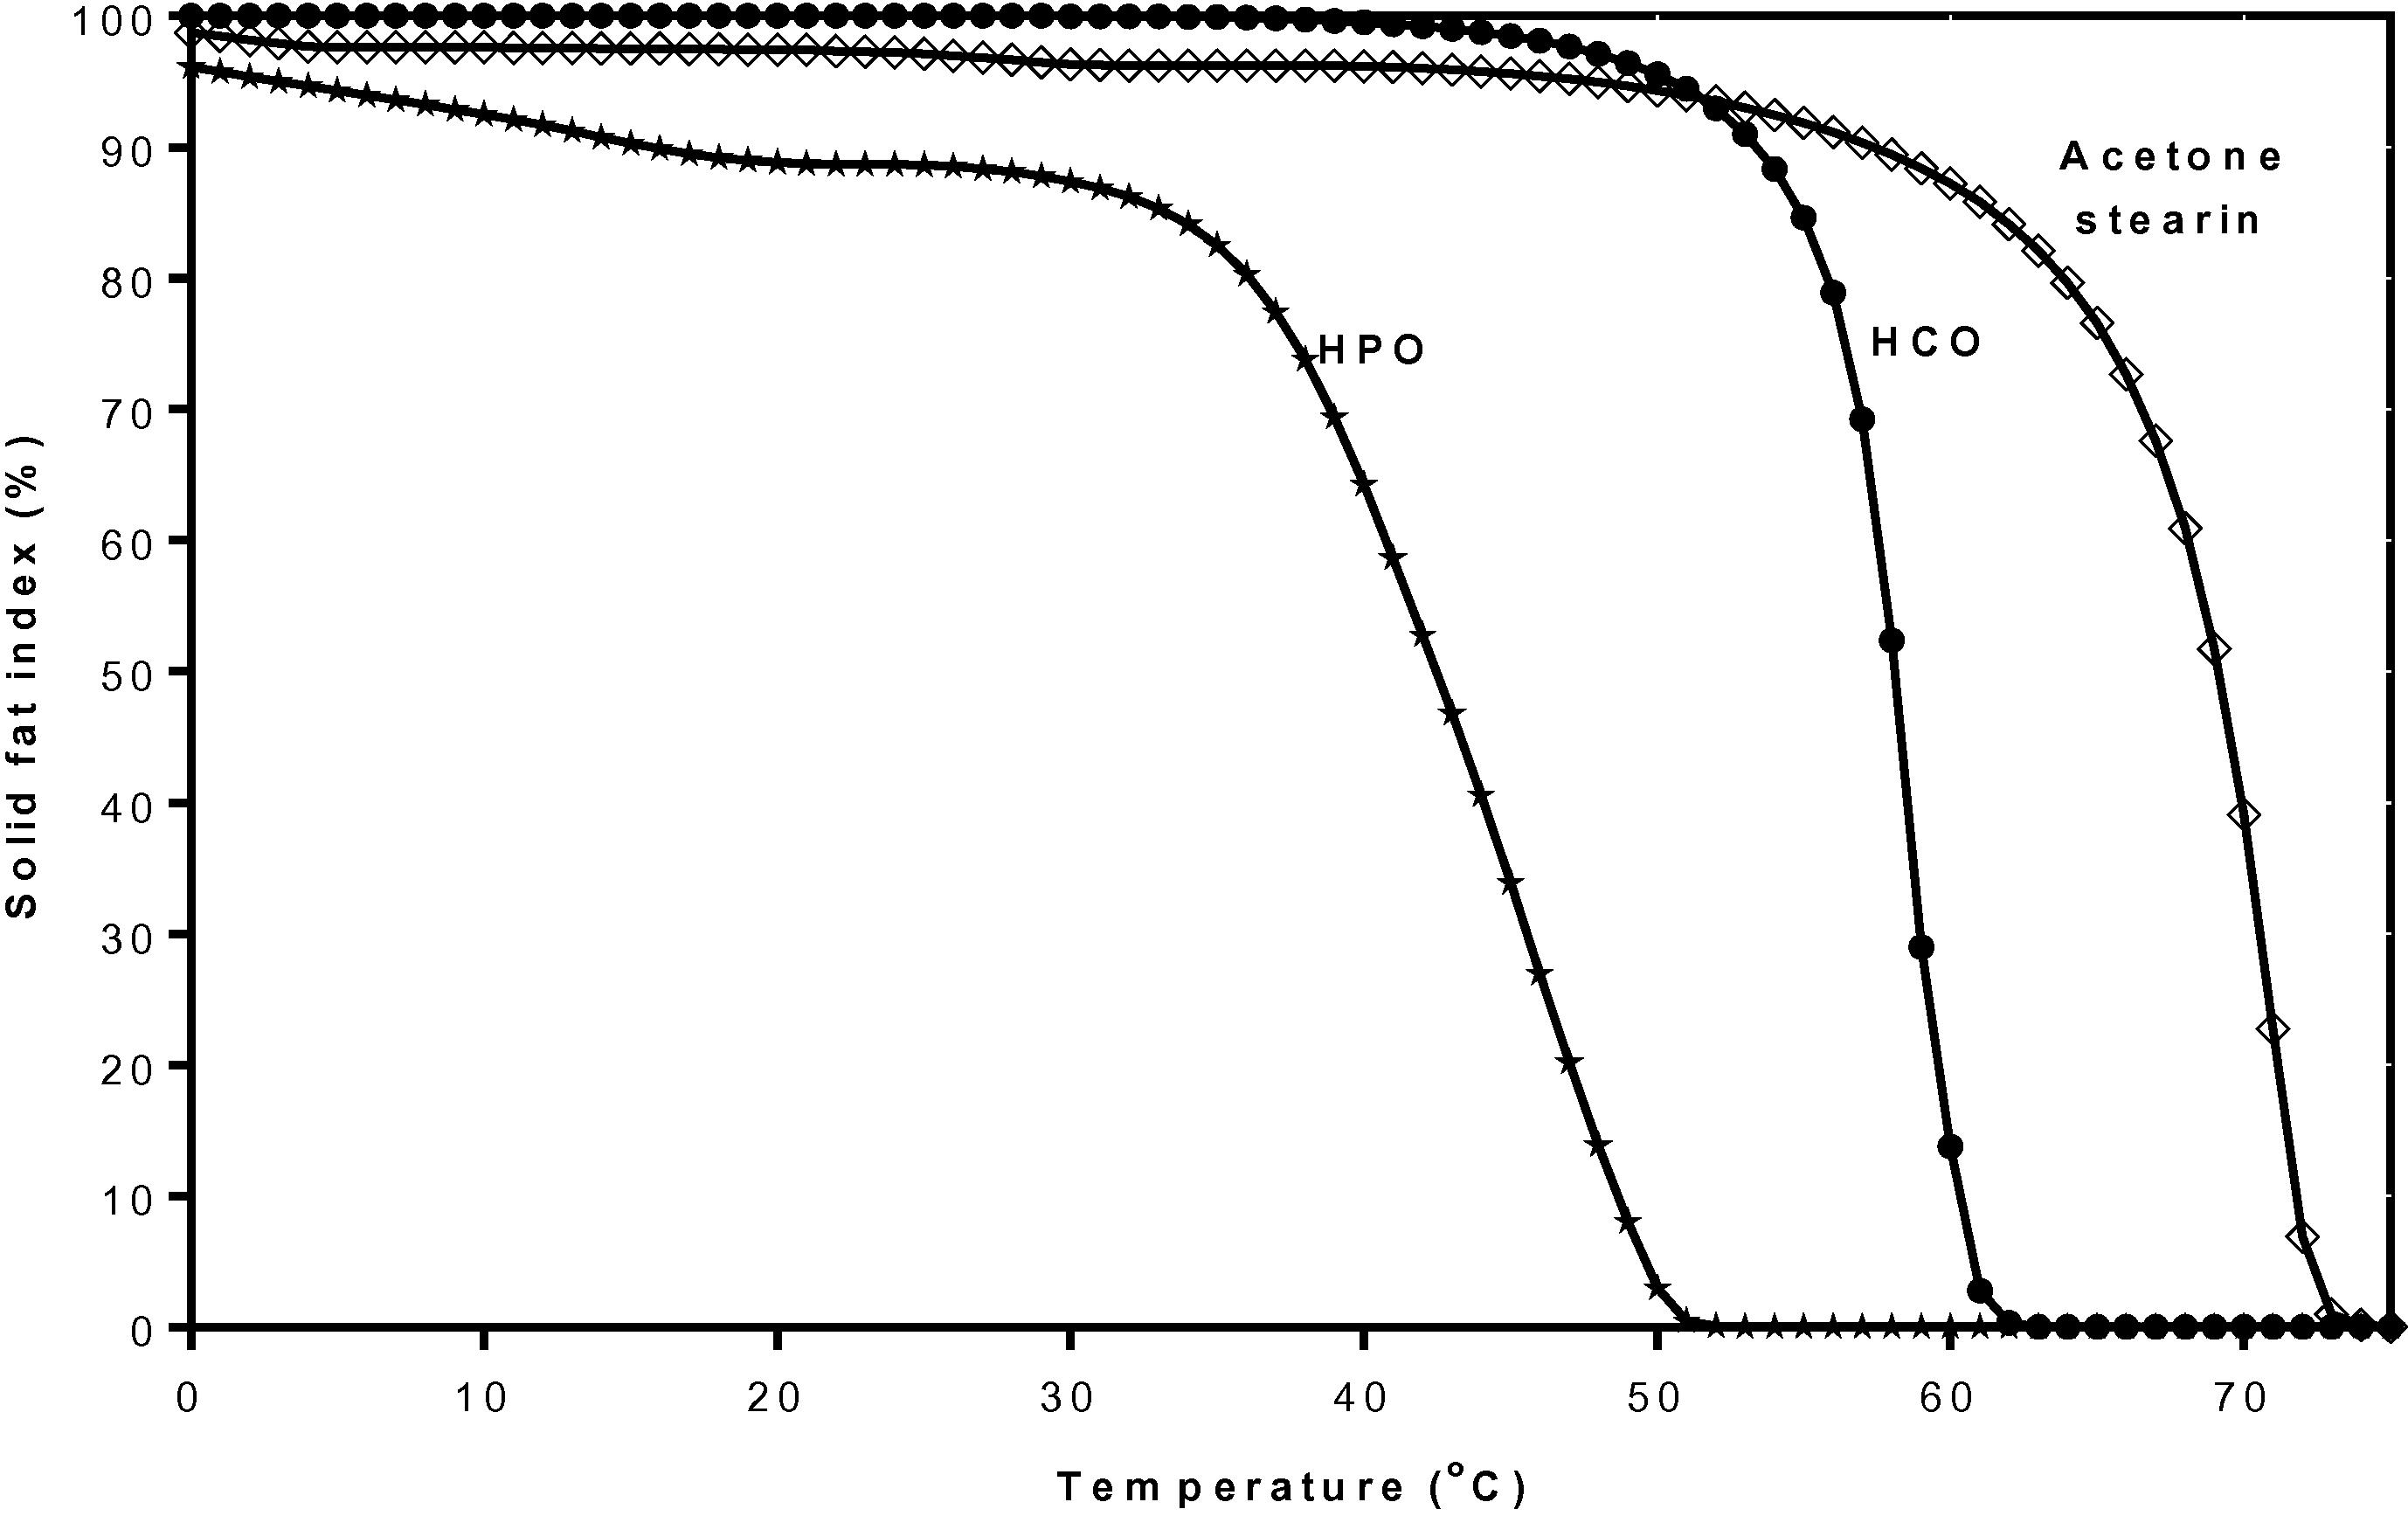
Solid fat index (%) curves at various temperatures of rambutan kernel stearin fraction from acetone fractionation, HCO and HPO. HCO, fully hydrogenation canola oil; HPO, hydrogenated palm oil.
4 Conclusion
RKF could be fractionated into low- (olein) and high-melting fractions (stearin). The fractionation time and the solvent type used affected the physical and chemical characteristics of the fat fractions. The RKF stearin or solid fat fraction produced using acetone fractionation at 25 °C for 24 h has comparable thermal behavior and a SFI to commercial hydrogenated fat. Therefore, we suggest that this stearin fraction may have a potential for use in food products and also as commercial hydrogenated fat for uses such as; preparing hard stock in coating products, a crystal promoter in margarine and shortening and as an anti-blooming agent in compound chocolate. The application of the high melting stearin fraction from RKF in real food products and its effect on product’s properties (especially organoleptic ones) need further study.
Acknowledgments
The authors would like to acknowledge the Kasetsart University Research and Development Institute (KURDI) and the Graduate School Kasetsart University for funding this project. We are also grateful to Malee Sampran Public Company Limited (Nakornpathom, Thailand) for providing the rambutan kernel seed samples.
References
- Palm- based diacylglycerol fat dry fractionation: effect of crystallisation temperature, cooling rate and agitation speed on physical and chemical properties of fractions. Peer J. 2013
- [CrossRef] [Google Scholar]
- Egyptian mango by-product 1. Compositional quality of mango seed kernel. Food Chem.. 2007;103:1134-1140.
- [Google Scholar]
- Chemical and enzymatic interesterification of tristrearin/triolein-rich blends: Microstructure and polymorphism. Eur. J. Lipid Sci. Technol.. 2008;110:1025-1034.
- [Google Scholar]
- Official Methods and Recommended Practices of the American Oil Chemists’ Society (fifth ed.). Champaign, USA: American Oil Chemists’ Society; 1997.
- Hydrogenation theory. In: Applewhite T.H., ed. Proceeding of the World Conference on Oilseed Technology and Utilization. USA: AOCS Press; 1993. p. :166-172.
- [Google Scholar]
- Dry fractionation and crystallization kinetics of high-oleic high-stearic sunflower oil. J. Am. Oil. Chem. Soc.. 2011;88:1511-1519.
- [Google Scholar]
- Toxic effects of solvents and vapors. In: Klaassen C.D., ed. Cassarett and Doull’s Toxicology: The Basic Science of Poisons (sixth ed.). New York: McGraw-Hill; 2001. p. :763-810.
- [Google Scholar]
- Solubilities of palmitic acid in pure solvents and its mixtures. J. Chem. Eng. Data. 2009;54:64-68.
- [Google Scholar]
- Experimental methodology. In: Marangoni A.G., Wesdorp L.H., eds. Structure and Properties of Fat Crystal Networks (second ed.). Boca Raton, FL, USA: CRC Press; 2013. p. :419-489.
- [Google Scholar]
- Detrimental impact of trans fats on human health: stearic acid-rich fats as possible substitutes. Compr. Rev. Food Sci. F.. 2008;7:271-279.
- [Google Scholar]
- Short spacings and polymorphic forms of natural and commercial solid fats: a review. J. Am. Oil Chem. Soc.. 1990;67:835-843.
- [Google Scholar]
- Blending of hydrogenated low-erucic acid rapeseed oil, low-erucic acid rapeseed oil, and hydrogenated palm oil or palm oil in the preparation of shortenings. J. Am. Oil Chem. Soc.. 2003;80:1069-1075.
- [Google Scholar]
- Polymorphic behavior of some fully hydrogenated oils and their mixtures with liquid oil. J. Am. Oil Chem. Soc.. 1989;66:1777-1780.
- [Google Scholar]
- Development of zero trans/low sat fat systems structured with sorbitan monostearate and fully hydrogenated canola oil. Eur. J. Lipid Sci. Technol.. 2015;117:1762-1771.
- [Google Scholar]
- Toxicity studies on rambutan (Nephelium lappaceum) seed fat and oil extracts using acute oral, dermal and irritation assays. Int. J. Nat. Prod. Res.. 2014;4:36-39.
- [Google Scholar]
- Chemical and thermal characteristics of buffalo butter oil fractions obtained by multi-step dry fractionation. LWT Food Sci. Tech.. 2005;36:483-496.
- [Google Scholar]
- Comparison between ethanol and hexane for oil extraction from Quercus suber L. fruits. Grasasy Aceites. 2003;54:378-383.
- [Google Scholar]
- Solubilities of the fatty acids in organic solvents at low temperatures. Oil Soap. 1944;21:183-187.
- [Google Scholar]
- Current advances in sunflower oil and its applications. Lipid Technol.. 2009;21:79-82.
- [Google Scholar]
- Physical, chemical and fuel related properties of tomato seed oil for evaluating its direct use in Diesel engines. Ind. Crop. Prod.. 2005;22:193-199.
- [Google Scholar]
- Fractionation of lipids for use in food. In: Gunstone F.D., ed. Modifying Lipids for Use in Food. England: CRC Press; 2006. p. :201-233.
- [Google Scholar]
- Effect of hydrogenated and saturated, relative to polyunsaturated, fat on immune and inflammatory responses of adults with moderate hypercholesterolemia. J. Lipid Res.. 2002;43:445-452.
- [Google Scholar]
- Physicochemical and nutritional composition of rambutan anak sekolah (Nephelium lappaceum L.) seed and seed oil. Pak. J. Nutr.. 2012;10:1073-1077.
- [Google Scholar]
- Harris, J., 2011. Edible Oil Processing – Solvent Fractionation. The AOCS Lipid Library. Available source: <http://lipidlibrary.aocs.org/processing/solventfract/index.htm>, July 10, 2013.
- Effect of processing conditions on physical properties of a milk fat model system: microstructure. J. Am. Oil. Chem. Soc.. 2000;77:1197-1205.
- [Google Scholar]
- Fractionation of fat. In: Marangoni A.G., Narine S.S., eds. Physical Properties of Lipid. New York: Marcel Dekker; 2002. p. :411-448.
- [Google Scholar]
- Fractionation of trans from partially hydrogenated soybean oil fatty acids. J. Food Res.. 2012;1:157-164.
- [Google Scholar]
- Use of aqueous HCI/MeOH as esterification reagent for analysis of fatty acids derived from soybean lipids. J. Am. Oil Chem. Soc.. 1982;59:132-133.
- [Google Scholar]
- Selective enrichment of symmetric monounsaturated triacylglycerols from palm stearin by double solvent fractionation. LWT Food Sci. Tech.. 2013;51:242-252.
- [Google Scholar]
- The negative effects of hydrogenated trans fats and what to do about them. Atherosclerosis. 2009;205:458-465.
- [Google Scholar]
- Iso-solid diagrams of fat blends from thermal analysis data. J. Am. Oil Chem. Soc.. 1983;60:845-847.
- [Google Scholar]
- Crystallization and polymorphism of fats. In: Akoh C.C., Min D.B., eds. Food Lipids: Chemistry, Nutrition, and Biotechnology (third ed.). New York: CRC Press; 2008. p. :245-266.
- [Google Scholar]
- Effects of different forms of dietary hydrogenated fats on serum lipoprotein cholesterol levels. N. Engl. J. Med.. 1999;340:1933-1940.
- [Google Scholar]
- Fat bloom in chocolate and compound coatings. Eur. J. Lipid Sci. Technol.. 2004;106:241-274.
- [Google Scholar]
- Physico-chemical charaterisation of the fat from red-skin rambutan (Nephellium lappaceum L.) Seed. J. Oleo Sci.. 2013;62:335-343.
- [Google Scholar]
- Effect of fractional crystallization on composition and thermal behavior of coconut oil. Int. J. Food Prop.. 2013;16:1284-1292.
- [Google Scholar]
- Structure and properties of fat crystal networks. In: Gunstone F.D., ed. Modifying Lipids for Use in Food. England: Woodhead Publishing Limited; 2006. p. :142-169.
- [Google Scholar]
- Thermal analysis of palm mid-fraction, cocoa butter and milk fat blends by differential scanning calorimetry. J. Am. Oil. Chem. Soc.. 1994;71:299-302.
- [Google Scholar]
- Metin, S., Hartel, R.W., 2005. Crystallization of fats and oils, in: Shahidi, F. (Ed.), Bailey’s Industrial Oil and Fat Products, sixth ed., vol. 6. Wiley, London, <http://onlinelibrary.wiley.com/doi/10.1002/047167849X.bio021/full>.
- Characterization and thermal stability of polymorphic forms of synthesized tristearin. Food Chem. Toxicol.. 2002;67:2911-2917.
- [Google Scholar]
- Crystallisation and rheological properties of hydrogenated palm oil and palm oil blends in relation to crystal networking. Eur. J. Lipid Sci. Technol.. 2005;107:634-640.
- [Google Scholar]
- Tropical vegetables fats and butters: properties and new alternatives. OCL-Ol. Corps. Gras. Li.. 2009;16:254-258.
- [Google Scholar]
- Response surface optimization and characteristics of rambutan (Nephelium lappaceum L.) kernel fat by hexane extraction. LWT Food Sci. Technol.. 2011;44:1946-1951.
- [Google Scholar]
- Composition, phase behavior and thermal stability of natural edible fat from rambutan (Nephelium lappaceum L.) seed. Bioresour. Technol.. 2010;101:799-803.
- [Google Scholar]
- Characterization of physicochemical and thermal properties and crystallization behavior of krabok (Irvingia Malayana) and rambutan seed fats. J. Oleo Sci.. 2012;61:671-679.
- [Google Scholar]
- Stearic acid: a possible substitute for trans fatty acids from industrial origin. Grasas Aceites. 2011;62:131-138.
- [Google Scholar]
- Food Oil and Their Uses (second ed.). USA: AVI Publishing Company; 1983. p. :121-139.
- Relations between crystallisation mechanisms and microstructure of milk fat. Int. Dairy J.. 2009;19:424-430.
- [Google Scholar]
- Crystallization properties of palm oil by dry fractionation. Food Chem.. 2004;86:245-250.
- [Google Scholar]
- Comparative analysis of thermal behavior, isothermal crystallization kinetics and polymorphism of palm oil fractions. Molecules. 2013;18:1036-1052.
- [Google Scholar]
Appendix A
Supplementary data
Supplementary data associated with this article can be found, in the online version, at http://dx.doi.org/10.1016/j.jksus.2016.08.004.
Appendix A
Supplementary data


