Translate this page into:
Biosorption of Cu2+ by Eichhornia crassipes: Physicochemical characterization, biosorption modeling and mechanism
*Corresponding author. Tel.: +20 93 4601949/2546; fax: +20 93 4601159 wael.abdelrehem@science.sohag.edu.eg (Wael H. Abdelraheem) wello17_5@yahoo.com (Wael H. Abdelraheem)
-
Received: ,
Accepted: ,
This article was originally published by Elsevier and was migrated to Scientific Scholar after the change of Publisher.
Available online 24 April 2012
Peer review under responsibility of King Saud University.
Abstract
This work presents the biosorption potential Eichhornia crassipes biomass, collected from the Nile water, for removing Cu(II) ions. Physicochemical characteristics, proton and Cu2+ binding constants, and biosorption isotherms were studied. The biomass contains 43.3 mg g−1 protein, 40.76 mg g−1 carbohydrates and 16 types of amino acids. The biomass has large surface area (4.16 m2 g−1) and pore size (35.93 Å). Proton bindings (pKH1 = 1.8; pKH2 = 1.9; pKH3 = 2.0) and Cu2+ binding constants (pKM1 = 4.37; pKM2 = 4.24; pKM3 = 3.76) were calculated by Non-Ideal Competitive Absorption (NICA) model. FT-IR results suggested that —OH, —COOH and —P⚌O sites are mainly responsible for Cu2+ biosorption. Biosorption isotherms were successfully fitted by two Langmuir linearization models. The biosorption mechanism includes ionization and complexation stages. The biomass shows a breakthrough ability for Cu2+ biosorption (qmax = 27.7 mg g−1) and at pH 4.5.
Keywords
Biosorption
Eichhornia crassipes
Acidic site
Modeling
Binding constants
1 Introduction
Copper is one of the most common pollutants found in industrial effluents. Even at low concentrations, it is toxic to organisms like humans. For instance, the extreme consumption of copper leads to gastrointestinal problems, kidney damage and anemia and lung cancer (Richard and Shuttleworth, 1996). In addition, it is toxic in its ionic form at concentrations above 5 mg L−1 (Gagneten and Vila, 2001). For these reasons, the US-EPA and WHO organizations have recommended copper concentration in drinking waters not to exceed 1.3 ppm (Wang, 2002).
New technologies are necessary to reduce the concentration of heavy metals in the environment into acceptable levels. Biosorption, the process of capturing metal ions by the living or dead biomass, has a great potential to reach this object (Wilde and Benemann, 1993). The discovery and development of biosorption is the base of a new technology for the removal of heavy metals from dilute solutions (1–100 mg L−1) (Chong and Volesky, 1995).
Compared to traditional technologies, biosorption has many advantages such as the high purity of treated waste-water and the use of cheap raw material as biosorbent. For instances, Rao et al. (2010) have effectively used a medicinal herb (Foeniculum vulgari) from India for the removal of Cd2+ from wastewaters. Oliveira et al. (2011) have studied the potential of using Sargassum biomass from Brazil as a biosorbent for Sm (III) and Pr (III) from synthetic solutions and the results were promising for using it as a biosorbent. A successful accumulation of chromium from polluted water has been studied by using Eichhornia crassipes (E. crassipes) from India as a biosorbent (Mohanty et al., 2006).
Dead aquatic plants are able to remove heavy metal ions from aqueous solutions. Metal ion uptake by biomass is believed to occur through interactions with functional groups that are native to the proteins, lipids and carbohydrates that make up the cell wall (Mohanty et al., 2006). To maximize the efficiency of the dead biomass, the identity of the functional groups responsible for metal binding is very important. The information obtained from these determinations is useful for future attempts to enhance the adsorption capacity to selectively adsorb specific metal ions. Moreover, the identity of the functional groups will be helpful for determining the mechanisms responsible for the binding of the targeted metal ions.
E. crassipes is water hyacinth, found in large amounts around the fields of irrigations and in the fresh water bodies through the year in tropical and subtropical countries including Egypt (Schneider et al., 1995). The potential of using E. crassipes as alive or a dead biomass to remove metal ions from solutions was recently investigated. The results showed that it is a promising cheap biosorbent source for metal ions (Schneider et al., 1995; Soltan and Rashed, 2003).
Little is known about the types and amounts of functional groups located on E. crassipes as well as proton and Cu2+ binding constants with E. crassipes (Schneider et al., 1995; Soltan and Rashed, 2003). Moreover, extensive researches have been done on the roots parts while little is known about leaves and stems. Therefore, the present work aims to investigate the physicochemical characteristics of the leaves and stems of E. crassipes biomass in their dead state that help studying their reactivity towards copper absorption at different pH’s and hence suggesting a mechanism for the biosorption process.
2 Materials and methods
2.1 Chemical reagents and preparation of solutions
All the chemical reagents are from Merck and BDH grade. Stock solutions of copper (1000 and 500 mg L−1) were prepared from Cu(NO3)2·3H2O in ultrapure water. A stock NaOH (0.3 M) solution was freshly prepared in deionized water. Stock solutions of 0.3 M and 0.1 M HNO3 were freshly prepared and standardized by NaOH standard solution (Komy et al., 2006). Periodic standardization for NaOH was made by using standard solution of 0.1 M oxalic acid. All solutions were kept in a refrigerator at 5 °C until measurements were undertaken.
A Milli-Q water purification system was used. All glassware were cleansed for 1 week in 1:1 HNO3, 1 week in 1:1 HCl and 1 week in ultrapure water to prevent any contaminations (Komy, 1993).
2.2 Sampling and preparation of biomass
The living biomass sample was collected from large floating masses in the River Nile at Sohag city (∼500 km from Cairo), Egypt. The leaves and stems parts of the plant were used in the present study to obtain the dead biomass. For removal of any sand and other trapped debris, the parts were washed with Nile, tap and ultrapure waters. The biomass was then freeze-dried, ground and sieved through 0.25 mm mesh sieve. The produced powder was washed in 0.001 M NaNO3 and three times in 0.01 M NaNO3 (Plette et al., 1995) and finally dried.
2.3 Physicochemical characteristics of natural sample
Biomass C, H, N and P analysis were made with a LECO CHN-600 analyzer model CHN-600. Jenway UV/Vis spectrophotometer model 6405 for quantification of total protein and carbohydrate in the biomass by using methods described by Lowery et al. (1951) and Hedge and Hofreiter (1962), respectively.
Surface area and pore size of the biomass were determined by standard BET assumption using N2-adsorption isotherm using a Nova surface analyzer model 2000 with a method described by Gregg and Sing (1982).
For qualitative/quantitative description of the amino acid content in the biomass, Eppendorf amino acid analyzer model IC-3000 was used. Shimadzu Infrared (FT-IR) spectrophotometer model 470 was used to investigate the functional groups on the biomass.
SEM photographs was used to describe the surface morphology of E. crassipes biomass before and after biosorption of Cu2+ while EDAX analysis were used as a primary fast test to identify the capability of biomass to accumulate Cu2+ on its surface. Therefore, EDAX analysis was performed for 30 mg of the dry biomass before and after the biosorption experiment (in a solution containing 3.7 mg L−1 of Cu2+ and maintained for 150 min of shaking).
2.4 Influence of pH and time on Cu2+ biosorption by E. crassipes
For estimation of the influence of pH on Cu2+ absorption, 300 mg of dried biomass was mixed with 148 μL of 500 mg L−1 Cu2+ (final concentration 3.7 mg L−1) in a set of 10 flasks at different pH’s (2.5–6.0) and completed to a total volume of 20 mL with NaNO3 (0.1 M). The flasks were then agitated for 3 h at 25 °C to reach equilibrium and centrifuged at 10,000 rpm for 20 min. The resulting supernatants were analyzed for the residual Cu2+ by atomic absorption spectrometry using Buck scientific AAS model 210 VGP (USA). The Cu2+ uptake at each pH was calculated using the following equation:
For estimation of the effect of equilibrium time on Cu2+ absorption, 300 mg of dried biomass was mixed with 148 μL of 500 mg L−1 Cu2+ (final concentration 3.7 mg L−1) in a set of six flasks at pH 4.5 and completed to a total volume of 20 mL with NaNO3 (0.1 M). Afterwards, the flasks were agitated at different time intervals (25–240 min) at 25 °C to attain the sorption equilibrium, centrifuged at 10,000 rpm and finally analyzed for the residual Cu2+ AAS as before. Again, the Cu2+ uptake at each pH was calculated using Eq. (1) and the overall experiment was repeated three times for precision.
2.5 Isothermal studies
For carrying out the isothermal study, 300 mg dried biomass was mixed with 20 mL NaNO3 (0.1 N) in 10 flasks at fixed pH 3.5. Then, Cu2+ was added increasingly to obtain a range of Cu2+ concentration from 2 to 25 mg L−1. The resulting mixtures were stirred for 3 h at 25 °C, centrifuged at 10,000 rpm and analyzed for the residual Cu2+ by AAS as before. This experiment was repeated at pH 4.5 and 5.5 for comparison.
Two Langmuir linearization models by Pardo et al. (2003) and Norton et al. (2004) were used to calculate the biosorption parameters at each pH.
Eqs. (2) and (3) have given their authors’ name for simplicity in the further discussion.
2.6 Proton binding and Cu2+binding constants
For determining the values of proton bindings (types, amounts and binding constants) of biomass, conductometric and potentiometric titrations were performed using a Jenway conductivity meter model 4320 and a Orion digital pH/mV meter model 701A, respectively. In the conductometric (potentiometric) titration, a suspension of 200 (500 mg) dried biomass in 200 mL NaNO3 (0.1 N) was titrated against HNO3 and NaOH solutions. For a good description of the acid–base properties, constant ionic strength (0.1 M NaNO3) was maintained during the titration (Benedetti et al., 1995).
It should be mentioned that the equivalent point in the conductometric titration is represented by an intersection of two straight lines (James and Parks, 1982). The amount of proton binding (NT, mol g−1) was calculated by summing up the two equivalent points in the NaOH and HNO3 titrations. While in the potentiometric titration, the total amount of proton binding (NT, mol g−1) was calculated from the difference between the total proton amounts in the presence and absence of biomass.
Non-Ideal Competitive Absorption model (NICA), a theoretical model, was used for quantitative description of the protonation behavior of E. crassipes surface:
For estimation of Cu2+ binding constants (stability constant of Cu-biomass system), 300 mg dry weight of biomass was mixed with 148 μL of 500 mg L−1 Cu2+ (final concentration 3.7 mg L−1) at different pH’s (2–6) and completed to a total volume of 20 mL with 0.1 M NaNO3. The suspensions were then shaken for 3 h at 25 °C, centrifuged at 10,000 rpm to exclude the biomass and analyzed for the residual Cu2+ in the supernatant using AAS technique.
For quantitative description of Cu2+ binding constants (KMi), a theoretical model (NICA) was used:
3 Results and discussion
3.1 Physicochemical characteristics of biomass
Table 1 shows the results of elemental analysis, total protein, carbohydrates, surface area and pore size for E. crassipes biomass.
Elemental content
% (g/g)
Major organic content
Element
%
Parameters
mg g−1
±sda
C
35.2
Total protein
43.30
±0.20
H
5.14
Carbohydrates
40.76
±0.24
N
3.83
P
0.98
Surface characteristics
EDAX analysis
% Cu
Surface area, SBET (m2 g−1 ± sd)
4.16
±0.11
Before biosorption
0.7
Pore size, rp (Å ± s.d.)
35.93
±0.27
After biosorption
1.54
The biomass shows a significant content of total protein and carbohydrates as well as the elemental analysis is illustrated in Table 1. This reflected that the biomass tissue has abundant function groups (—COOH, —NH2, —NH—, —OH, C⚌O, and ) that giving a primary anticipation for the biomass capability to react with the Cu2+ through chelation with those sites (Komy et al., 2006).
E. crassipes has a relative high surface area and pore size (4.16 m2 g−1 and 35.93 Å) what present an evidence for the great physical contact between the biomass surface and the Cu2+ ions in solutions and suggest the entrapment of the Cu2+ ions inside those large pores. The former results are comparable to those (4.56 m2 g−1 and 1.17 Å) of Pseudomonas biomass in a previous study (Komy et al., 2006).
Fig. 1 describes the scores (%) of amino acids in the biomass. Proline, Glutamic, Aspartic and Leucine acids represent the major (74%) group of amino acids in the biomass while, Histidine, Isoleucine and Methionine are minor (4.12%). The percent of Proline and Isoleucine in the present study was found to be slightly higher than those obtained for the same biomass studied by Ghabbour et al. (2004). This could be attributed to the difference in the biomass habitat where temperature, grazing and nutrients influence the chemical composition of the growing plant from region to another (Weaver, 1946). The above result ensures the abundance of certain chelating centers (—COOH and —NH2) in the biomass which are capable of capturing Cu2+ ions from aqueous solutions.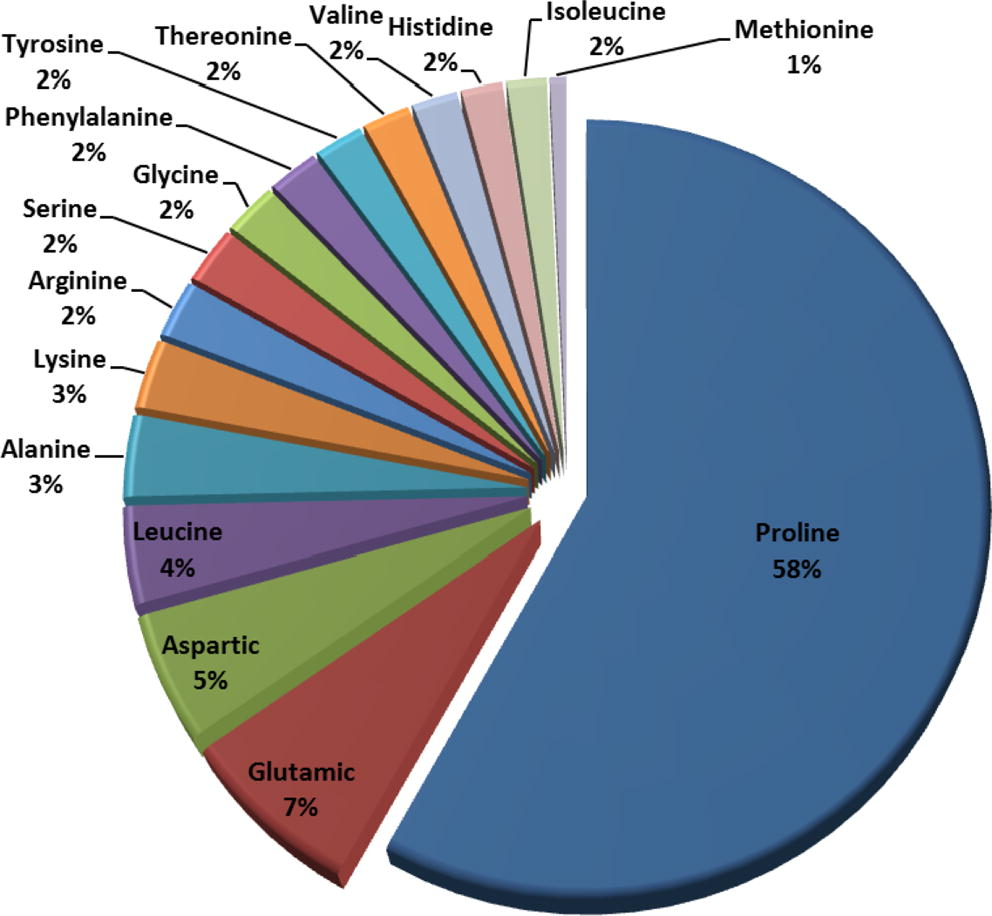
Percentages of amino acids in E. crassipes biomass (g individual amino acid/g total amino acids).
Figs. 2a and b describe the FT-IR spectra before and after Cu2+ (3.7 mg L−1) biosorption, respectively. Fig. 2a displays a number of absorption peaks indicating the complex nature of the examined biomass as follows; 3421.2 cm−1 (bonded, —OH and —NH), 2926.4 cm−1 and 600.9 cm−1 (C—H), 1252 cm−1 (P⚌O phosphonate or phosphoramide), 1061.9 cm−1 (C—O of aliphatic alcohol) and 1635.8 cm−1 (strong, asymmetric stretching of R—COO−, aromatic C⚌C, C⚌O in R—CHO, C⚌O of quinones or in conjugation with alkenes) (Yang et al., 2010). Fig. 2b shows a remarkable shift in FT-IR bands for some ionizable functional groups after the biosorption of Cu2+. Generally, all of the absorption bands (stretching) after biosorption of Cu2+ were shifted from their original positions. There are three obvious shifts (>15 cm−1) in the absorption bands of O—H bending from 1384.1 to 1402.4 cm−1, P⚌O stretching from 1252 to 1274 cm−1 and in the absorption band of O—C stretching from 1061.9 to 1078.3 cm−1. This result is an indication of the biosorption process. Similar results of –OH and –C⚌O groups were obtained in a previous study on the same biomass collected from China (Zhou et al., 2011). Moreover, a previous study on Cr6+ biosorption by E. crassipes, collected from India, revealed a shift in the absorption band of —OH group after biosorption process (Mohanty et al., 2006). This suggests that —OH group is a main constituent in E. crassipes samples around the world and acts as a major chelating center in the plant material.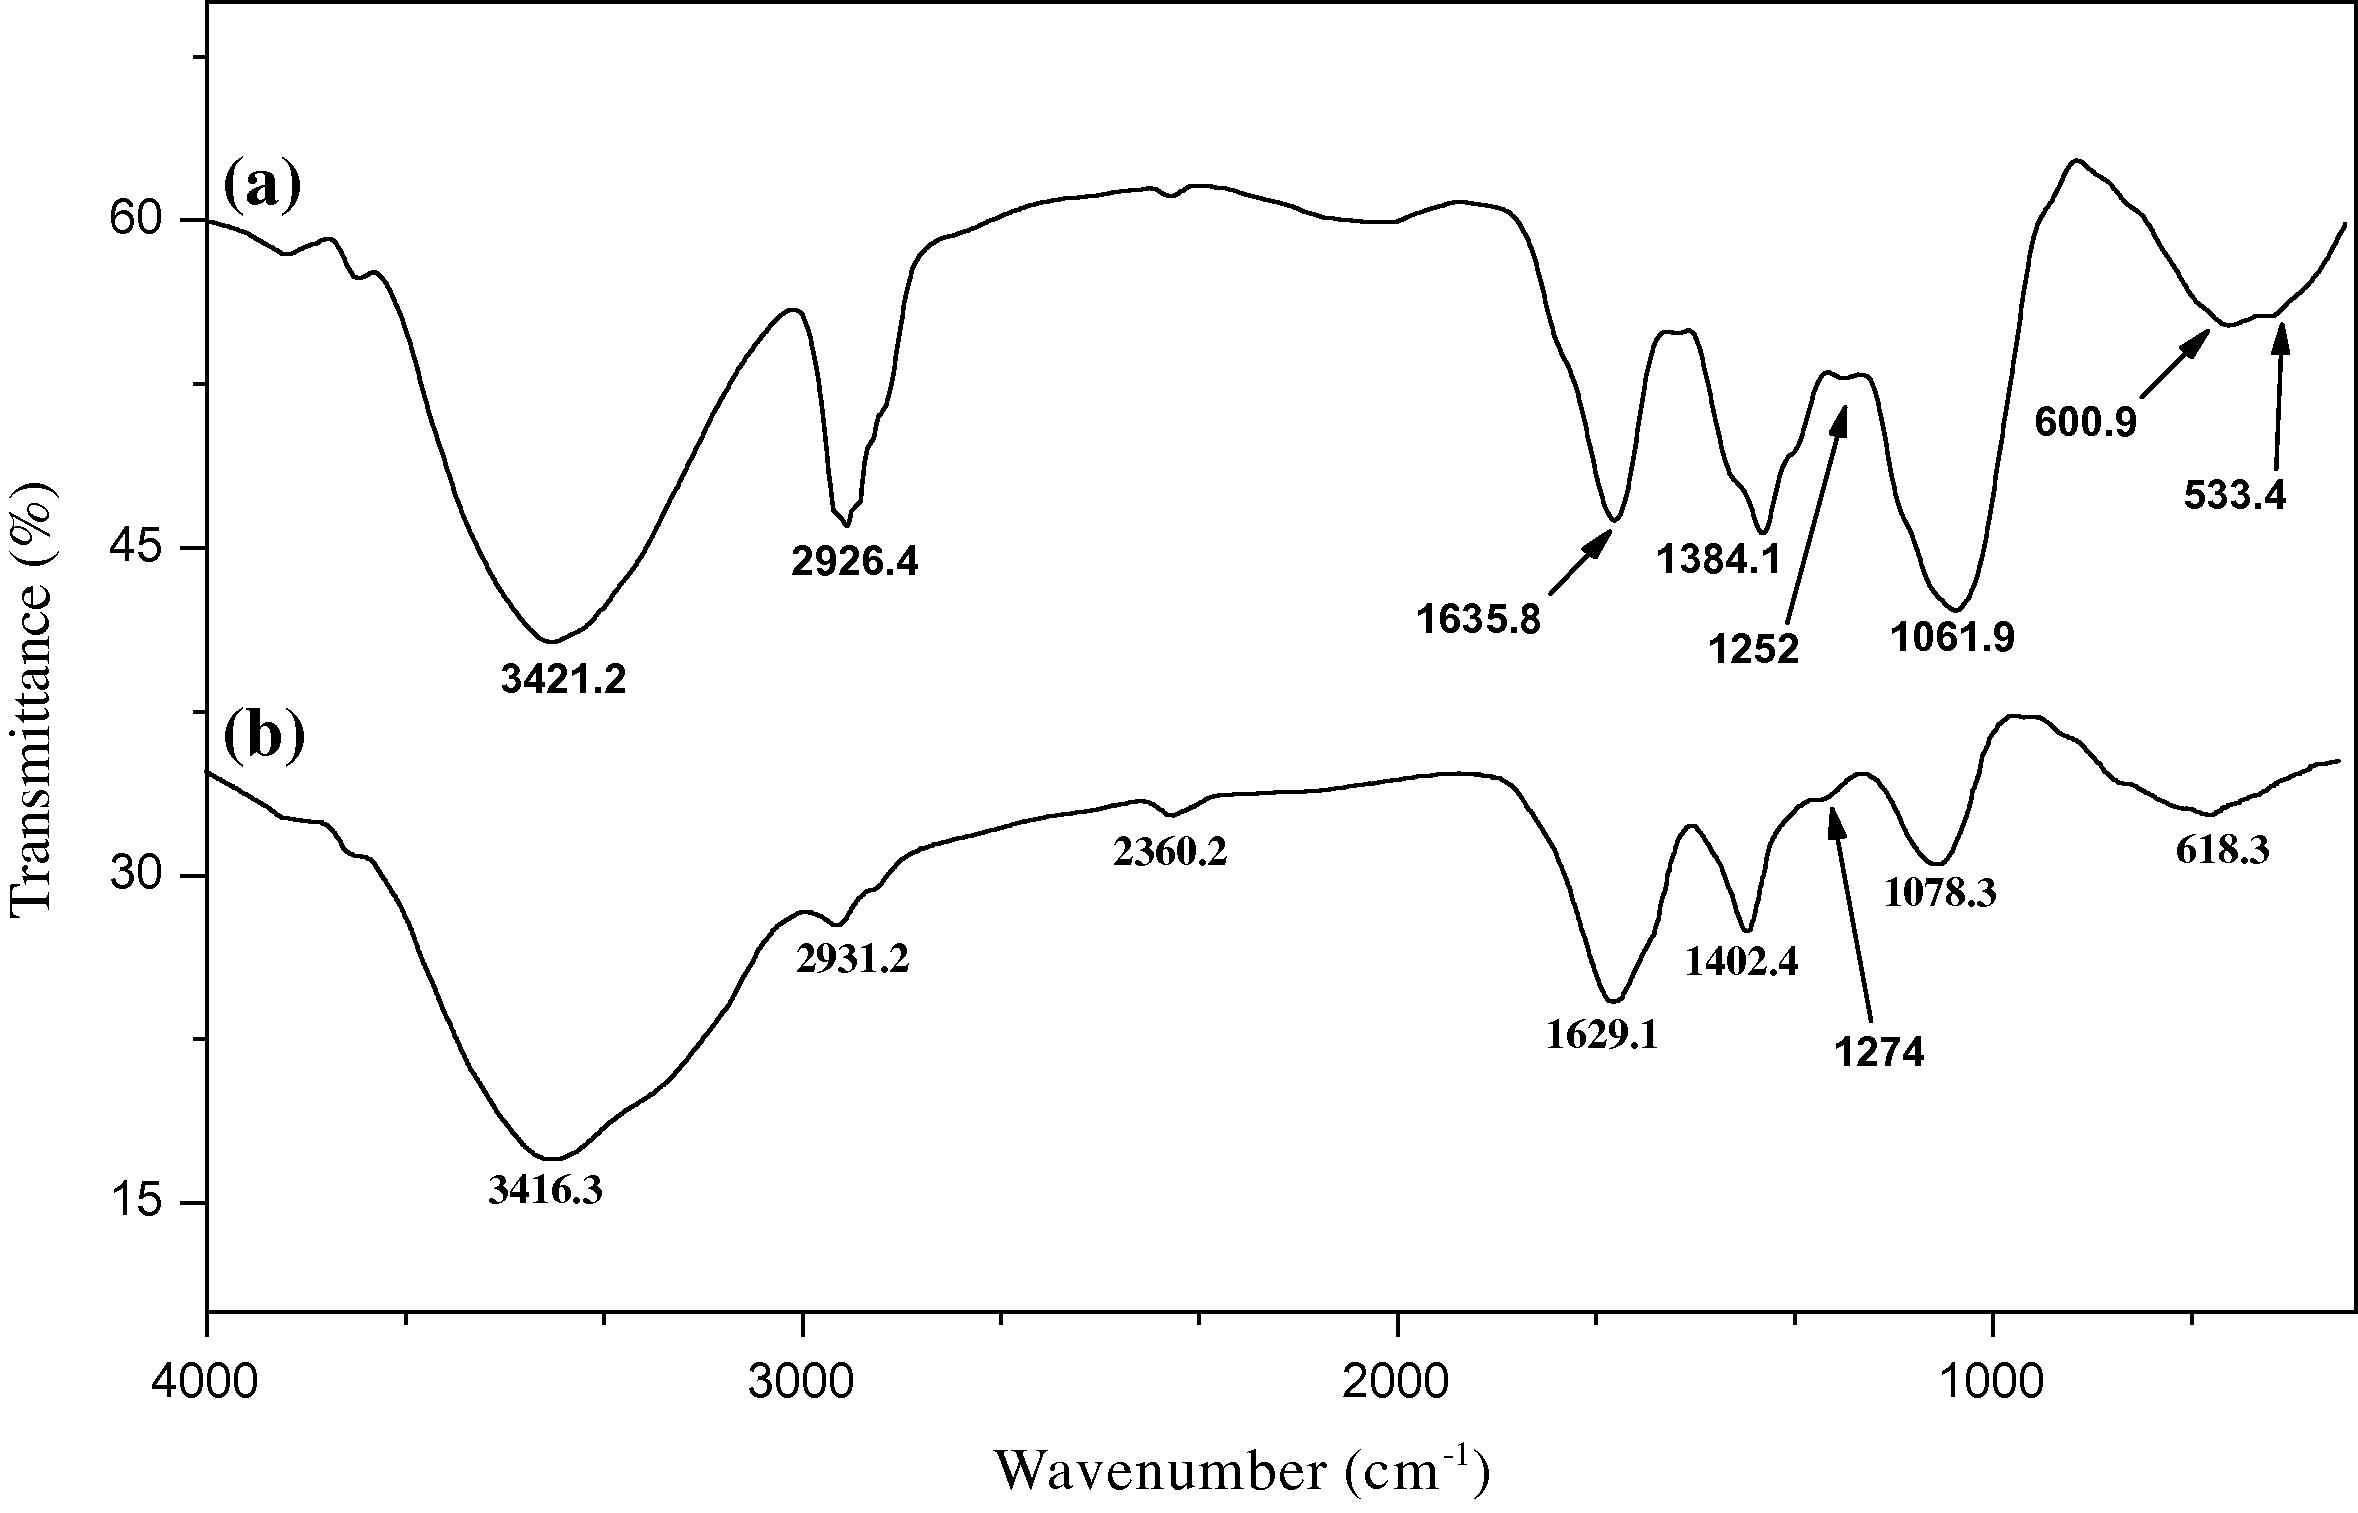
Infrared spectrum of dry E. crassipes biomass (a: before biosorption and b: after biosorption of 3.7 mg L−1 Cu2+ by 300 mg dry biomass).
SEM photographs in Fig. 3a and b are describing the surface morphology of E. crassipes biomass before and after biosorption of Cu2+, respectively. Fig. 3a indicates that the untreated biomass is characterized with a hollow structure. A similar SEM result was observed in Brazil by Schneider et al. (1995). Fig. 3b shows that Cu2+ ions possess sphere and needle shapes with domination of the latter and uniformly distributed over the surface of biomass. Moreover, the uptake of Cu2+ in the pores was appeared to be higher than the in rest of biomass surface (Fig. 3b, intrinsic image).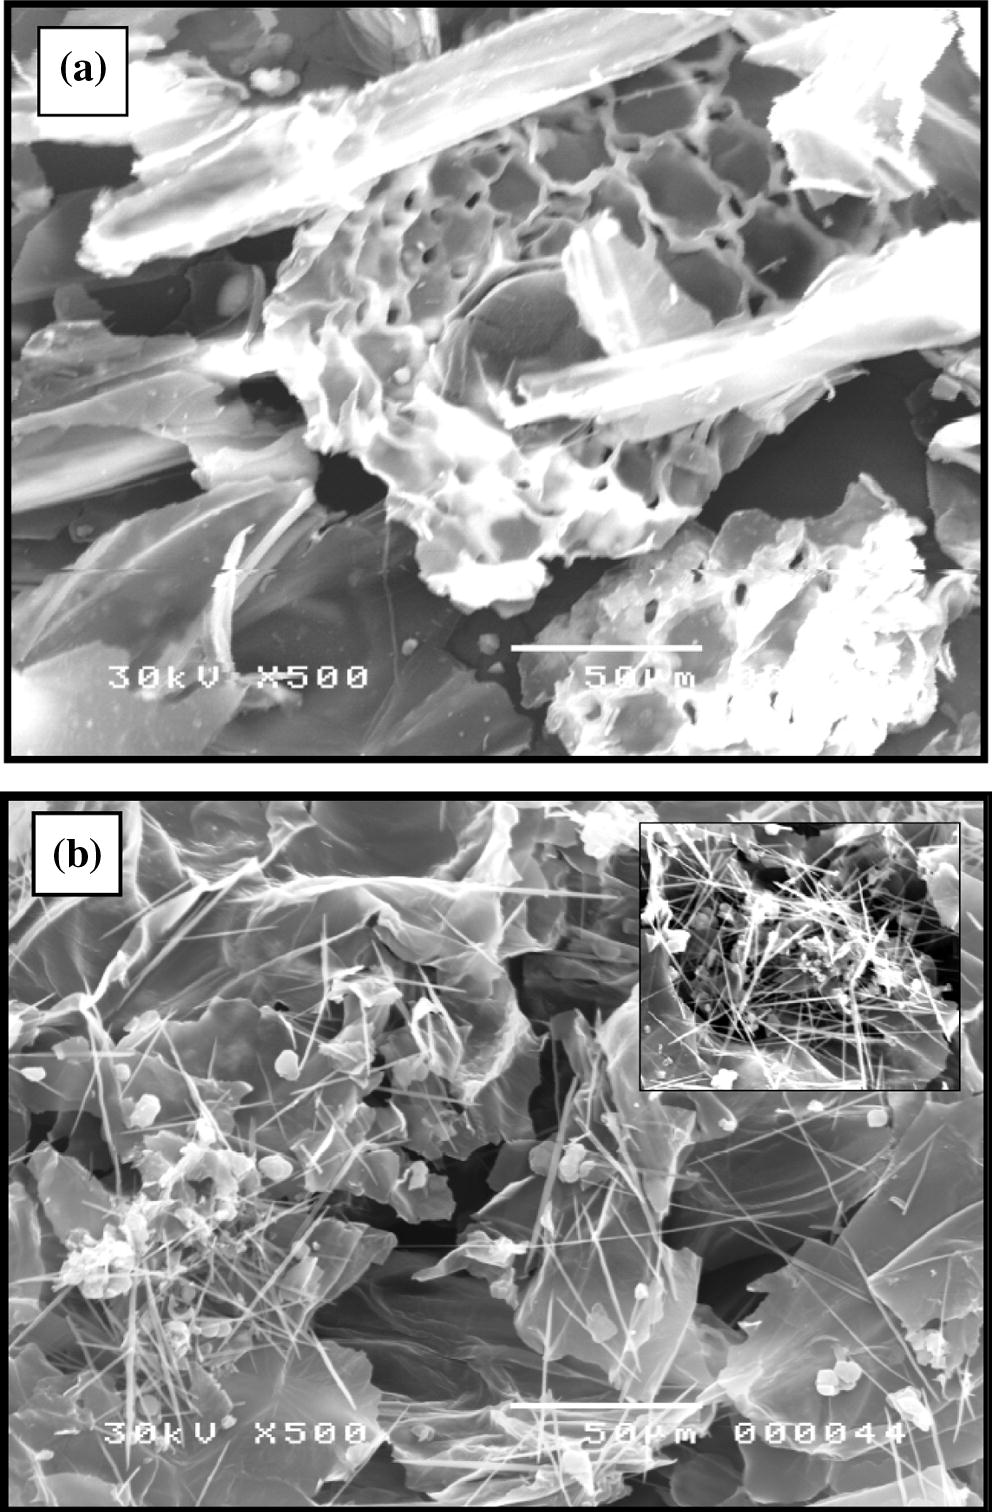
Scanning electron microscope images of E. crassipes biomass (a: before biosorption and b: after biosorption of 3.7 mg L−1 Cu2+ by 300 mg dry biomass).
According to EDAX analysis result, Table 1, shows that the biomass contains a natural amount of Cu representing 0.7% of its dry weight and it should be absorbed during the plant’s life (Omanayi et al., 2011). This quite higher value of naturally adsorbed Cu might corresponds to the high contamination of Nile water with Cu2+. After biosorption process, Cu2+ amount in the biomass surface increased to 1.54% that is mainly attributed to the biosorption process (Iqbal et al., 2009). These results match with the FT-IR results, which exhibit significant shifts in the bands of —OH, —P⚌O and C⚌O groups due to Cu2+ complexation.
Accordingly, the above results of biomass characteristics suggest the heterogeneity of biomass surface and its variable chemical content with the presence of mainly three (—OH, COO−, and —P⚌O) acidic sites on the biomass responsible for the Cu2+ biosorption.
3.2 Influence of pH and time on Cu2+ biosorption by E. crassipes
3.2.1 Influence of pH
Fig. 4a illustrates the influence of pH (2.5–6.0) on the absorption of Cu2+ onto surface of E. crassipes. It was observed that with increasing the pH from 2.5 to 3.25, a rapid increase in the Cu2+ uptake by the biomass took place. This is probably due to additional active sites are introduced to copper biosorption within this pH range. On increasing the pH from 3.25 to 5.5, a slight decrease in the Cu2+ uptake was observed. At pH > 5.5, the absorption of Cu2+ decreases rapidly due to the formation of hydroxylated complexes of Cu2+. This finding suggests that the amount of Cu2+ uptake is dependent on the pH value. As a result, the optimum pH range for Cu2+ biosorption is 3.25–5.5. Likely, Schneider et al., (1995) stated that optimum pH range of Cu2+ uptake by E. crassipes biomass was between 5.0 and 6.6. This variation might be attributed to the difference in the chemical composition of the two biomasses. Thus, the pH dependence of Cu2+ uptake is related to solution chemistry and functional groups of the biomass. In this respect, Sheng et al., (2004) indicated that all Cu2+ species in all biosystems exist in the ionic form at pH < 4.0. Subsequently, the increase in Cu2+ uptake by the biomass in the present study at pH 2.5–3.25 cannot be explained on the base of change in metal speciation, as hydrogen ions will compete with Cu2+ for the active sites of cell wall of biomass.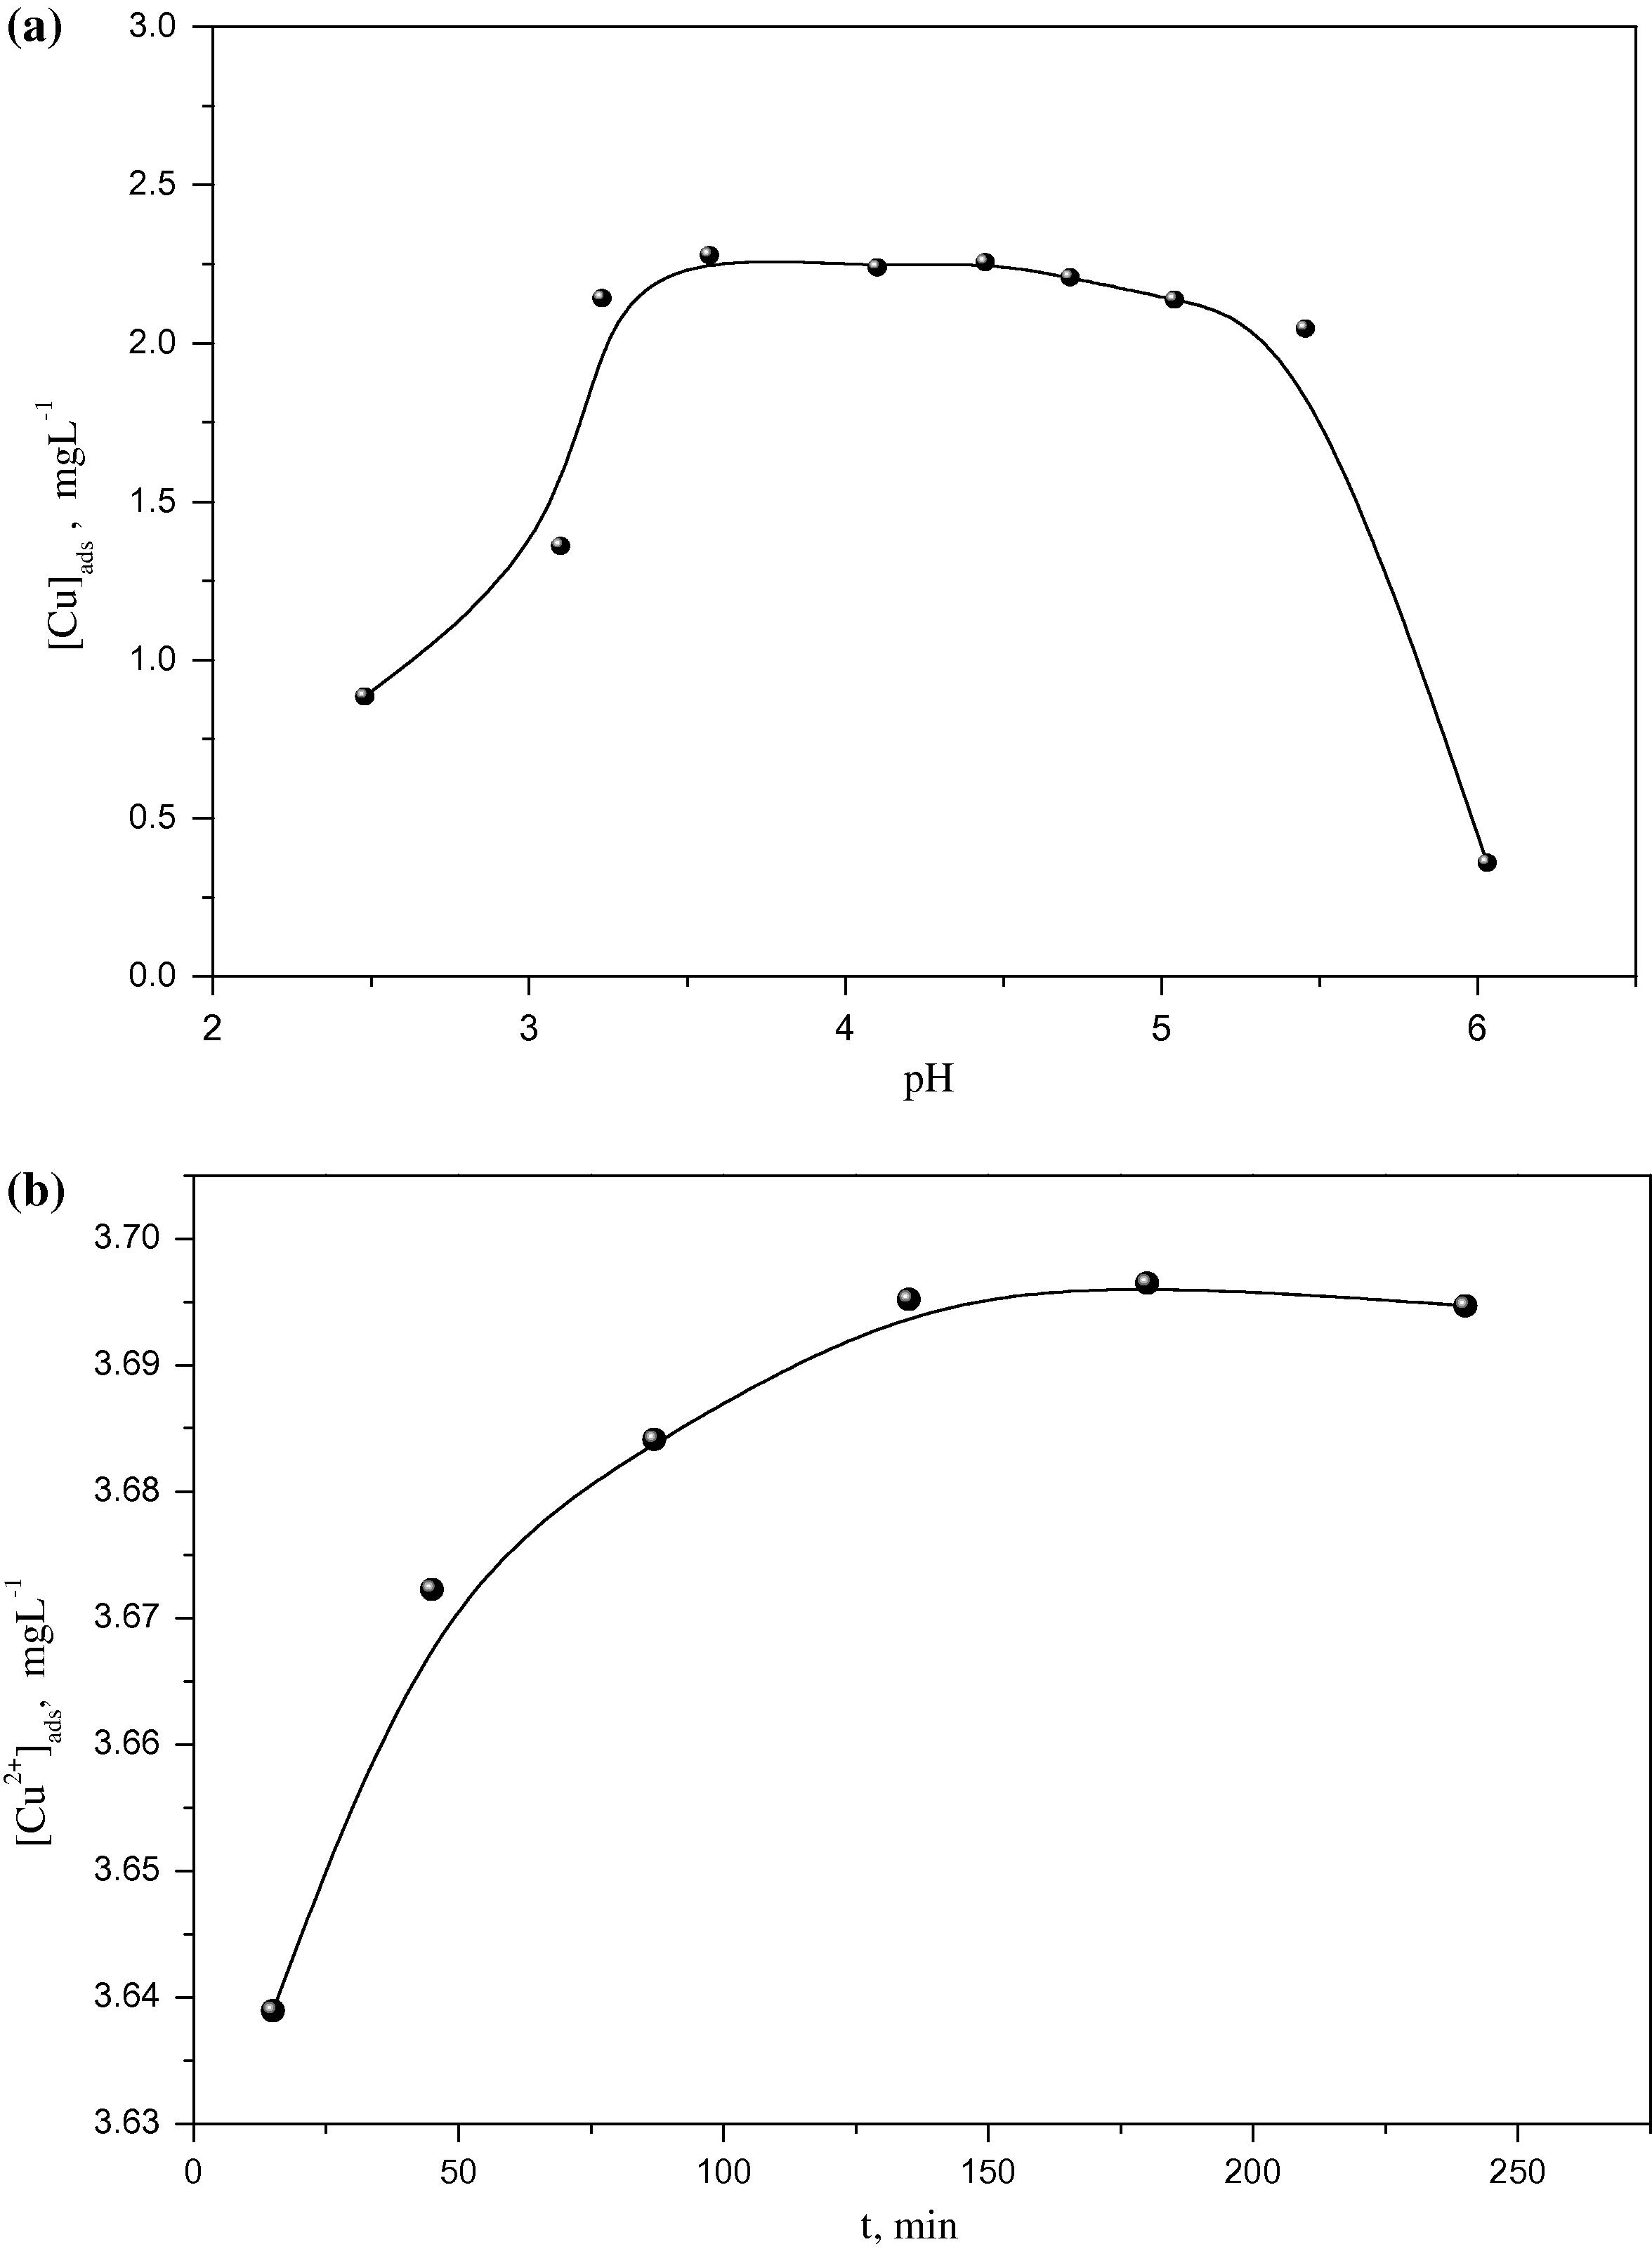
Influence of (a: pH and b: contact time) on Cu2+ biosorption in a system composed from 300 mg biomass, 3.7 mg L−1 Cu2+ and 20 mL of 0.1 M NaNO3.
3.2.2 Effect of time
The result in Fig. 4b indicates the effect of equilibrium time up to 240 min on Cu2+ absorption by E. crassipes biomass. The amount of absorbed Cu2+ increases rapidly from 15 to 75 min, which signifies the progress of Cu2+ biosorption by the biomass. Upon increasing the equilibrium time from 75 to 150 min, the adsorbed Cu2+ increases slightly. Finally, with increasing time from 175 to 225 min, insignificant change in the adsorbed Cu2+ was observed. Therefore, the optimum time to do biosorption experiments for Cu2+ using E. crassipes is 150 min. This result suggests that the biosorption process has two stages, the first one is fast (15–75 min) while the second one is slow (75–150 min).
3.3 Biosorption isothermal study for Cu2+ – E. crassipes system
Maximum absorption capacity (qmax) and Langmuir constants (b) and (Kf) were evaluated at pH 3.5, 4.5 and 5.5 by applying Pardo-model and Norton-model using Eqs. (2) and (3), respectively. Results of their values are shown in Table 2.
pH
Pardo-model
Norton-model
qmax (mg g−1)
±sd
Kf
±sd
R2
qmax (mg g−1)
±sd
b
±sd
R2
3.5
11.6
±0.12
0.45
±0.01
0.949
17.69
±0.14
0.028
±0.0022
0.932
4.5
27.7
±0.09
0.39
±0.01
0.983
24.89
±0.21
0.016
±0.0020
0.987
5.5
18.3
±0.14
0.56
±0.02
0.979
21.11
±0.11
0.026
±0.0013
0.944
Generally, good fitting between the experimental and theoretical data was obtained on applying the two models. This indicates that the two models are adequate to describe the behavior of Cu2+ biosorption by E. crassipes biomass where the values of R2 (correlation coefficient) exceed 94% in the two models (Pardo et al., 2003). R2 coefficient gives the amount of variance explained by the model, so it can be used to evaluate the goodness of fitting at different pH values (Pardo et al., 2003). Moreover, a good Fitting by Pardo-model was noticed at the three pH’s with the best one observed at at pH 4.5 with highest R2 values (Table 2).
Fig. 5a–c shows the linear fitting at pH (3.5, 4.5 and 5.5) against the concentration of Cu2+ using Norton-model. Similarly, the value of R2 in Table 2 indicated that the best fit was at pH 4.5 in Norton-model. This result matches well with that obtained by Pardo-model at pH 4.5 suggesting that at such pH the maximum absorption was fulfilled. Thus, based on Norton-model, the linear fittings for copper-biomass system, at the three pH’s, can be represented as follows:
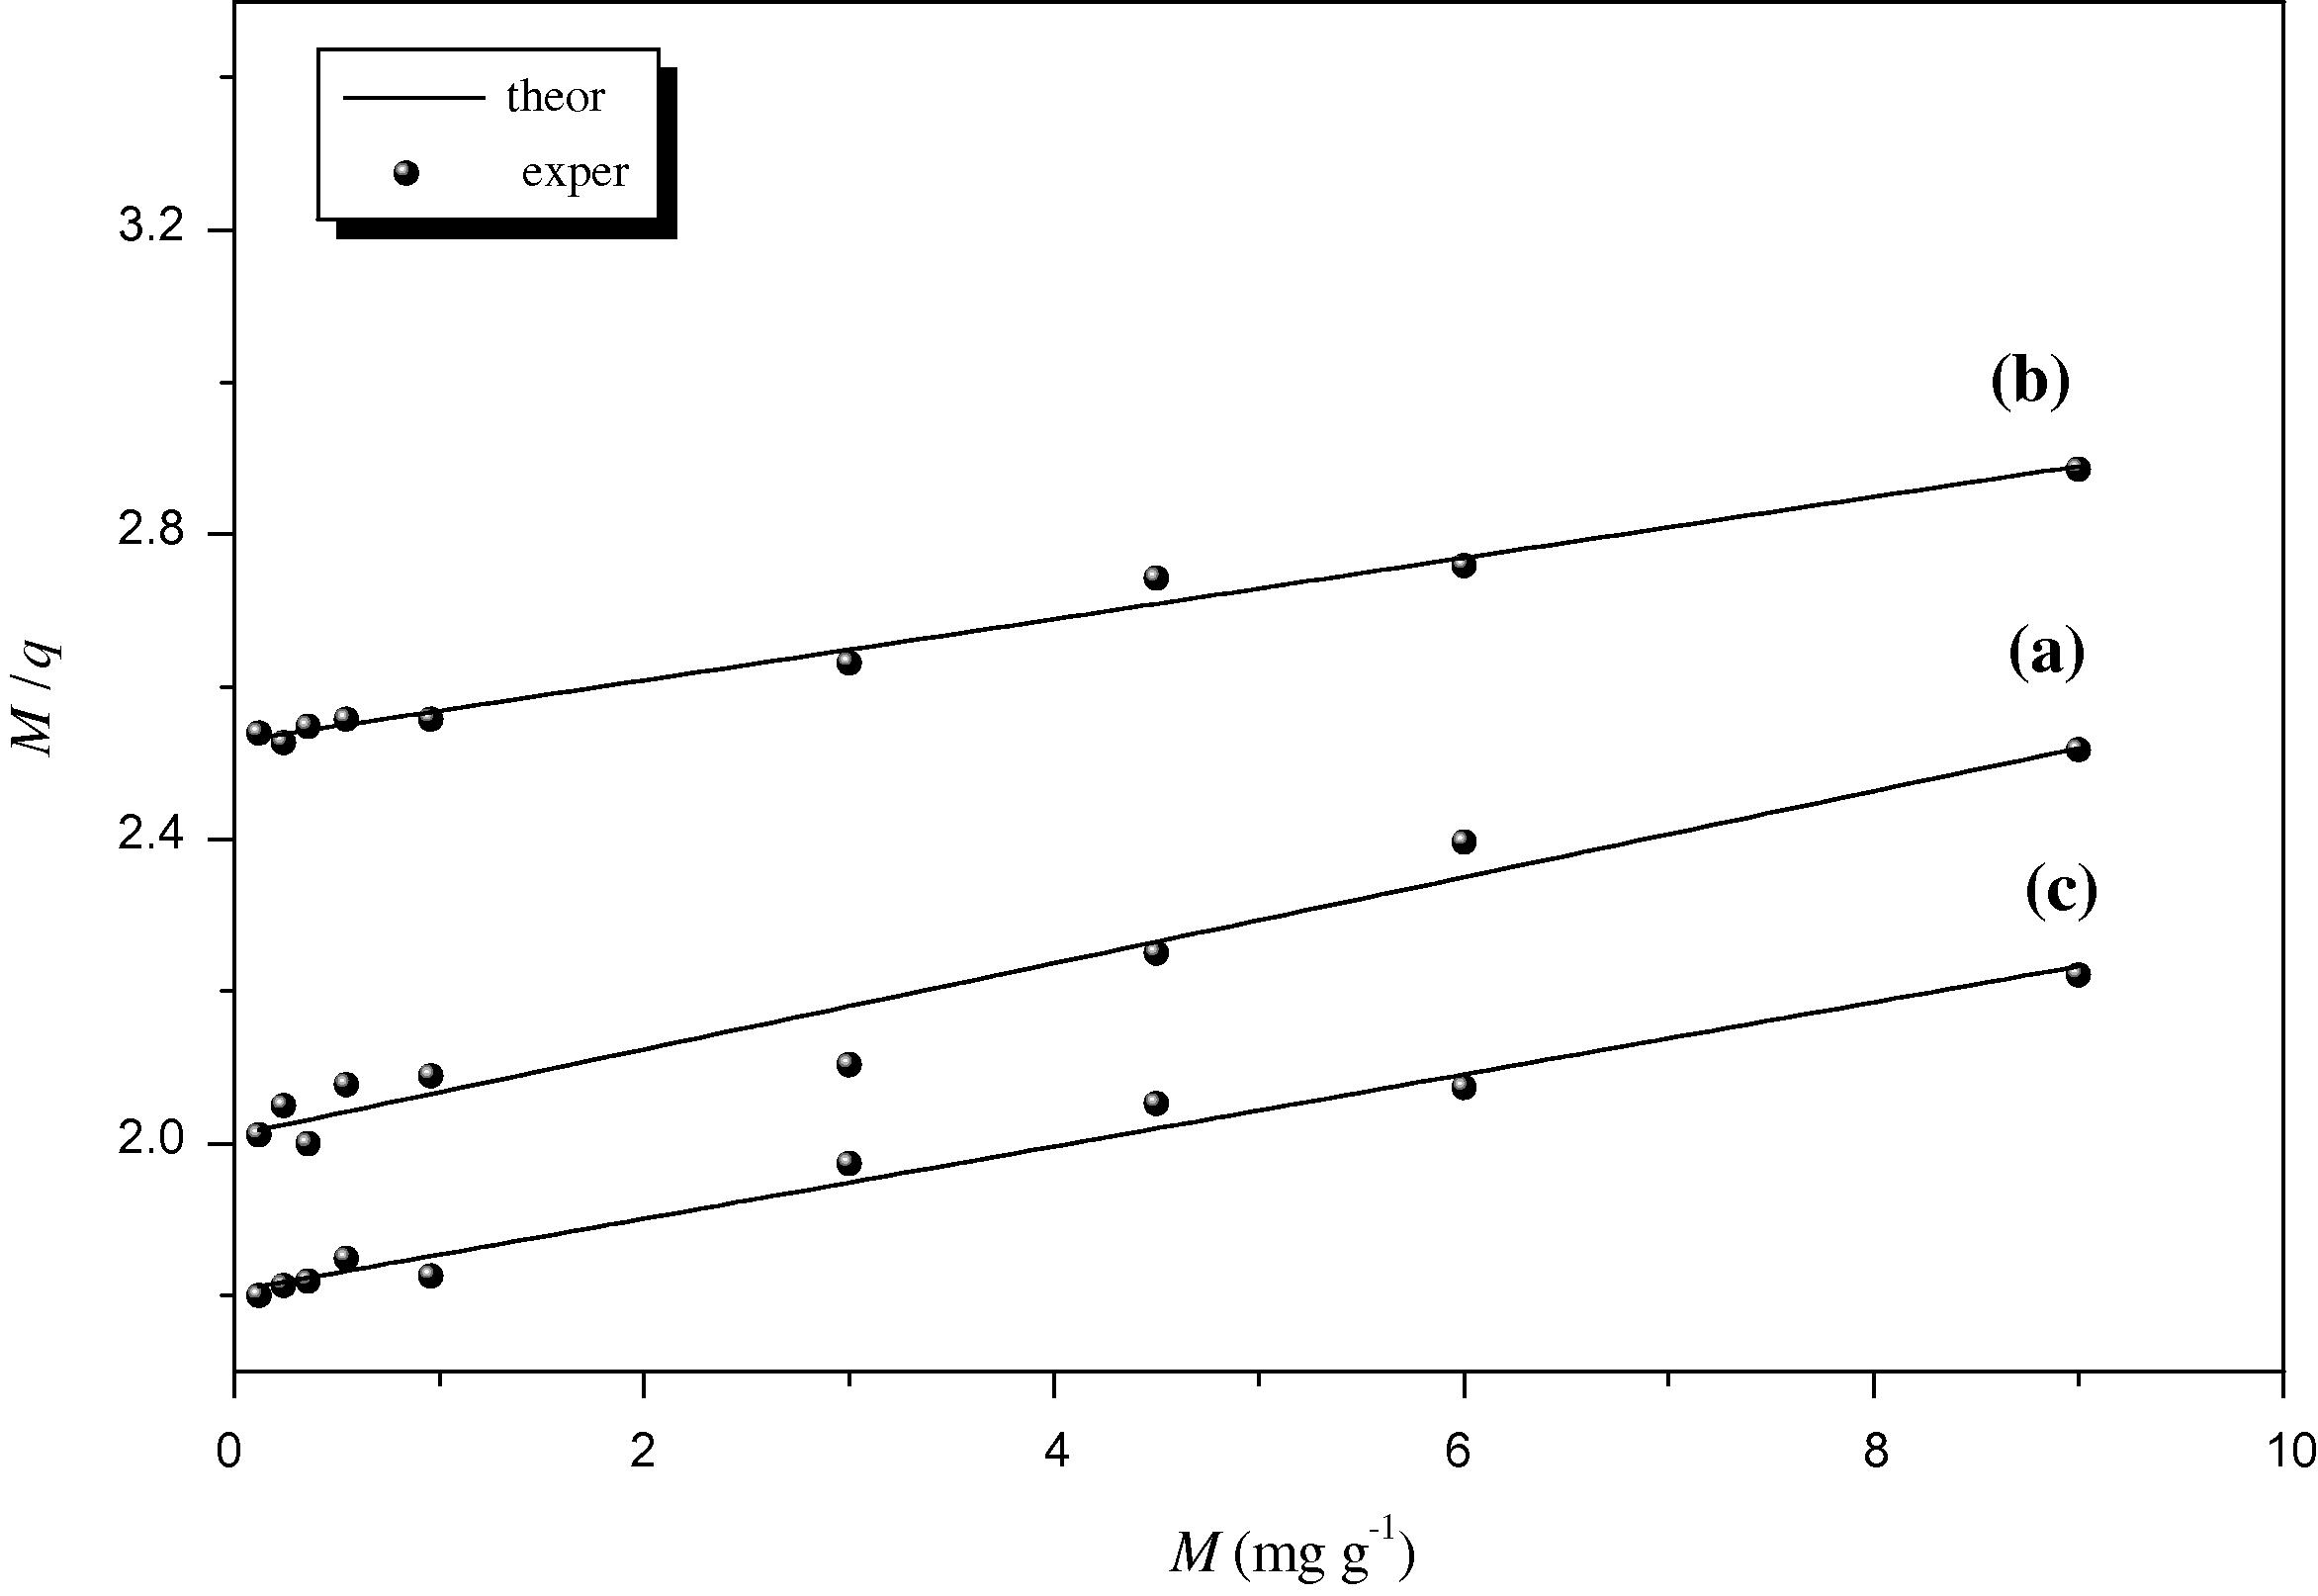
Linearized biosorption isotherms for Cu2+-E. crassipes system by using Norton-model at (a: pH 3.5, b: pH 4.5 and c: pH 5.5).
The values of qmax, b and Kf parameters were used to evaluate the biosorption isotherm in this work. These data are compared with E. crassipes biomass collected from Brazil (Schneider et al., 1995) and India (Dave et al., 2009). It is found that Kf value in the present study (0.39) is higher 1.62 times than that of Brazilian sample (0.24), whereas it is lower 16 times than that of Indian sample (6.05) (Table 2). Similarly, the b value in the present study is lower 0.55 times than of India-sample (0.029) (Dave et al., 2009). Likewise, qmax in the present study obtained by Norton-model (24.89) is very close to that obtained by the Brazilian sample (23.1) (Schneider et al., 1995), while qmax obtained by Pardo-model (27.7) is 1.2 times lower than that obtained from the Indian sample (33.4) (Dave et al., 2009). The inconsistency in the values of the qmax, b and Kf, calculated for Cu2+ biosorption by the same biomass species from different locations, may be attributed to the variation in their habitat which alter the chemical composition and physical characteristics of the biomass and hence the ability and mechanism of biosorption (Omanayi et al., 2011).
3.4 Acid–base properties and proton bindings on E. crassipes
A recent study by Mane et al. (2011) on the same biomass showed that the higher acidic content of the plant is directly connected to its metal binding functions. Accordingly, the importance of estimating the types, amounts and binding constants of acidic sites on the biomass has been aroused to discuss the biosorption mechanism of Cu2+ by E. crassipes.
Figs. 6a–c represent the acid–base titrations of E. crassipes biomass by increasing the pH from 2 to 11.5 using potentiometric and conductometric titrations. The dotted curve in Fig. 6a shows the potentiometric titration for the biomass suspension system; a relation between XHexp, the equilibrium concentrations of total protons in mol g−1 (Y-axis), vs. pH values (X-axis). Noticeably, the inflection in the dotted curve (XHexp) is broad and poorly defined to describe the protonation properties as it is highly affected by the amount of protons on the biomass.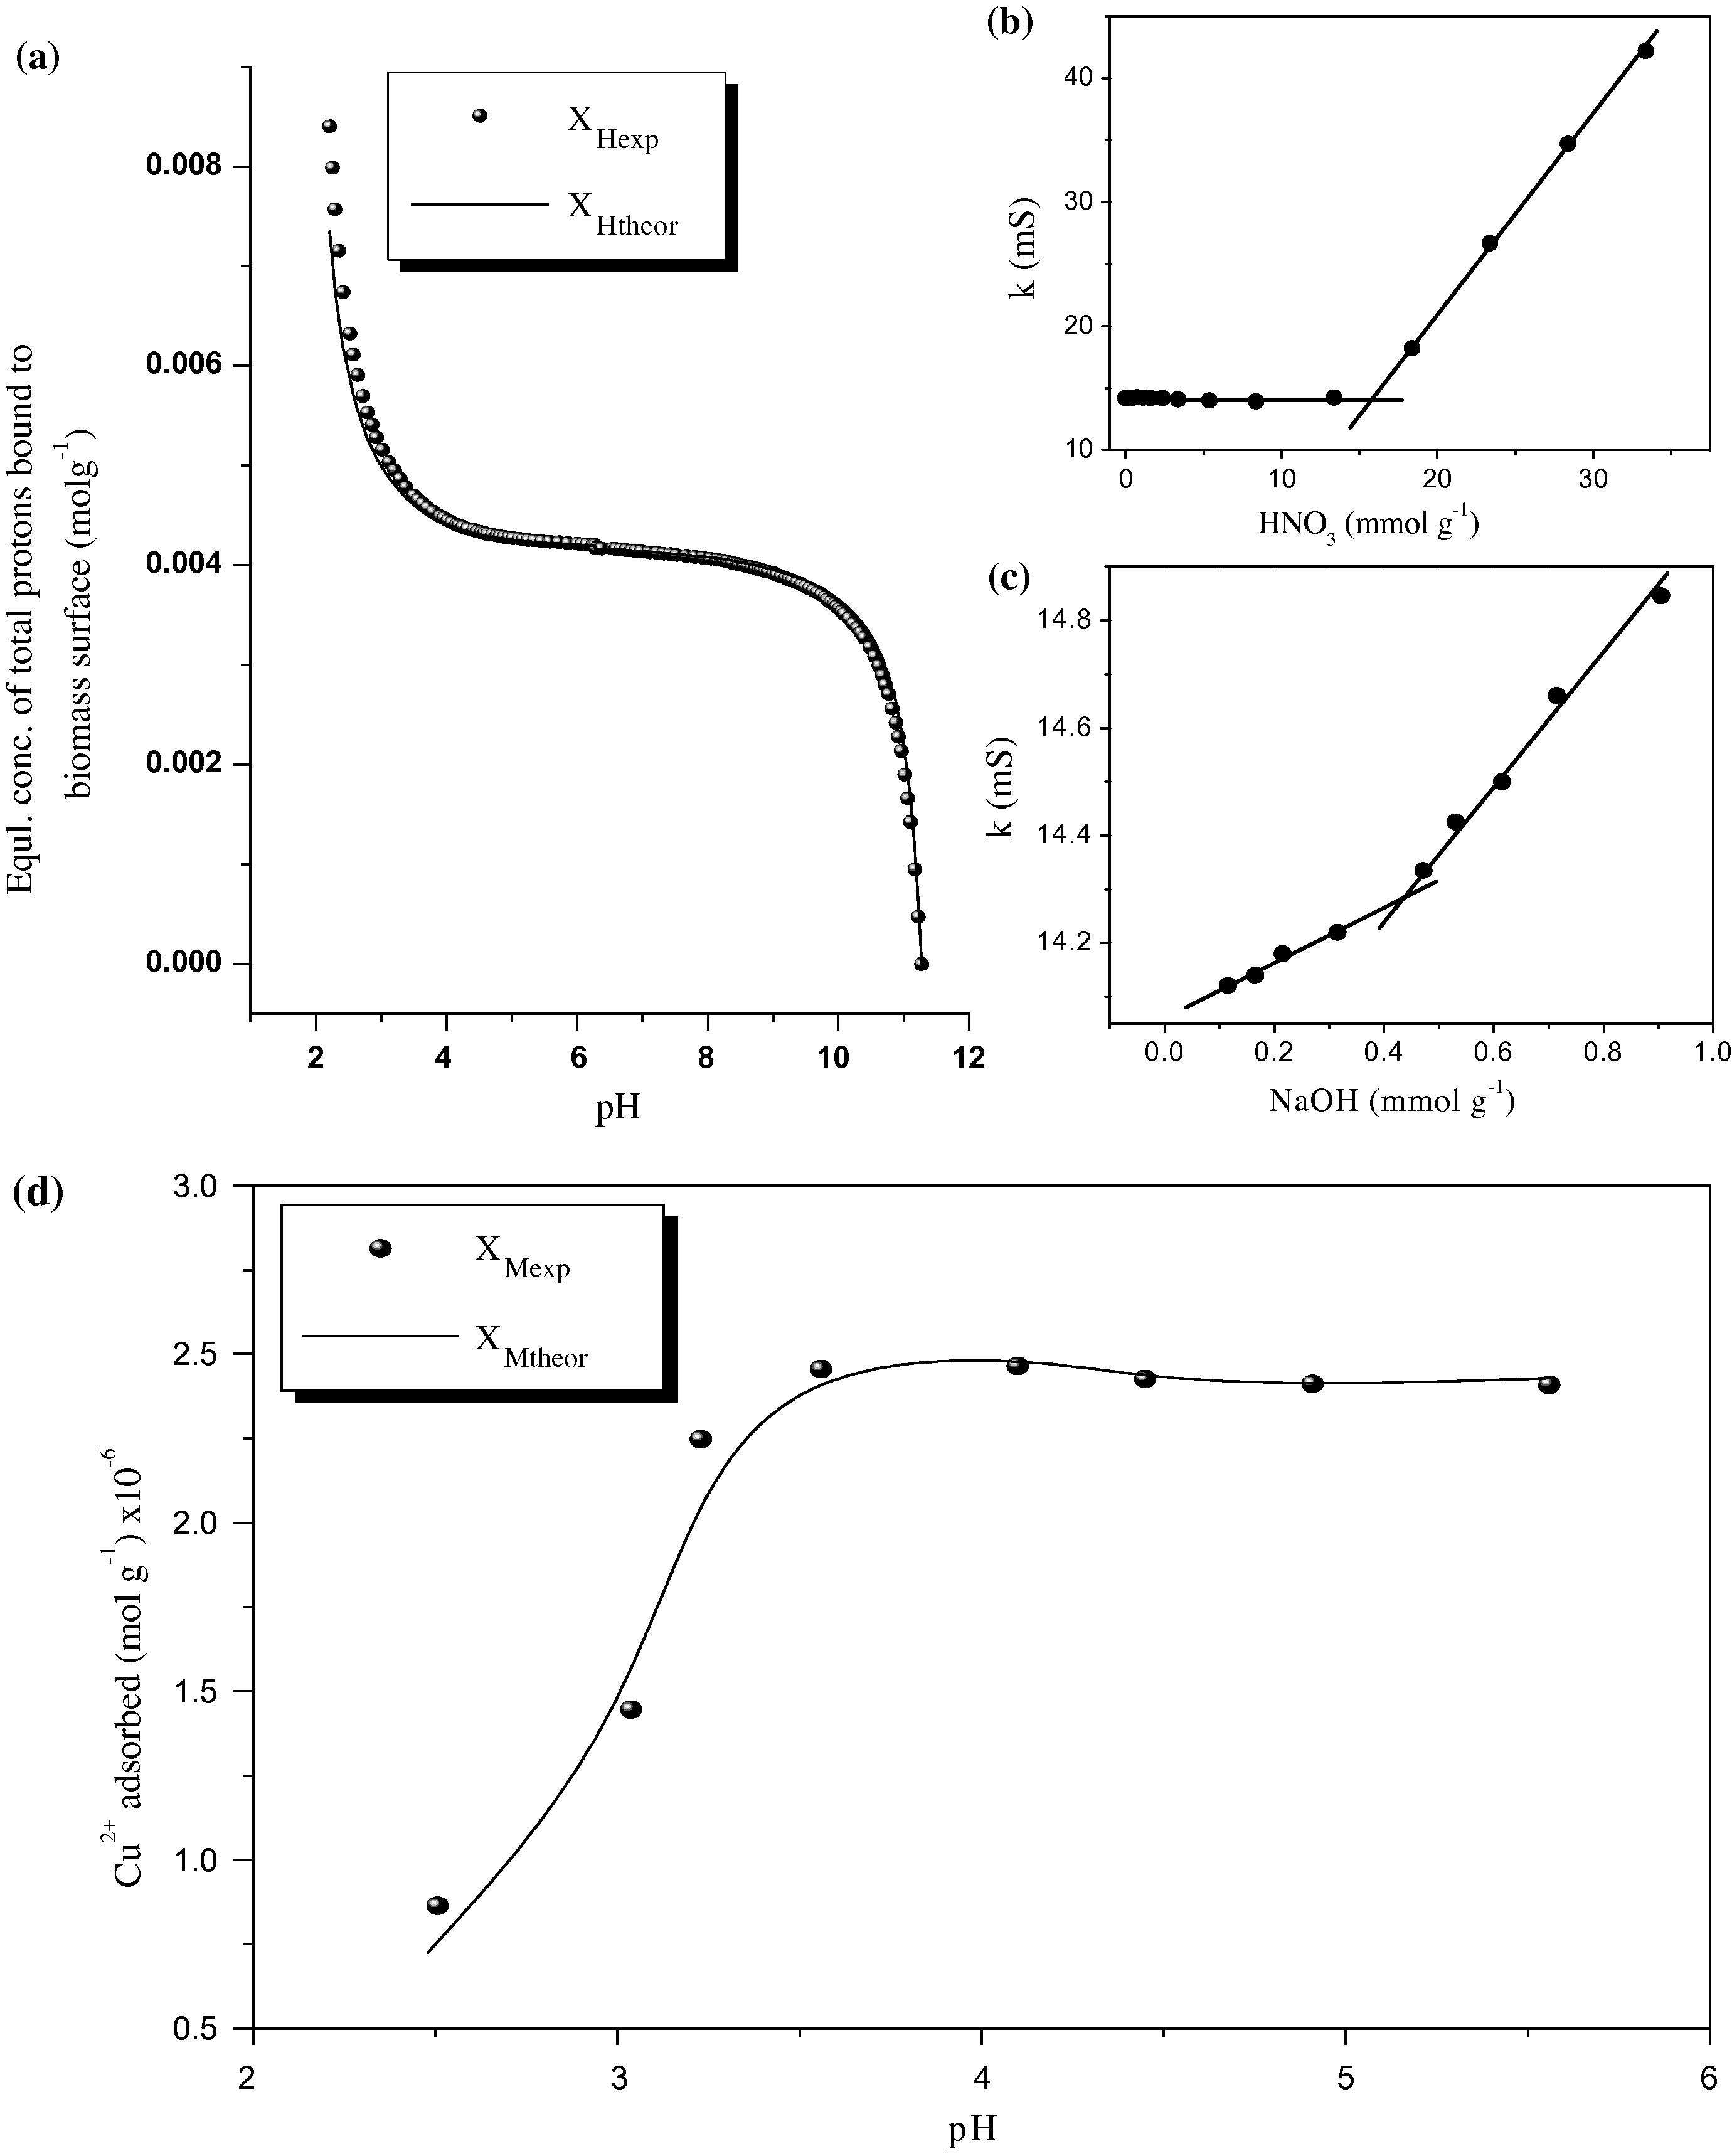
(a) Potentiometric, (b and c) conductometric titration curves for proton bindings and (d) NLLSR fitting for Cu2+ biosorption by E. crassipes biomass at different pH’s. Analogous to a(d) curves: the dotted XHexp(XMexp) and solid XHtheor(XMtheor) lines represent the experimental and theoretical data, respectively.
This result ensures the diversity of binding sites on the tested biomass and leads us to use a theoretical model (NICA), which is reported by Plette et al. (1996). The results of biomass characterization awakened the existence of mainly three active sites (—OH, —COO− and
) describing the biosorption of Cu2+ by the biomass. Therefore, the theoretical (NICA) fitting will be performed on the assumption of the presence of three acidic sites. More description on the theoretical model was described elsewhere (Komy et al., 2006; Seki and Suzuki, 2002; Komy, 2004). Thus, Eq. (4) can be rewritten as follows with considering the three sites:
To evaluate these constants, a NICA model was applied using the experimental XHexp in Eq. (9). Practically, the experimental XHexp (dotted curve) was fitted with the theoretical XHtheor (solid line) in Fig. 6a using Microsoft excel 2003 (solver add-in). As could be observed from Fig. 6a, there is a great fitting between the theoretical and experimental values at each pH (R2 = 0.997). The results of the six parameters (N1, N2, N3, KH1, KH2 and KH3) are listed in Table 3. The total number of acidic sites (NT = N1 + N2 + N3) was found to be NT = 1.65 × 10⁻² mol g−1.
(i) Acidic sites
(ii) Cu-bindings’ constants
Ni
(mol g−1)
±sd∗
pKHi=
±sd
pKMi=
±sd
N1
3.6 × 10⁻³
±8.3 × 10⁻⁴
pKH1
1.8
±0.177
pKM1
4.37
±0.04
N2
1.2 × 10⁻²
±4.1 × 10⁻³
pKH2
1.9
±0.049
pKM2
4.24
±0.03
N3
1.4 × 10⁻³
±4.0 × 10⁻⁴
pKH3
2.0
±0.055
pKM3
3.76
±0.04
To confirm the last result (NT), the total amount of acidic sites was re-measured by conductometric titration for the same biomass system, as shown in Fig. 6b and c. The total amount of acidic sites conductometrically was NT = 1.69 × 10⁻² mol g−1 (calculated as mentioned in Section 2.5). There is high agreement between the two NT values with a relative error of 2.39%.
No reported data on the acidic sites of E. crassipes was found, so a comparison between the present data of E. crassipes with that of Pseudomonas aeruginosa (Komy et al., 2006) and Cumin (Komy, 2004) species was made. Values of N2 = 1.16 × 10⁻² mol g−1 and pKH2 = 1.94 in the present study are analogous to P. aeruginosa (N2 = 1.21 × 10⁻² mol g−1 and pKH2 = 1.92) (Komy et al., 2006) but quite similar to Cumin (N1,2 = 7.87 × 10⁻³ mol g−1 and pKH1,2 = 1.88) (Komy, 2004). Accordingly, this acidic site is mainly found in all of E. crassipes, P. aeruginosa and Cumin. The values of pKH are identical to Glutamic (αpKCOO− = 2.2) and Aspartic (αpKCOO− = 2.1) acids (Solomons, 1994) which are amino acids characterizing all the three biomasses.
N1 and N3 in the present study are of lower values compared to those of P. aeruginosa (N1 = 2.16 × 10⁻² and N3 = 6.87 × 10⁻³ mol g−1), while pKH1 and pKH3 are so close to the pKH1 = 1.66 and pKH3 = 2.16 of P. aeruginosa biomass (Komy et al., 2006). In addition, Proline and have pKH of 2.0 (Solomons, 1994) and 2.15 (Harvey, 1956), respectively, indicating that the other acidic sites (1 and 3) correspond to the Proline and phosphate centers which are found in both E. crassipes and P. aeruginosa (Komy et al., 2006).
The difference between Ni values in the present study and the other two biomasses may be related to: (i) variation in percentage of Proline, Glutamic, Apartic and Leucine acids from one species to another, (ii) the protein series on E. crassipes may partially hydrolyzed to poly peptides (i.e. more free sites are produced), (iii) the presence of an additional ( ) site in E. crassipes and (iv) the low surface area (4.18 m2 g−1) of biomass. Finally, results in (Table 3) show that the values of pKHi of E. crassipes biomass are close to each other (1.8, 1.9 and 2.0) but lower than the standard values of pKCOOH corresponding to the major amino acids (Proline = 2.0, Glutamic = 2.2, Aspartic = 2.1 and Leucine = 2.3) (Solomons, 1994) and pKa ( ) (Harvey, 1956) in E. crassipes biomass.
3.5 Binding constants of Cu2+
A Non-Linear Least Squares Regression (NLLSR) coupled with NICA model were used to evaluate Cu2+ binding constants (KM1, KM2 and KM3) with the three acidic sites. More description and details on the NICA model were described elsewhere (Komy et al., 2006; Seki and Suzuki, 2002; Komy, 2004). Shortly, the NLLSR method with NICA model was applied with the following two assumptions: (i) the biomass contains three main acidic sites (—OH, —COOH and
) responsible for the biosorption of Cu2+, (ii) the biosorption process corresponds to monodentate binding sites. So, Eq. (5), can be rewritten with considering the values of (N1, N2, N3, KH2, KH2 and KH3), as follows:
Fig. 6d illustrates the non-linear fitting between the XMexp (dotted line) and XMtheor (solid line) vs. the pH. A distinctive fitting between the theoretical and experimental lines was obtained (Y-residual = 6.88 × 10⁻¹⁵ and R2 = 0.997), Fig. 6d.
The results in Table 3 indicate that pKM1, pKM2 and pKM3 values are almost identical suggesting —OH, —COOH and sites to be the major acidic sites to bind with Cu2+. In addition, the NLLSR method with NICA can be applied successfully for determining the Cu2+ binding constants.
Taking into consideration the complexity of the chemical composition of the E. crassipes, several mechanisms (ion exchange, complexation, coordination and microprecipitation) can occur at the same time, depending on the aqueous environment (Sheng et al., 2004). In view of that, the interaction between Cu2+ and the E. crassipes biomass can be suggested as follows:
4 Conclusion
In the present study it had been clearly shown that E. crassipes could be potentially used as an economically cheap biosorbent for Cu2+ removal from aqueous solutions. Variables like as pH, adsorbent initial concentration and time were investigated. Primary FT-IR, EDAX, acidic sites, surface area, pore size and elemental investigations showed a readiness of biomass to chelate with metal ions like Cu2+. A strong shift in the absorption bands of –OH, —C⚌O and —PO sites was noticed after the biosorption process indicating their responsibly for Cu2+ biosorption.
Two Langmuir transformations were applied successfully for the biosorption process resulting in a maximum biosorption capacity qmax (27.7 mg g−1) and (24.89 mg g−1) at the optimum pH 4.5. This compares well with qmax of the same biomass from India (33.4) and Brazil (23.1) in previous studies. Applying NICA model of Langmuir resulted in 3 Cu2+ binding constants (pKMi = 4.37, 4.24 and 3.76) with the biomass surface.
References
- Metal ion binding to humic substances: application of the non-ideal competitive adsorption model. Environ. Sci. Technol.. 1995;29:446-457.
- [Google Scholar]
- Description of two-metal biosorption equilibria by Langmuir-type models. Biotechnol. Bioeng.. 1995;47:227-235.
- [Google Scholar]
- Copper remediation by Eichhornia spp. and sulphate-reducing bacteria. J. Hazard. Mater.. 2009;173:231-235.
- [Google Scholar]
- Effects of Cu(II) and pH on the fitness of ceriodaphnia dubia (richard1894) (crustacea, cladocera) in microcosm experiments. Environ. Toxicol.. 2001;16:428-438.
- [Google Scholar]
- Metal binding by humic acids isolated from water hyacinth plants (Eichhornia crassipes [Mart.] Solm-Laubach: Pontedericeae) in the Nile Delta, Egypt. Environ. Pollut.. 2004;131:445-451.
- [Google Scholar]
- Adsorption, Surface Area and Porosity (second ed.). London: Academic Press Limited; 1982. p. 168
- Harvey, D., 1956. Modern Analytical Chemistry, first ed. McGraw-Hill Higher Education, USA, p. 141. ISBN 0–07–237547–7.
- Whistler R.L., Bemiller J.N., eds. Carbohydrate Chemistry. New York: Academic Press; 1962. p. 17
- FTIR spectrophotometry, kinetics and adsorption isotherms modeling, ion exchange, and EDX analysis for understanding the mechanism of Cd2+ and Pb2+ removal by mango peel waste. J. Hazard. Mater.. 2009;164:161-171.
- [Google Scholar]
- Matijevic E., ed. Surface and Colloid Science. New York: Plenum; 1982. p. 170
- Determination of trace metals in Nile River and ground water by DPASV. Mikrochim. Acta.. 1993;111:239-249.
- [Google Scholar]
- Determination of acidic sites and binding toxic metal ions on cumin surface using non-ideal competitive adsorption model. J. Colloid Interface Sci.. 2004;270:282-287.
- [Google Scholar]
- Characterisation of acidic sites of pseudomonas biomass capable of binding protons and cadmium and removal of cadmium via biosorption. World J. Microbiol. Biotechnol.. 2006;22:975-982.
- [Google Scholar]
- Protein measurement with the folin phenol reagent. J. Biol. Chem.. 1951;193:291-297.
- [Google Scholar]
- Biosorption and biochemical study on water hyacinth (Eichhornia crassipes) with reference to selenium. Arch. Appl. Sci. Res.. 2011;3:222-229.
- [Google Scholar]
- Biosorption of Cr(VI) from aqueous solutions by Eichhornia crassipes. Chem. Eng. J.. 2006;117:71-77.
- [Google Scholar]
- Biosorption of zinc from aqueous solutions using biosolids. Adv. Environ. Res.. 2004;8:629-635.
- [Google Scholar]
- Samarium(III) and praseodymium(III) biosorptionon Sargassum sp.: Batchstudy. Process. Biochem.. 2011;46:736-744.
- [Google Scholar]
- Heavy metals in bioindicators of the River Niger about the vicinity of the Ajaokuta iron and steel industry in Kogi State of Nigeria. Res. J. Environ. Sci.. 2011;5:142-149.
- [Google Scholar]
- Biosorption of Cd, Cu, Pb and Zn by inactive biomass of Pseudomonas putida. Anal. Bioanal. Chem.. 2003;376:26-32.
- [Google Scholar]
- PH dependent charging behaviour of isolated cell walls of a gram-positive soil bacterium. J. Colloid Interface. Sci.. 1995;173:354-363.
- [Google Scholar]
- Competitive binding of protons, calcium, cadmium and zinc to isolated cell walls of a gram positive soil bacterium. Environ. Sci. Technol.. 1996;30:1902-1910.
- [Google Scholar]
- Utilization of Fennel biomass (Foeniculum vulgari) a medicinal herb for the biosorption of Cd(II) from aqueous phase. Chem. Eng. J.. 2010;156:106-113.
- [Google Scholar]
- Microbial mobilization and immobilization of heavy metals. Curr. Opin. Biotechnol.. 1996;7:307-310.
- [Google Scholar]
- Eichhornia crassipes as biosorbent for heavy metal ions. Miner. Eng.. 1995;9:979-988.
- [Google Scholar]
- Biosorption. In: Hubbard A.T., ed. Encyclopedia of Surface and Colloid Science. Marcel Dekker Inc; 2002. p. :792-800.
- [Google Scholar]
- Sorption of lead, copper, cadmium, zinc and nickel by marine algal biomass: characterization of biosorptive capacity and investigation of mechanisms. J. Colloid Interface Sci.. 2004;275:131-141.
- [Google Scholar]
- Fundamentals of Organic Chemistry (fourth ed.). New York: John Wiley and Sons; 1994. pp. 972–975
- Laboratory study on the survival of water hyacinth under several conditions of heavy metal concentrations. Adv. Environ. Res.. 2003;7:321-334.
- [Google Scholar]
- Biosorption of copper(II) by chemically modified biomass of Saccharomyces cerevisiae. Process. Biochem.. 2002;37:847-850.
- [Google Scholar]
- Some effects of season, habitat, and clipping on the chemical composition of Andropogon furcatus and Stipa spartea. Bot. Gaz.. 1946;107:427-441.
- [Google Scholar]
- Bioremoval of heavy metals by the use of microalgae. Biotechnol. Adv.. 1993;11:781-812.
- [Google Scholar]
- Biosorption of zinc(II) from aqueous solution by dried activated sludge. J. Environ. Sci.. 2010;22:675-680.
- [Google Scholar]
- Metal adsorption by quasi cellulose xanthogenates derived from aquatic and terrestrial plant materials. Biores. Technol.. 2011;102:3629-3631.
- [Google Scholar]


