Translate this page into:
Liquefaction microzonation of Babol city using artificial neural network
*Corresponding author. Tel.: +989113123050; fax: +981112296583 FarzadFarrokhzad2003@yahoo.com (F. Farrokhzad)
-
Received: ,
Accepted: ,
This article was originally published by Elsevier and was migrated to Scientific Scholar after the change of Publisher.
Abstract
Liquefaction microzonation is a process that involves incorporation of geologic, seismologic and geotechnical concerns into economically, sociologically and politically justifiable and defensible land-use planning for earthquake effects so that engineers can site and design structures that will be less susceptible to damage during earthquakes.
The scope of present study is to prepare the liquefaction microzonation map for the Babol city based on Seed and Idriss (1983) method using artificial neural network.
Artificial neural network (ANN) is one of the artificial intelligence (AI) approaches that can be classified as machine learning. Simplified methods have been practiced by researchers to assess nonlinear liquefaction potential of soil. In order to address the collective knowledge built-up in conventional liquefaction engineering, an alternative general regression neural network model is proposed in this paper.
To meet this objective, an effort is made to introduce a total of 30 boreholes data in an area of 7 km2 which includes the results of field tests into the neural network model and the prediction of artificial neural network is checked in some test boreholes, finally the liquefaction microzonation map is produced for research area.
Based on the obtained results, it can be stated that the trained neural network is capable in prediction of liquefaction potential with an acceptable level of confidence. At the end, zoning of the city is carried out based on the prediction of liquefaction potential variations in the study area.
Keywords
Microzonation
Liquefaction
Artificial neural network
Earthquake
Babol
1 Introduction
Microzonation is subdivision of a region into a number of zones that have relatively similar exposure to various earthquake-related effects. Microzonation should provide general guidelines for the types of new structure that are most suited to an area, and it should also provide information on the relative damage potential of existing structures in the region. They are also useful in establishing criteria for land-use planning and strategy for formulation of a systematic and informed decision-making process, for the sitting and development of new communities in areas that are made hazardous by nature.
With the increase in population (Fig. 1) the evaluation of liquefaction is becoming more important for land-use planning and development. In soil deposits under undrained condition, earthquakes induce cyclic shear stresses that may lead to soil liquefaction (Ishihara and Yasuda, 1975).
Population zonation of study area.
When saturated sand deposits are subjected to earthquake-induced shaking, pore water pressures are built-up leading to liquefaction or loss of soil strength. Major earthquakes that have occurred during past years, such as the 1964 Alaska, 1964 Niigata, 1989 Loma-prieta and the 1995 Hyogoken-Nambu, have demonstrated the damaging effects of soil liquefaction. Therefore, it is necessary to obtain a proper understanding of zones with high liquefaction risk and this work should be extended later in several stages to cover border areas of metropolis.
Liquefaction is a phenomenon in which the strength and stiffness of a soil is reduced by earthquake shaking or other rapid loading. During the liquefaction, pore water pressure exerts a pressure on the soil particles that influences how tightly the particles themselves are pressed together. Prior to an earthquake, the water pressure is relatively low. However, earthquake shaking can cause the water pressure to increase to the point where the soil particles can readily move with respect to each other. Earthquake shaking often triggers this increase in water pressure, but construction-related activities such as blasting can also cause an increase in water pressure (Agrawal et al., 1997).
The behavior of a saturated soil under both monotonic and cyclic shear is depicted in Fig. 2. The response of the same soil in loose (contractive) and dense (dilative) states as indicated in part (a) and (b), respectively, of this figure. A loose soil tends to compact when sheared and, without drainage, pore water pressures increase. As indicated in Fig. 2a, a contractive soil sheared monotonically reaches apeak shear strength and then softens, eventually achieving a residual shear resistance. If the same soil is sheared cyclicly, which also depicted in Fig. 2a, excess pore pressures are generated with each cycle of load. Without drainage, pore pressure accumulates and the effective stress path moves towards failure. Shearing of dense, dilative soil will also produce some excess pore pressure at small strain. However, at large strains, the pore pressure decrease in soil volume (dilation). Consequently, as shown in Fig. 2b monotonic shearing of a dilative soil results in an increasing effective stress and shear resistance. Fig. 2b also shows the response of the same dilative soil to dynamic loading. In this case, pore pressure is generated in each shear cycle resulting in an accumulation of excess pore pressure and deformation (Whitman, 1971).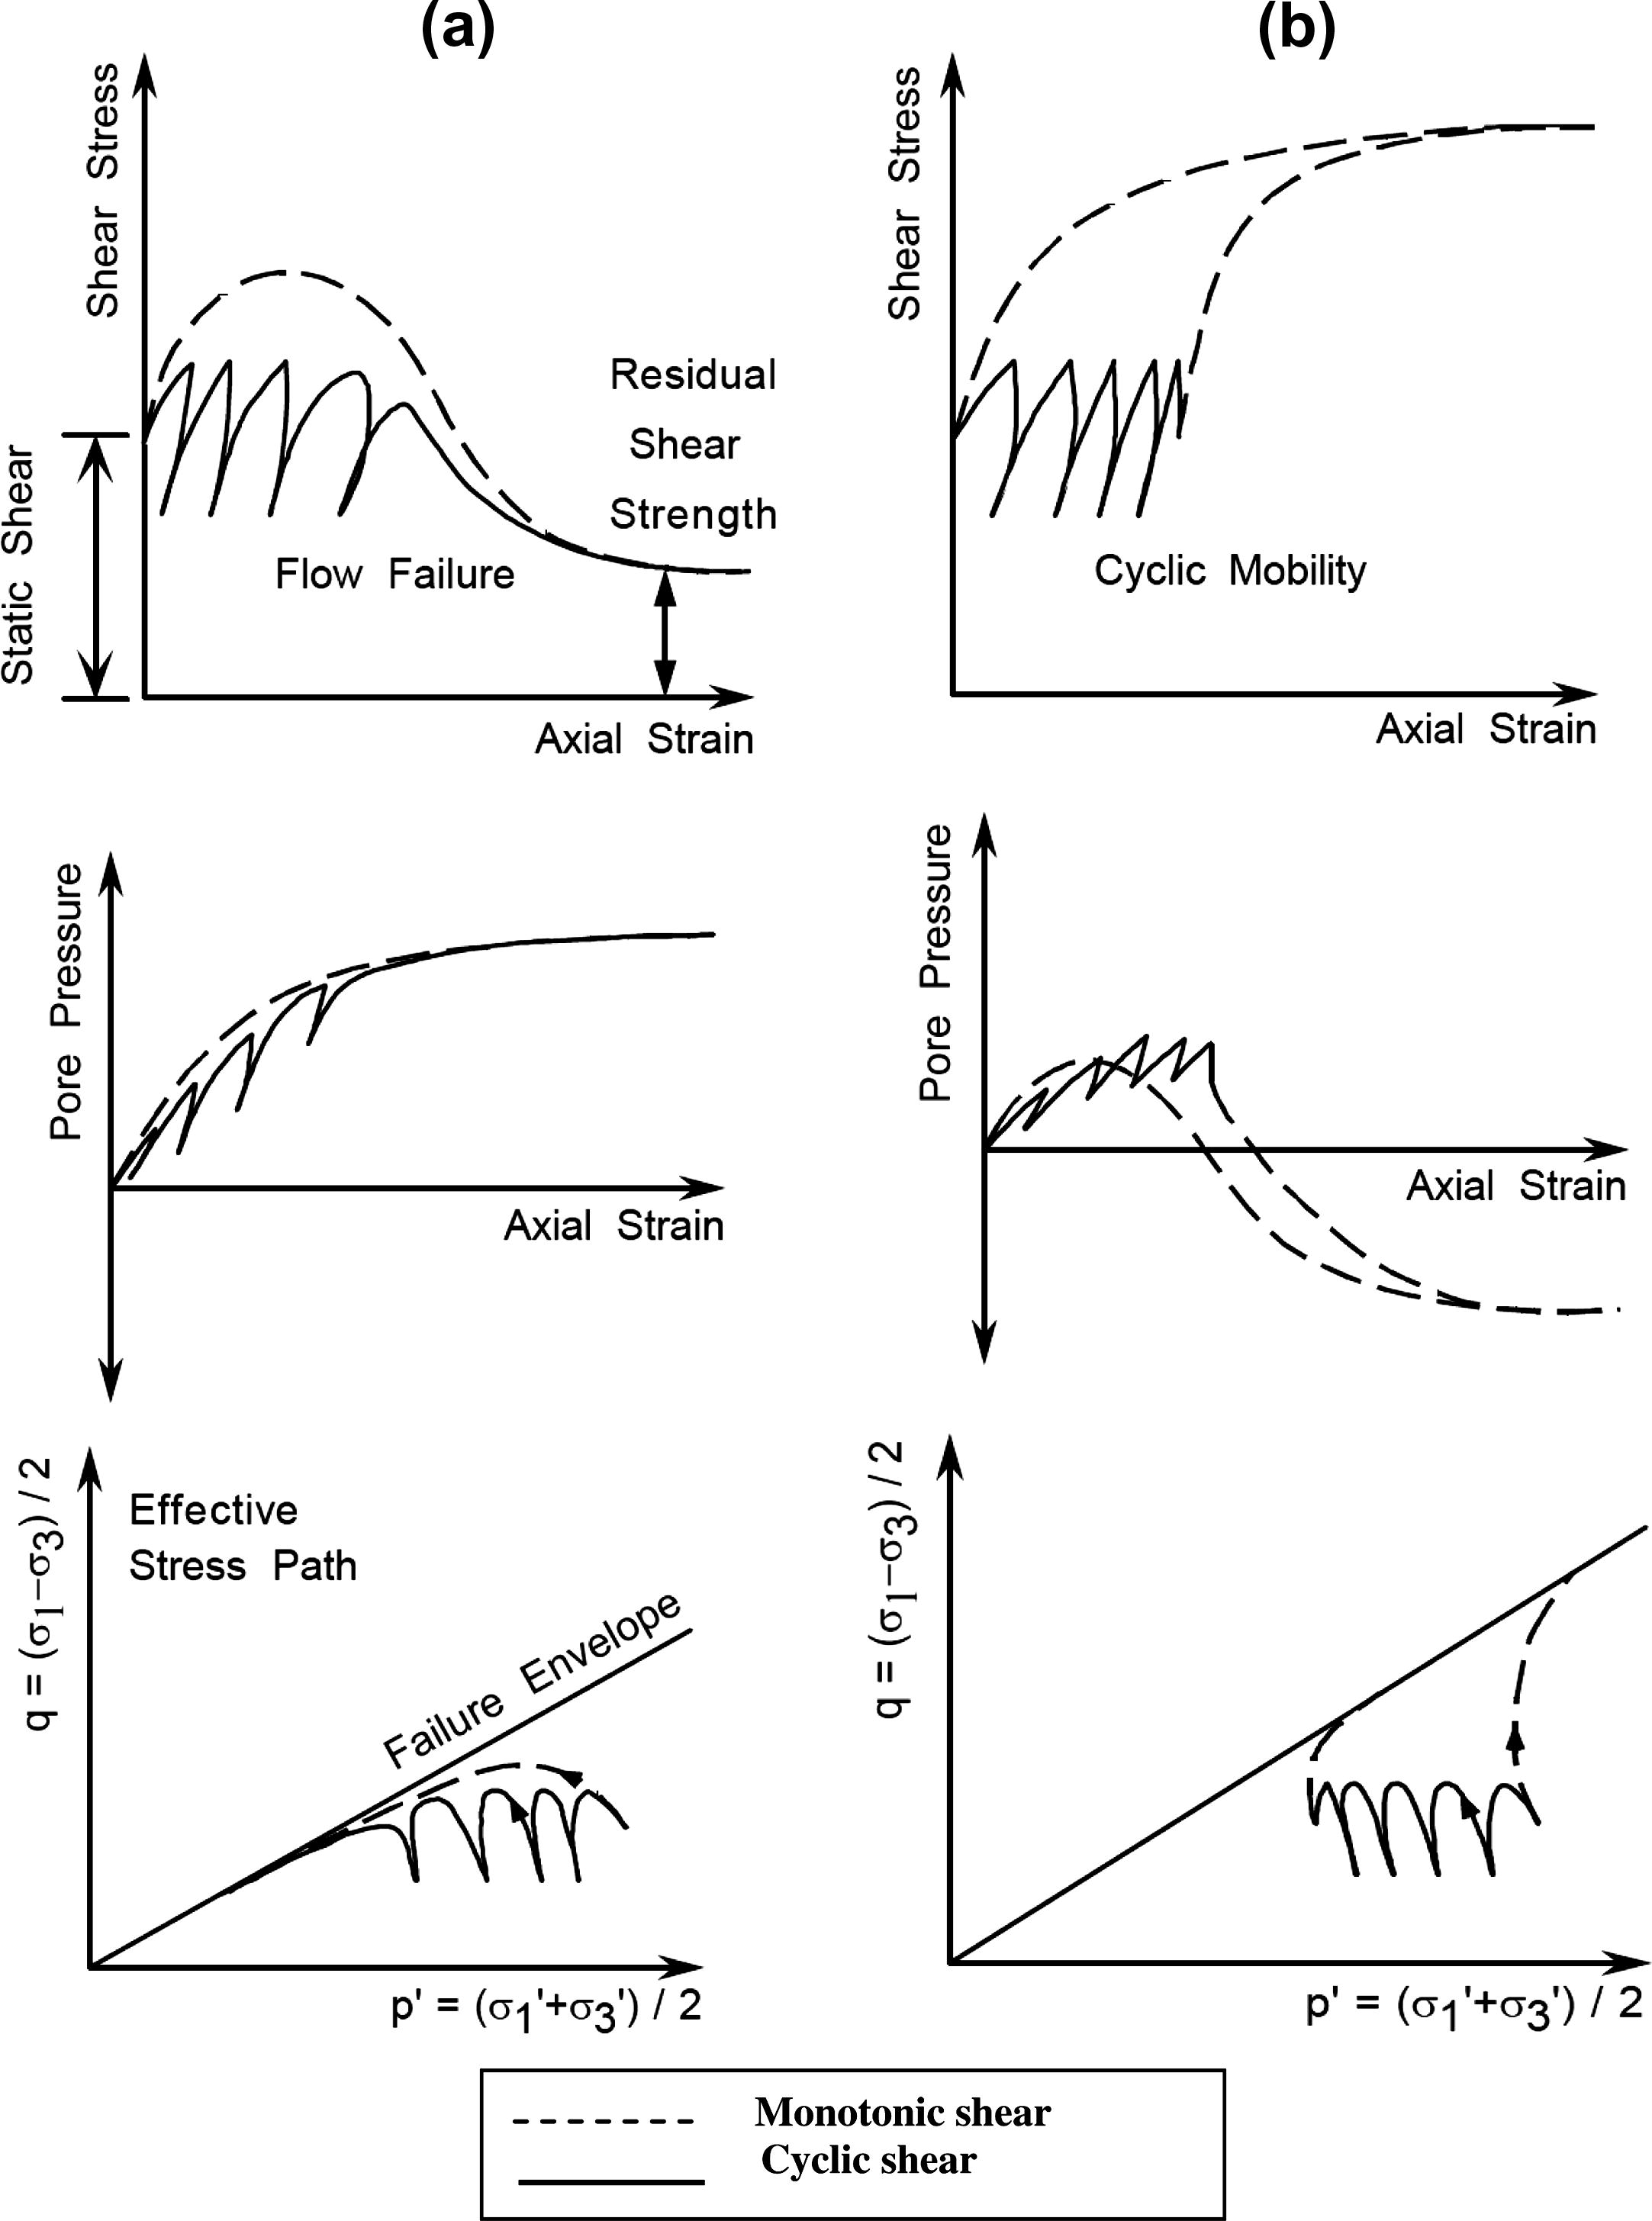
Response of (a) contractive and (b) dilative saturated sands to undrained shear.
Ground response analyses based on the finite element method provide a better assessment of liquefaction of a soil deposit by taking into account the nature of the earthquake and the pore pressure dissipation; they are often costly and time consuming. In addition, constitutive models used in those programs need large number of parameters to determine the pore pressure generation in soil due to earthquake loading (Chern et al., 2008). Therefore, simplified methods in assessing soil liquefaction are popular among practicing engineers. These procedures are very useful at the preliminary design stages to assess the liquefaction risk. If the liquefaction risk is high, then a detailed finite element analysis can be carried out to obtain the pore pressure distribution and ground displacement along the depth of the soil deposit, which is necessary in subsequent design of deep foundations. In more details improving the reliability of liquefaction risk may lead to cost reduction and helps to operation planning.
An artificial neural network is a mathematical model or computational model based on biological neural networks. It consists of an interconnected group of artificial neurons and processes information using a connectionist approach to computation. In most cases an ANN is an adaptive system that changes its structure based on external or internal information that flows through the network during the learning phase (Malvić et al., 2008).
Artificial neural networks mimic human brains to learn the relationships between certain inputs and outputs from experience. They are considered as information processing systems that have the abilities to learn, recall and generalize from training data (Choobbasti et al., 2009) An ANN consists of several layers of highly interconnected computational units called neurons. Fig. 2 shows the general structure of a three-layer feed-forward ANN (Riedmiller and Braun, 1993). The neural network contains one input layer, one or two hidden layers, and one output layer. The number of nodes in the input layer equals the number of parameters in the process (Cal, 1995). The output layer represents the quality responses of the product. The hidden layer represents the interactions between the input and the output layers. Normally the number of nodes in the hidden layer is set to be half of the total number of input nodes and output nodes. If the relationships between the operation parameters and the quality responses are difficult to identify, two hidden layers may be used. Such neural networks are capable of capturing complex nonlinear relationships inherent in a process (Fig. 3).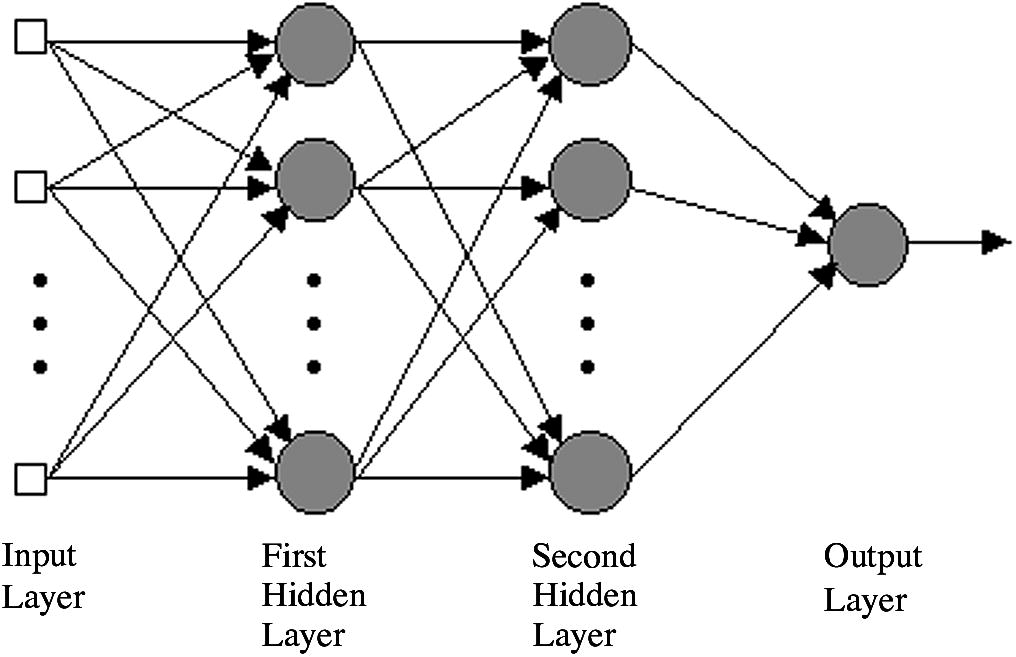
A three-layer feed-forward neural network structure.
The ANN uses a set of examples in a training database as input, a learning algorithm to adjust the weights and an activation function to derive an output. If the connection weight between the neurons is changed, the relationship of the network’s output to its input will be altered (Rumelhart et al., 1986). The process of adjusting the connection weights by repeatedly exposing the network to known input–output data is called training. The error back-propagation learning method is the most popular and successful training technique. A trained ANN can take inputs and produce outputs very quickly, which is an advantage in doing optimization in the proposed approach (Hornik, 1991).
ANNs have been proved to be a universal estimator, hence they are promising techniques in solving pattern recognition and classification, optimization and function approximation problems. Recently, ANNs are used to model complex manufacturing processes and to identify the optimal process setting (Rumelhart et al., 1986). In this research, the ANN is used to establish the nonlinear multivariate relationships between liquefaction potential and parameters, which can be used to predict the liquefaction potential in soil.
Recently, extensive studies have been done on application of ANN to geotechnical engineering problems. Chan et al. (1995) developed a neural network as an alternative to pile driving formulae. The network was trained with the same input parameters listed in the simplified Hiley formula, including the elastic compression of the pile and soil, the pile set and the driving energy delivered to the pile.
Sivakugan et al. (1998) explored the possibility of using neural networks to predict the settlement of shallow foundations on granular soils. A neural network was trained with five inputs representing the net applied pressure, average blow count from the standard penetration test, width of foundation, shape of foundation and depth of foundation. The output was the settlement of the foundation.
Several methods for liquefaction assessment have been developed. One method of analyses (Seed and Idriss, 1971) proposes using the estimated shear stress level and cycle number likely to be developed in the field, due to a design earthquake. Comparison of these stresses with those causing liquefaction of soil samples obtained from laboratory tests helps in identifying the liquefiable zones of a deposit. Another method (Seed et al., 1975) considers field observations of performance of sites during previous earthquakes. By combining the data on earthquake characteristics and in situ properties of soil deposits, an empirical relationship is established.
The purpose of this research is to investigate the effect of the soil and seismic parameters, with an artificial intelligence computational tool, and its success in assessing liquefaction potential.
Data collection in explored soils is important for assessing of liquefaction potential as well as estimation of strata thickness, soil type, groundwater table etc. It is also time consuming and often expensive process, which includes many field and laboratory experiments (Penumadu and Zhao, 1999). Therefore reliable prediction of liquefaction asks for careful planning of sampling, testing and exploration methods. Data had been collected from the boreholes (maximum depth: 30 m) over a 7 km2 area of Babol municipal region. Artificial neural networks are trained with 60% and validated with 10% of borehole data for prediction of liquefaction. The whole system is eventually tested for efficiency, using 30% of borehole data left for test of the network, distributed randomly over the study area. Based on the obtained results and considering that the test data were not presented to the network in the training and validation process, it can be stated that the trained neural networks are capable of predicting variations in the liquefaction potential of soil with an acceptable level of confidence (Rizzo and Dougherty, 1994).
Successful prediction of liquefaction in soil deposit using the existing data leads to improve the reliability of data which will be used for construction in future. Such approach is presented in the following text that generally comprises presentation of the study area, then description and selection of the neural model, its training, improving, and developing of final model is completely described, then the generated ANN model is used for the prediction of liquefaction.
2 Materials and methods
Babol, a city of Mazandaran province in the northern part of Iran, is considered as the study area in this research. As shown in Fig. 3 the city is located approximately 20 km south of Caspian sea on the west bank of the river Babolrood and receives abundant annual rainfall. Babolrood has 2 groups of river terraces, namely H1 and H2. H1, with down surface level of height one to 2.5 m and width of 0–150 m. It is referred to as boundary of active (yearly) flood plain in parts of river and as an alternative flood plain in many sections. It consists of fine-grained and unconsolidated alluvial sediments. H2 is referred to as river terraces; with high surface level of 4–6 m. Vegetation on surface of terrace is compact. It consists of materials of Aeolian deposits (i.e. loess). Most major earthquakes occur around the boundaries of the tectonic plates such as those that exist in north of Iran (Fig. 4).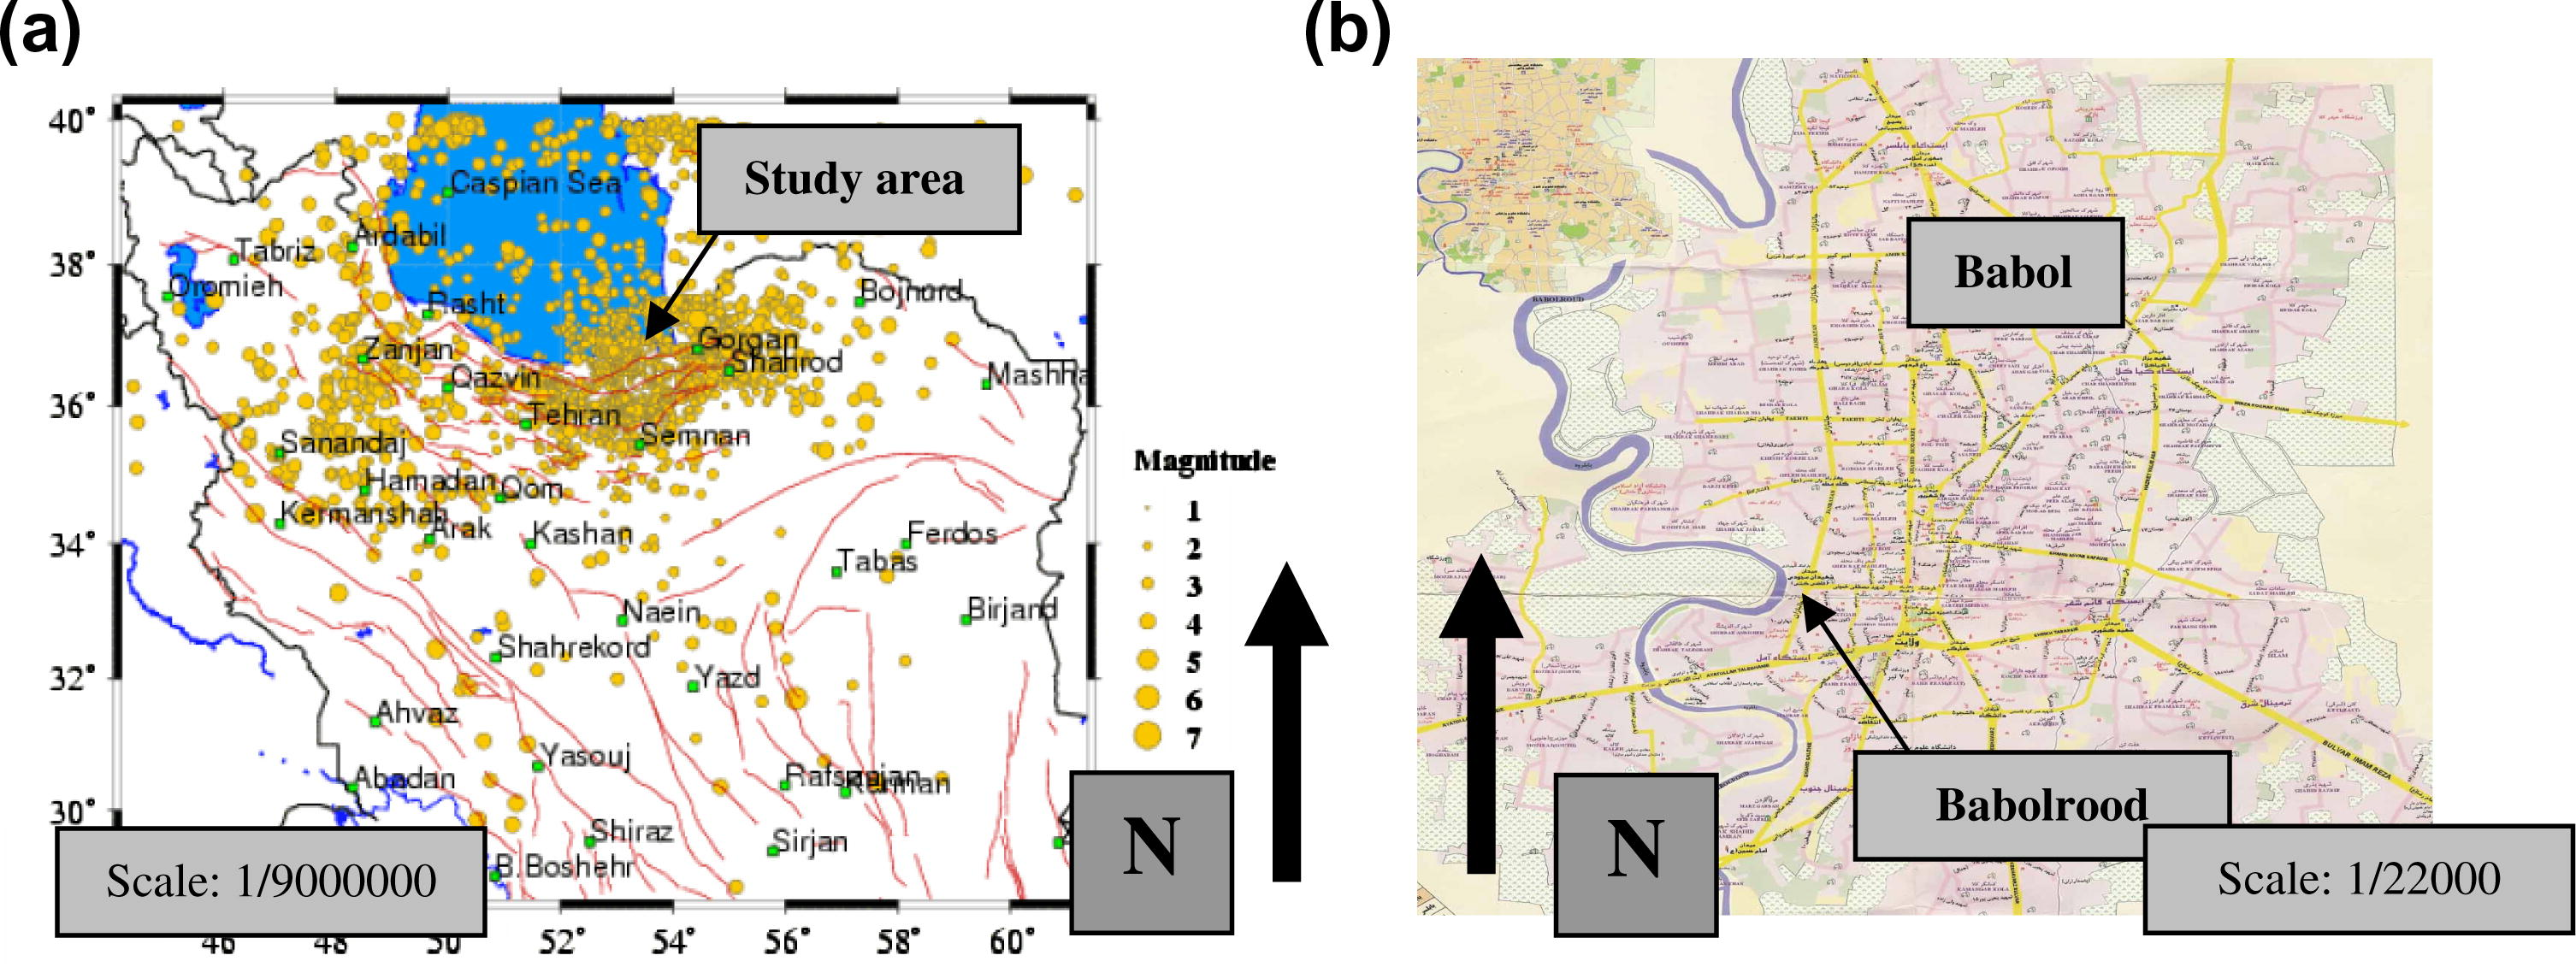
(a) Map of study area and magnitude of earthquake recorded in study area and (b) the zone of the Babolrood river.
Very often in geotechnical engineering, it is possible to encounter some types of problems that are very complex and cannot be completely understood. Mathematical models that attempt to solve such problems cannot include entire physics of process and necessarily need to simplify the model or incorporating some assumptions. Mathematical models also assumed the knowing of model structure in advance, which does not need to be optimal. Consequently, many mathematical models fail to simulate the complex behavior of most geotechnical engineering problems. In contrast, ANNs are based mostly on the input data structure, assuming that such structure and interaction among data can describe the prediction model. In this case, there is no need to neither simplify the problem nor incorporate any assumptions (expect user selection of data that are in some meaningful connection). Moreover, obtained neural models can always be trained again with more extensive and newer dataset from the same area with a goal to reach better results.
The data used in presented research, includes borehole logs (data collected from digging boreholes) bored in the study area (Fig. 5) and is collected by different institutions for different research purposes (Kusano et al., 1988). The database includes more than 40 borehole logs in an area of more than 6 km2 from Babol zone.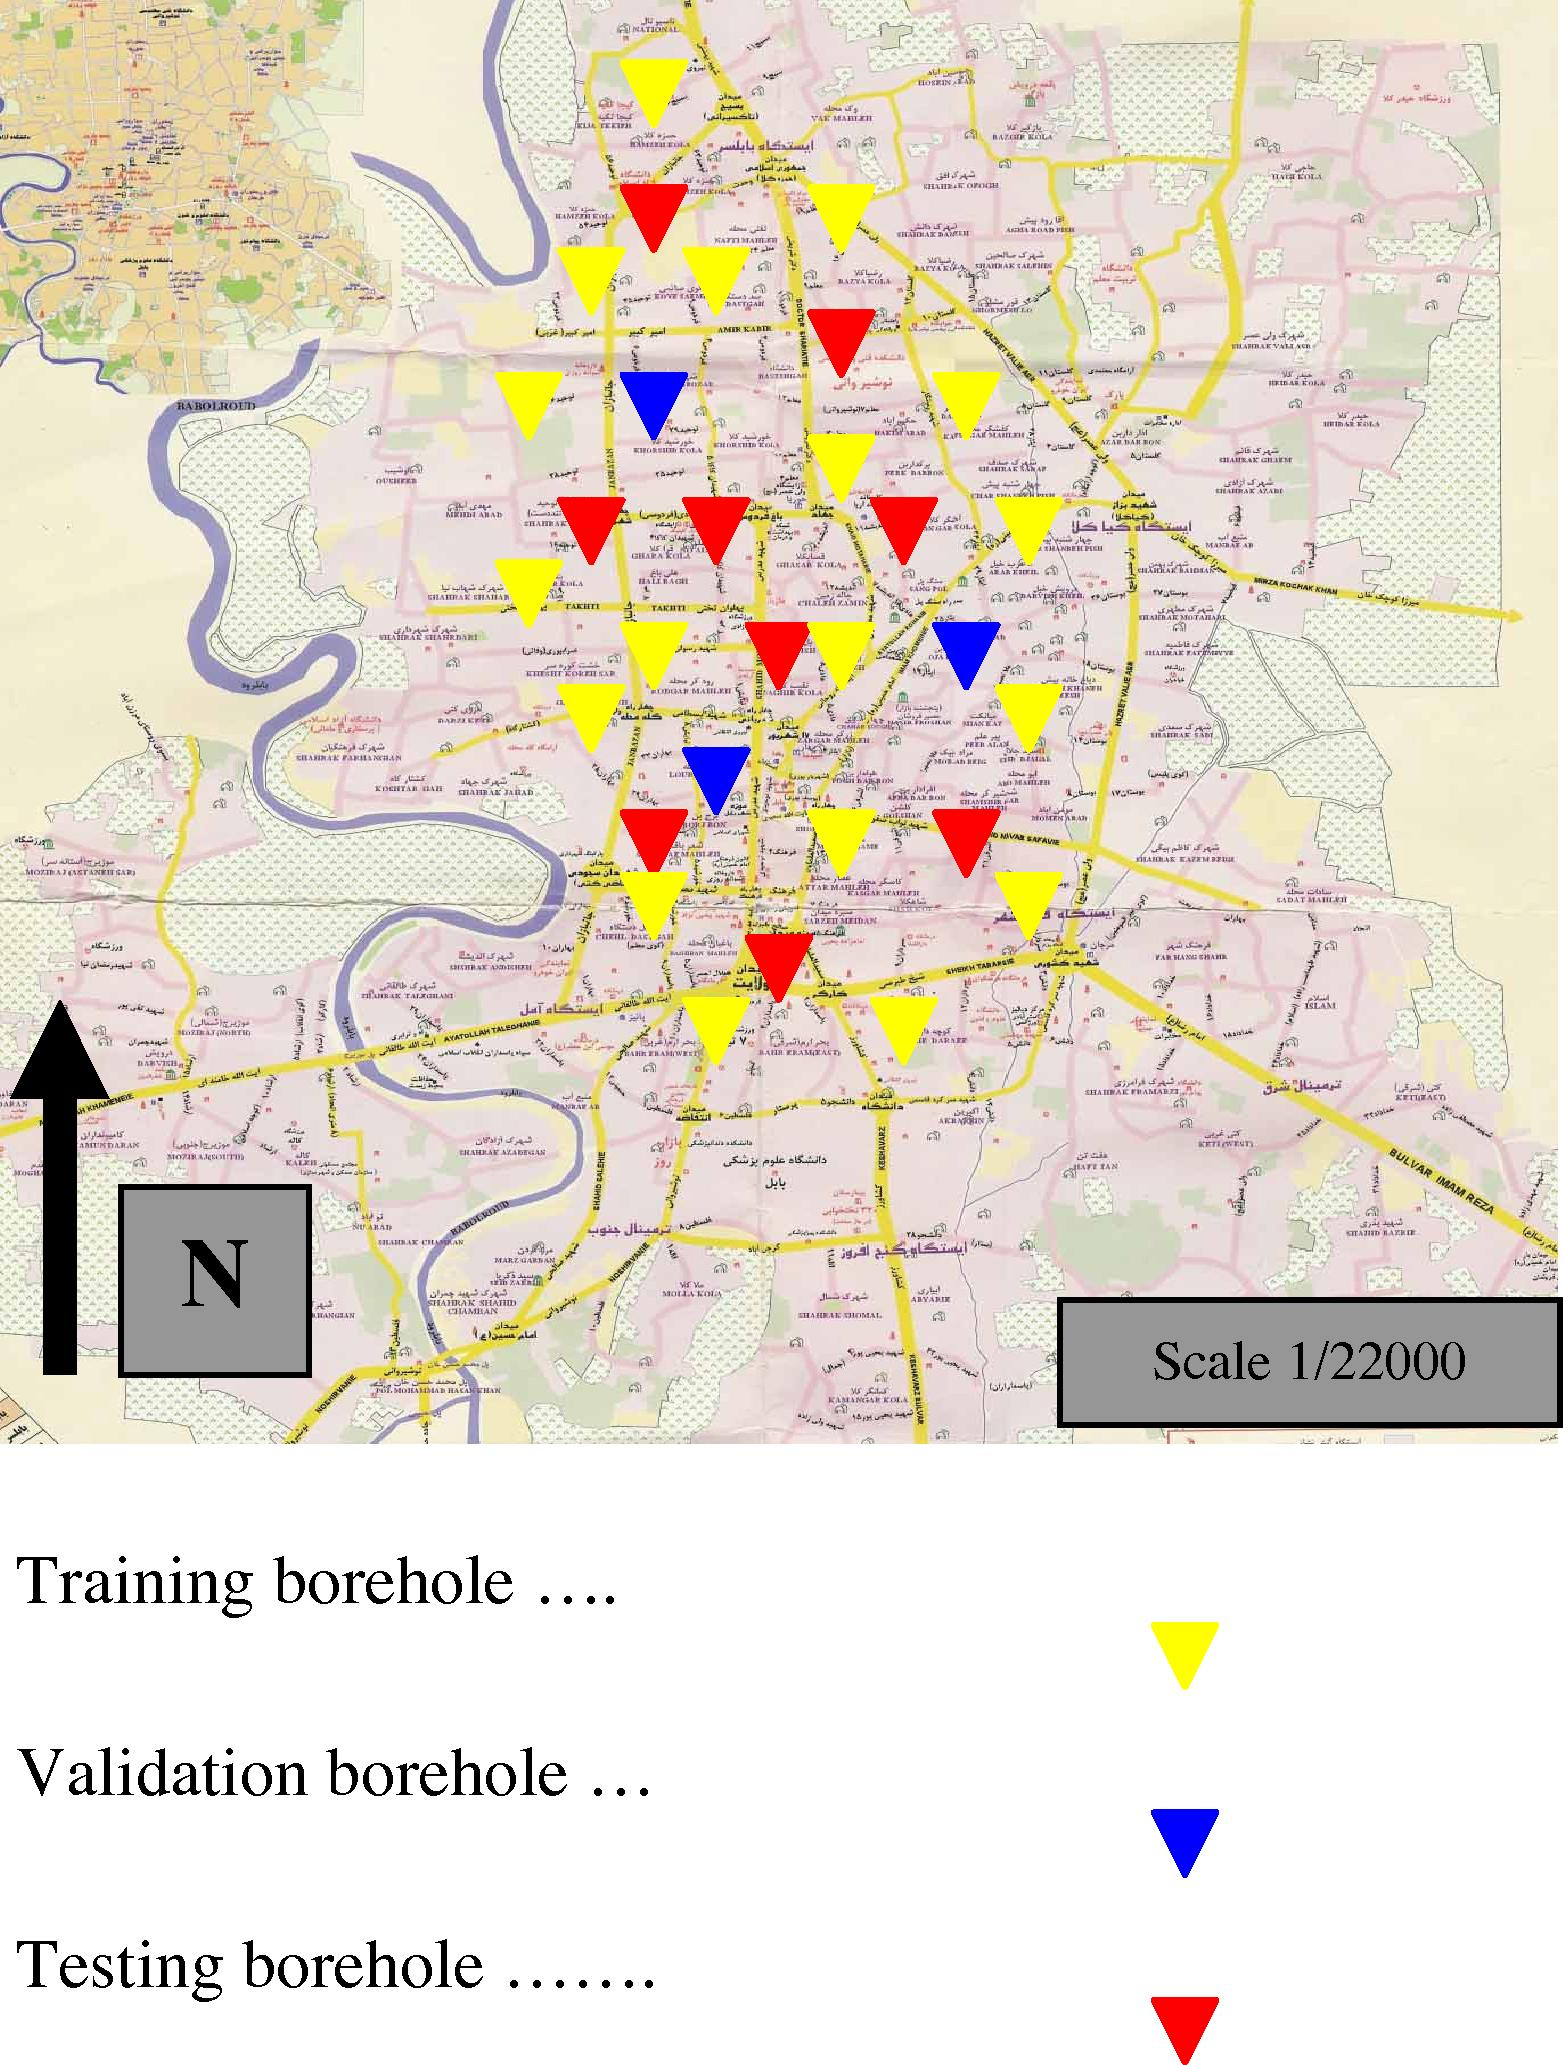
The 6 zones in Babol area.
From the total of 40 raw borehole data, only 30 logs with a depth range of 10–30 m were acceptable for using in ANN model. The regular tests were performed on the samples.
The available data set is divided into three sets, namely training, validation, and test sets, based on random selection. By this division the validity of the model could be examined in a more comprehensive manner. In ANN forecasting models, 60% of the records are selected as training, 30% are taken for test for final evaluation, and the remaining 10% are used for validation or monitoring the performance of the model during the training phase (Table 1).
Training set
Validation set
Testing set
Number of boreholes
18
3
9
Number of data (I/O data pairs)
1500
250
750
In problems dealing with different variables and with different ranges and dimensions, the application of several networks may be a good choice. Neural networks are efficient tools when used as pattern classifiers, it is important to properly select the input variables for training (learning) process of ANNs, as the way how to determine relationships between input and output variables. A set of known input and output values is named as input–output pair. All such pairs are usually divided into three sets. The first and second are described as training and validation sets which are used to determine the connection weights or weighting coefficients (like in interpolation methods), usually marked as wij1, also the training and validation sets are used during the training process and the test set is used for obtaining the estimates. All ANN models were trained using the automated regularization algorithm to improve generalization. The validation set served as a constraint on training, in order to minimize over fitting.
The usefulness of the neural network approach for populating the similarity model is presented in this case study. The inputs to the network were data on a set of soil formative environmental factors; the output from the network was a set of similarity values to a set of prescribed soil liquefaction potential. A set of 2500 samplings are performed in the study area from 30 boreholes. Data are collected using geotechnical investigation. Each sample is carefully checked, because to ensure the accurate prediction of an ANN model we need to build a reliable training, validating and testing sets.
In this analysis, based on the available data and their quality, a neural network program written in back-propagation algorithm is used. Six soil and seismic parameters are selected as input in different models, and these parameters are divided into data groups. Each data group is introduced to the network individually, and performance of the network on the assessment of liquefaction potential is investigated. The network predictions are compared with the conventional liquefaction determination method proposed by Seed et al.
Back-propagation algorithm is selected as the training algorithm for neural network (Table 2). It is the best known training algorithm for multilayer perceptrons neural networks, and still one of the most useful and later improved in some advanced forms like RProp. Back-propagation algorithm means that the network training includes determination of the difference between true and wanted network response, i.e. means calculation of error that is backed in the neural network for obtaining optimal training. It has lower memory requirements than most algorithms, and usually reaches an acceptable estimation error quite quickly (in relative low number of iterations or epochs).
Model #
1
2
3
Input
M, Soil type, σ, σ′,
,
M,
,
,
, σ, soil type
,
,
, σ,
MSE
8%
10%
16%
The ANN model for this study was developed, trained, validated and tested within STATISTICA computational environment utilizing the neural network toolbox. And the accuracy of the ANN model was evaluated using RMSE between measured and predicted values and pressed as:
In the selection of learning/training algorithm, number of neurons in different layers (input, hidden, output), number of epochs, learning rate and the momentum have been applied instantly (Fig. 6).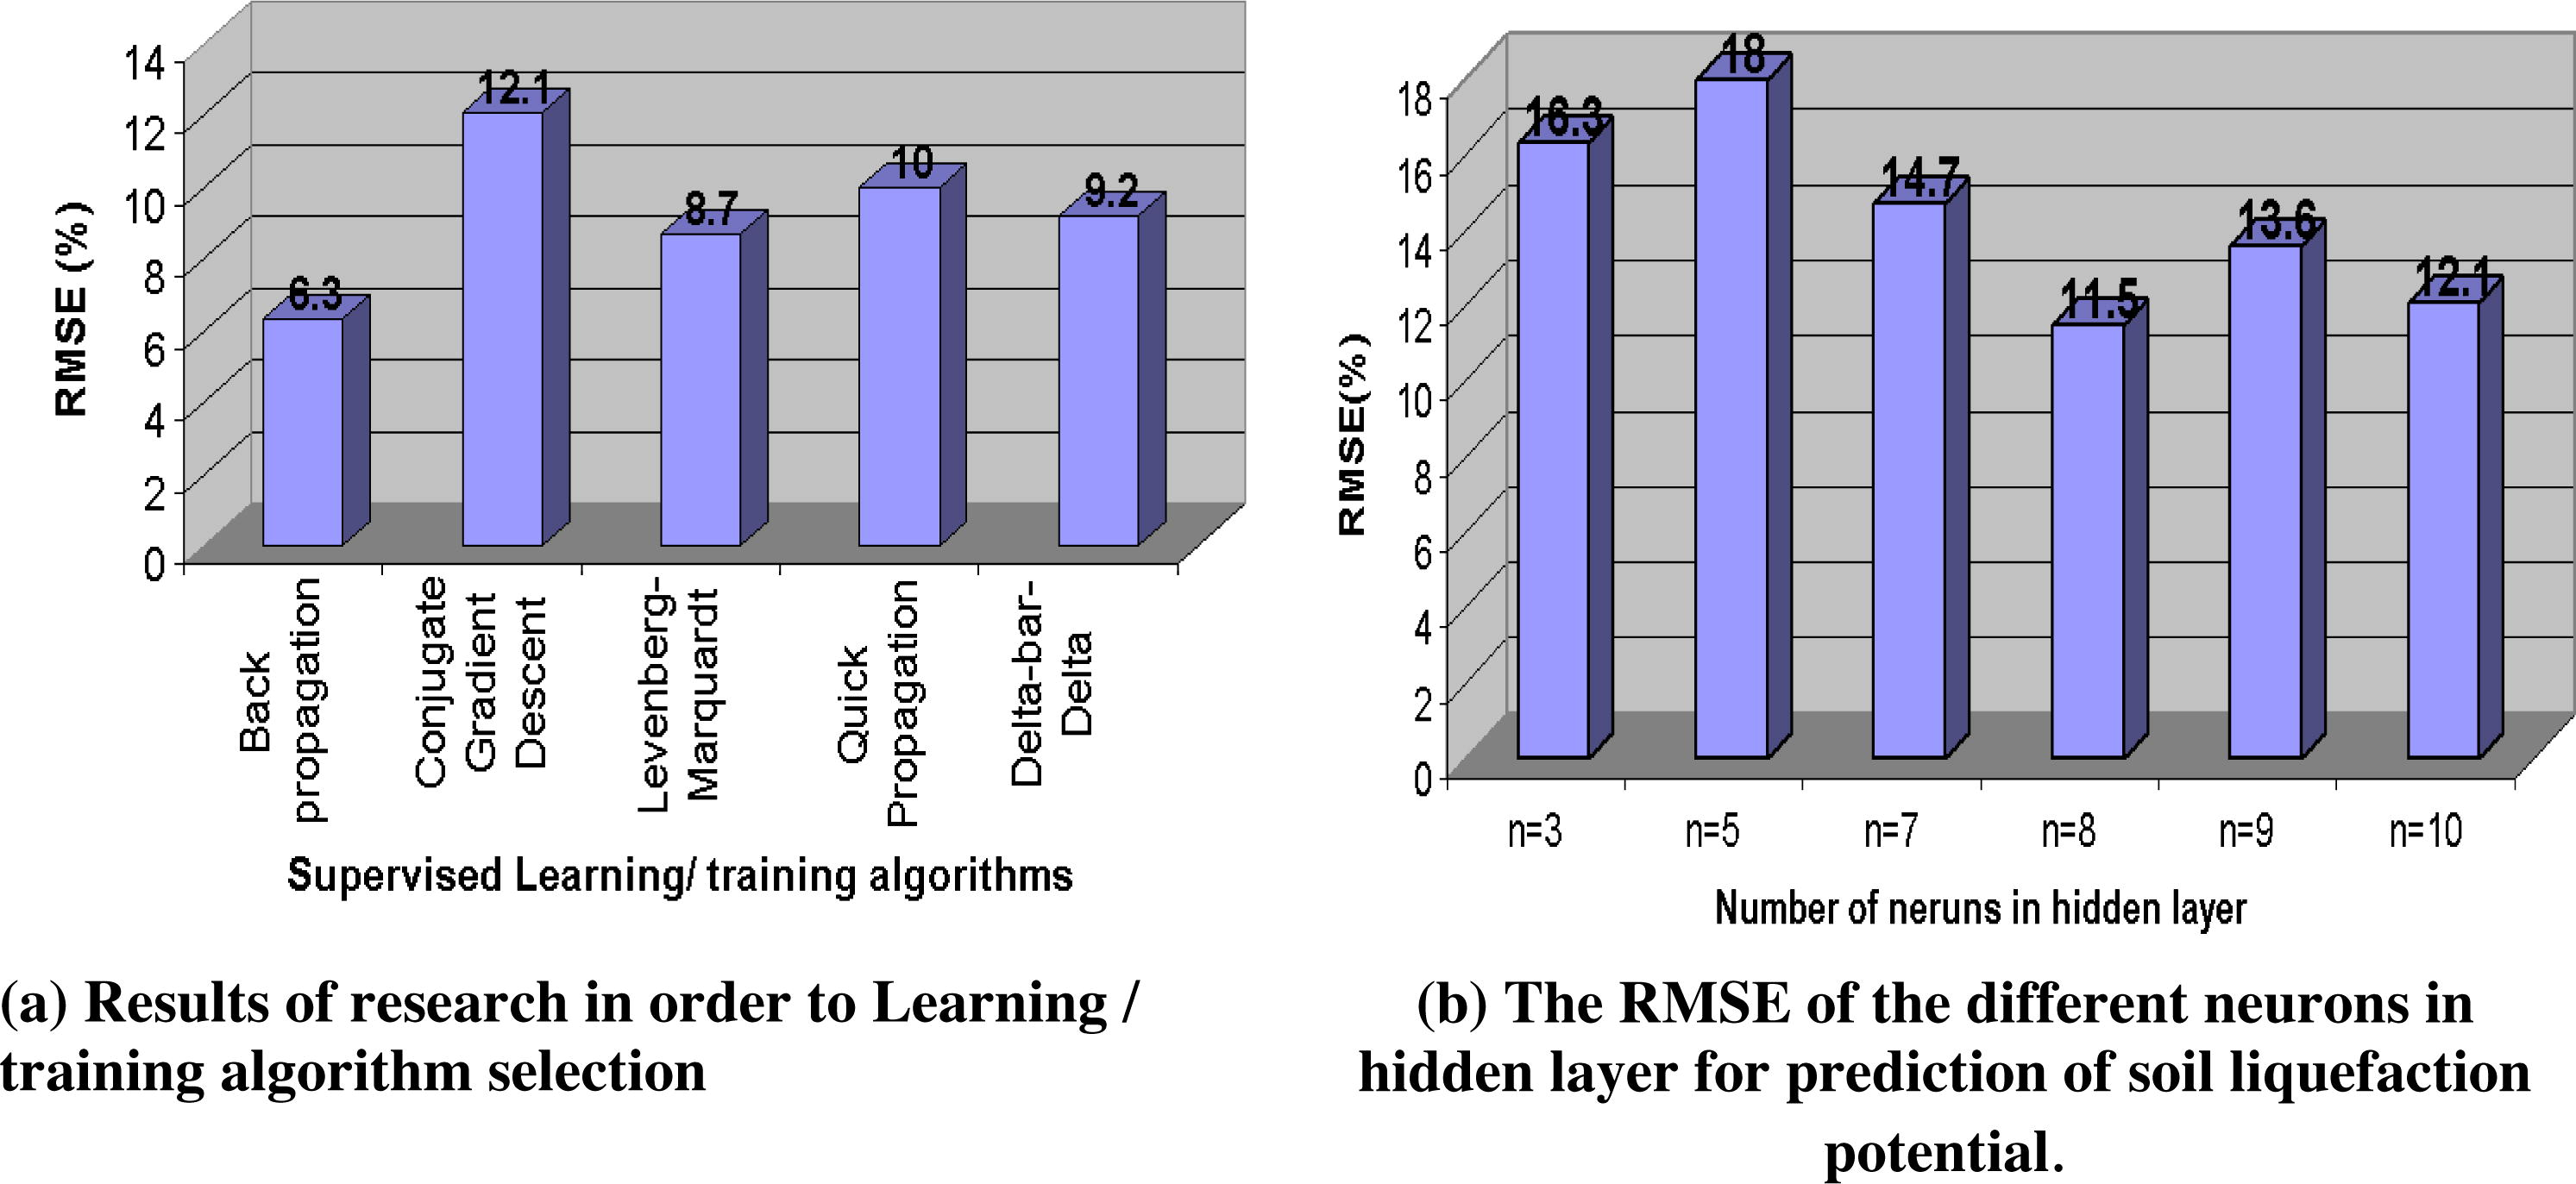
Network selection.
In each epoch, the entire training set is fed through the network, and used to adjust the network weights. Not only numbers of epochs are specified at the start, but also alternative stopping criterion may be specified, and if over-trained network occurs the best network discovered during training can be retrieved. In this analysis, the number of epochs varied between 500 and 800.
An adaptive learning rate was employed to keep the learning step size as large as possible while the training is stable. According to a universal approximation theorem, demonstrated concurrently by several researchers for traditional MLP, a single hidden layer network is sufficient to uniformly approximate any continuous and nonlinear function. The model architecture was built with one hidden layer, a learning rate of 0.1 updated with a coefficient of 0.9 after each epoch and a momentum term of 0.9 updated with a coefficient of 1.05 after each epoch. The input vector is fully connected to the hidden neurons by a tan-sigmoid transfer function and the neurons of hidden layer are fully connected to the output layer via a linear function. Experimental studies were started with one hidden neurons to reach the optimum number of hidden neurons and desired precision. Input vector contains soil initial parameters and output (the target vector) is liquefaction potential. In order to obtain a more efficient training process, the input and target were standardized to have zero mean and unity standard deviation. Cross-validation or employing another set of data for more testing can be used to increase the generality of the models for future predictions. In this study, 10% of borehole data were used as validation set. In fact, several ANN models using element tests data were constituted for generating the models. Among them, the model with better performance (greater coefficient of determination and smaller RMSE) for validation data set was selected. In other words, the ANN models were developed with the best performance concurrently for training, testing and validation data sets. Three different ANN models were developed using different combinations of input parameters in. It can be seen from Table 2 that, except for model #1, performances of the models are generally improved when input parameters are increased.
3 Results and discussion
At the end of the training process, it is necessary to evaluate the capability of ANN model in prediction of liquefaction potential. For this purpose, the data of 3 boreholes which were not used in training of neural network was selected and the prediction of liquefaction potential by ANN model in each of these 3 boreholes was compared with Seed method. Fig. 7 shows the accuracy of ANN model in 3 mentioned boreholes.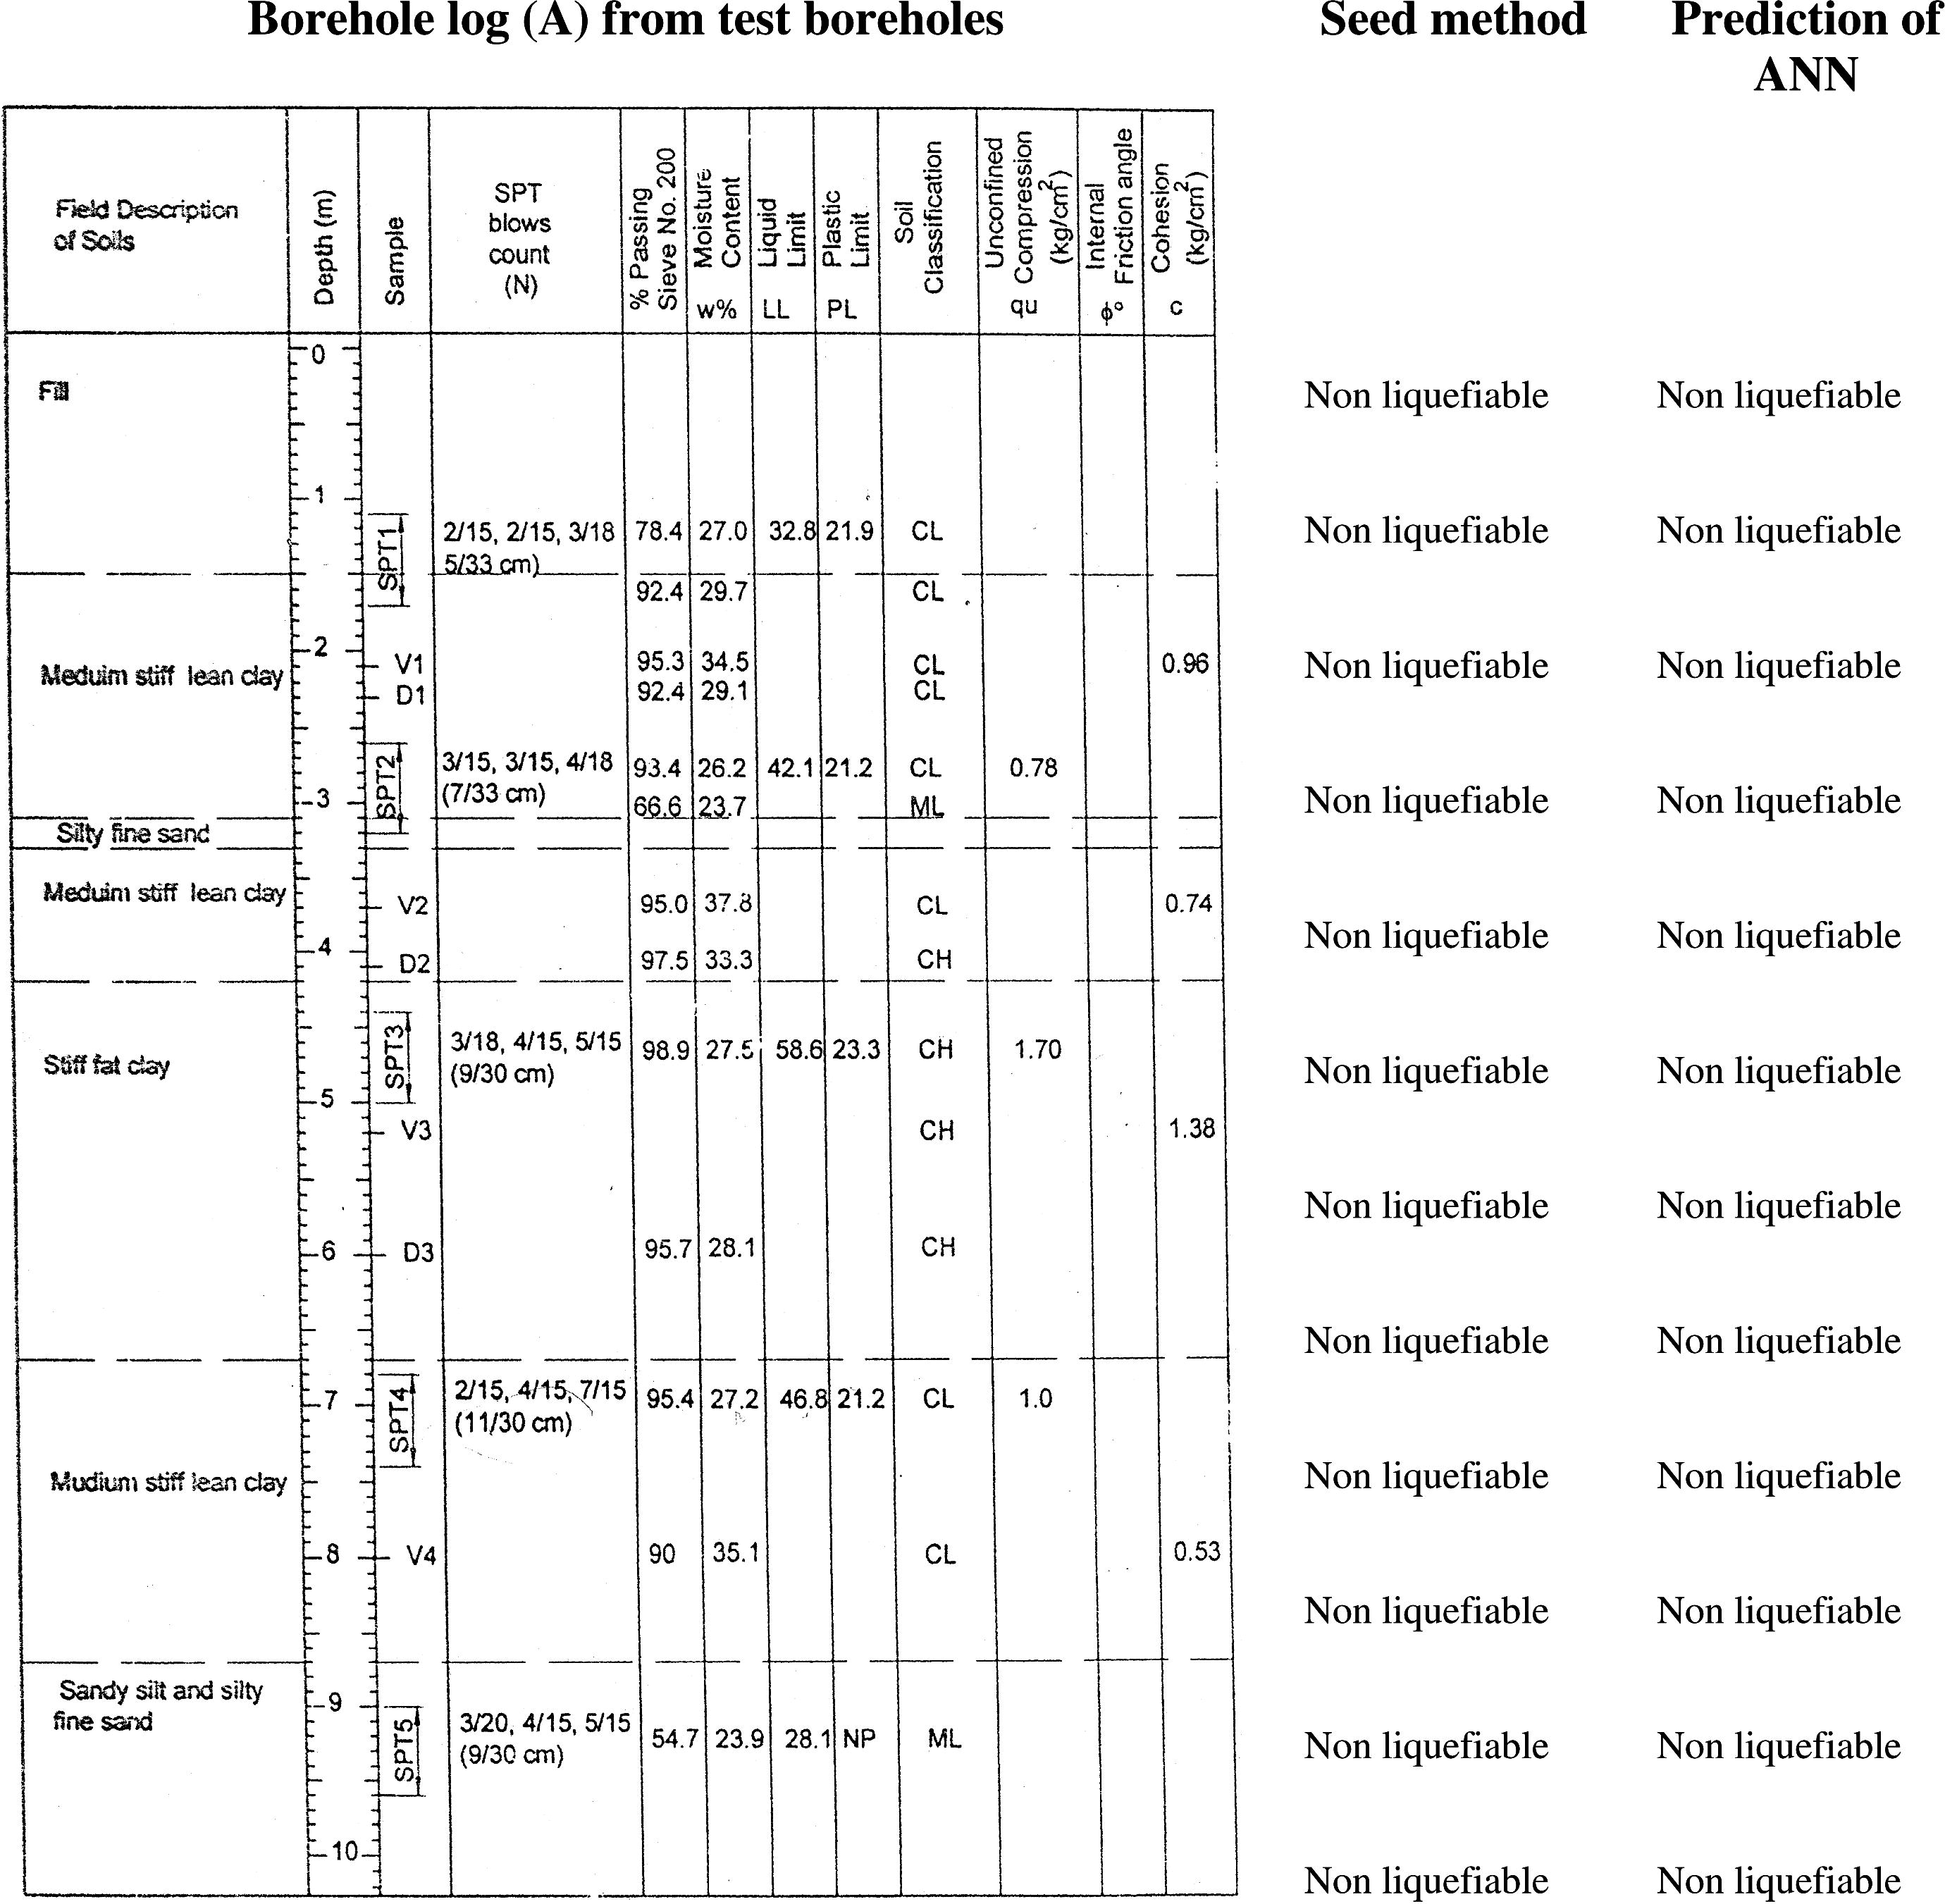
Results of ANN analysis for 3 random selected boreholes from test boreholes in study area.
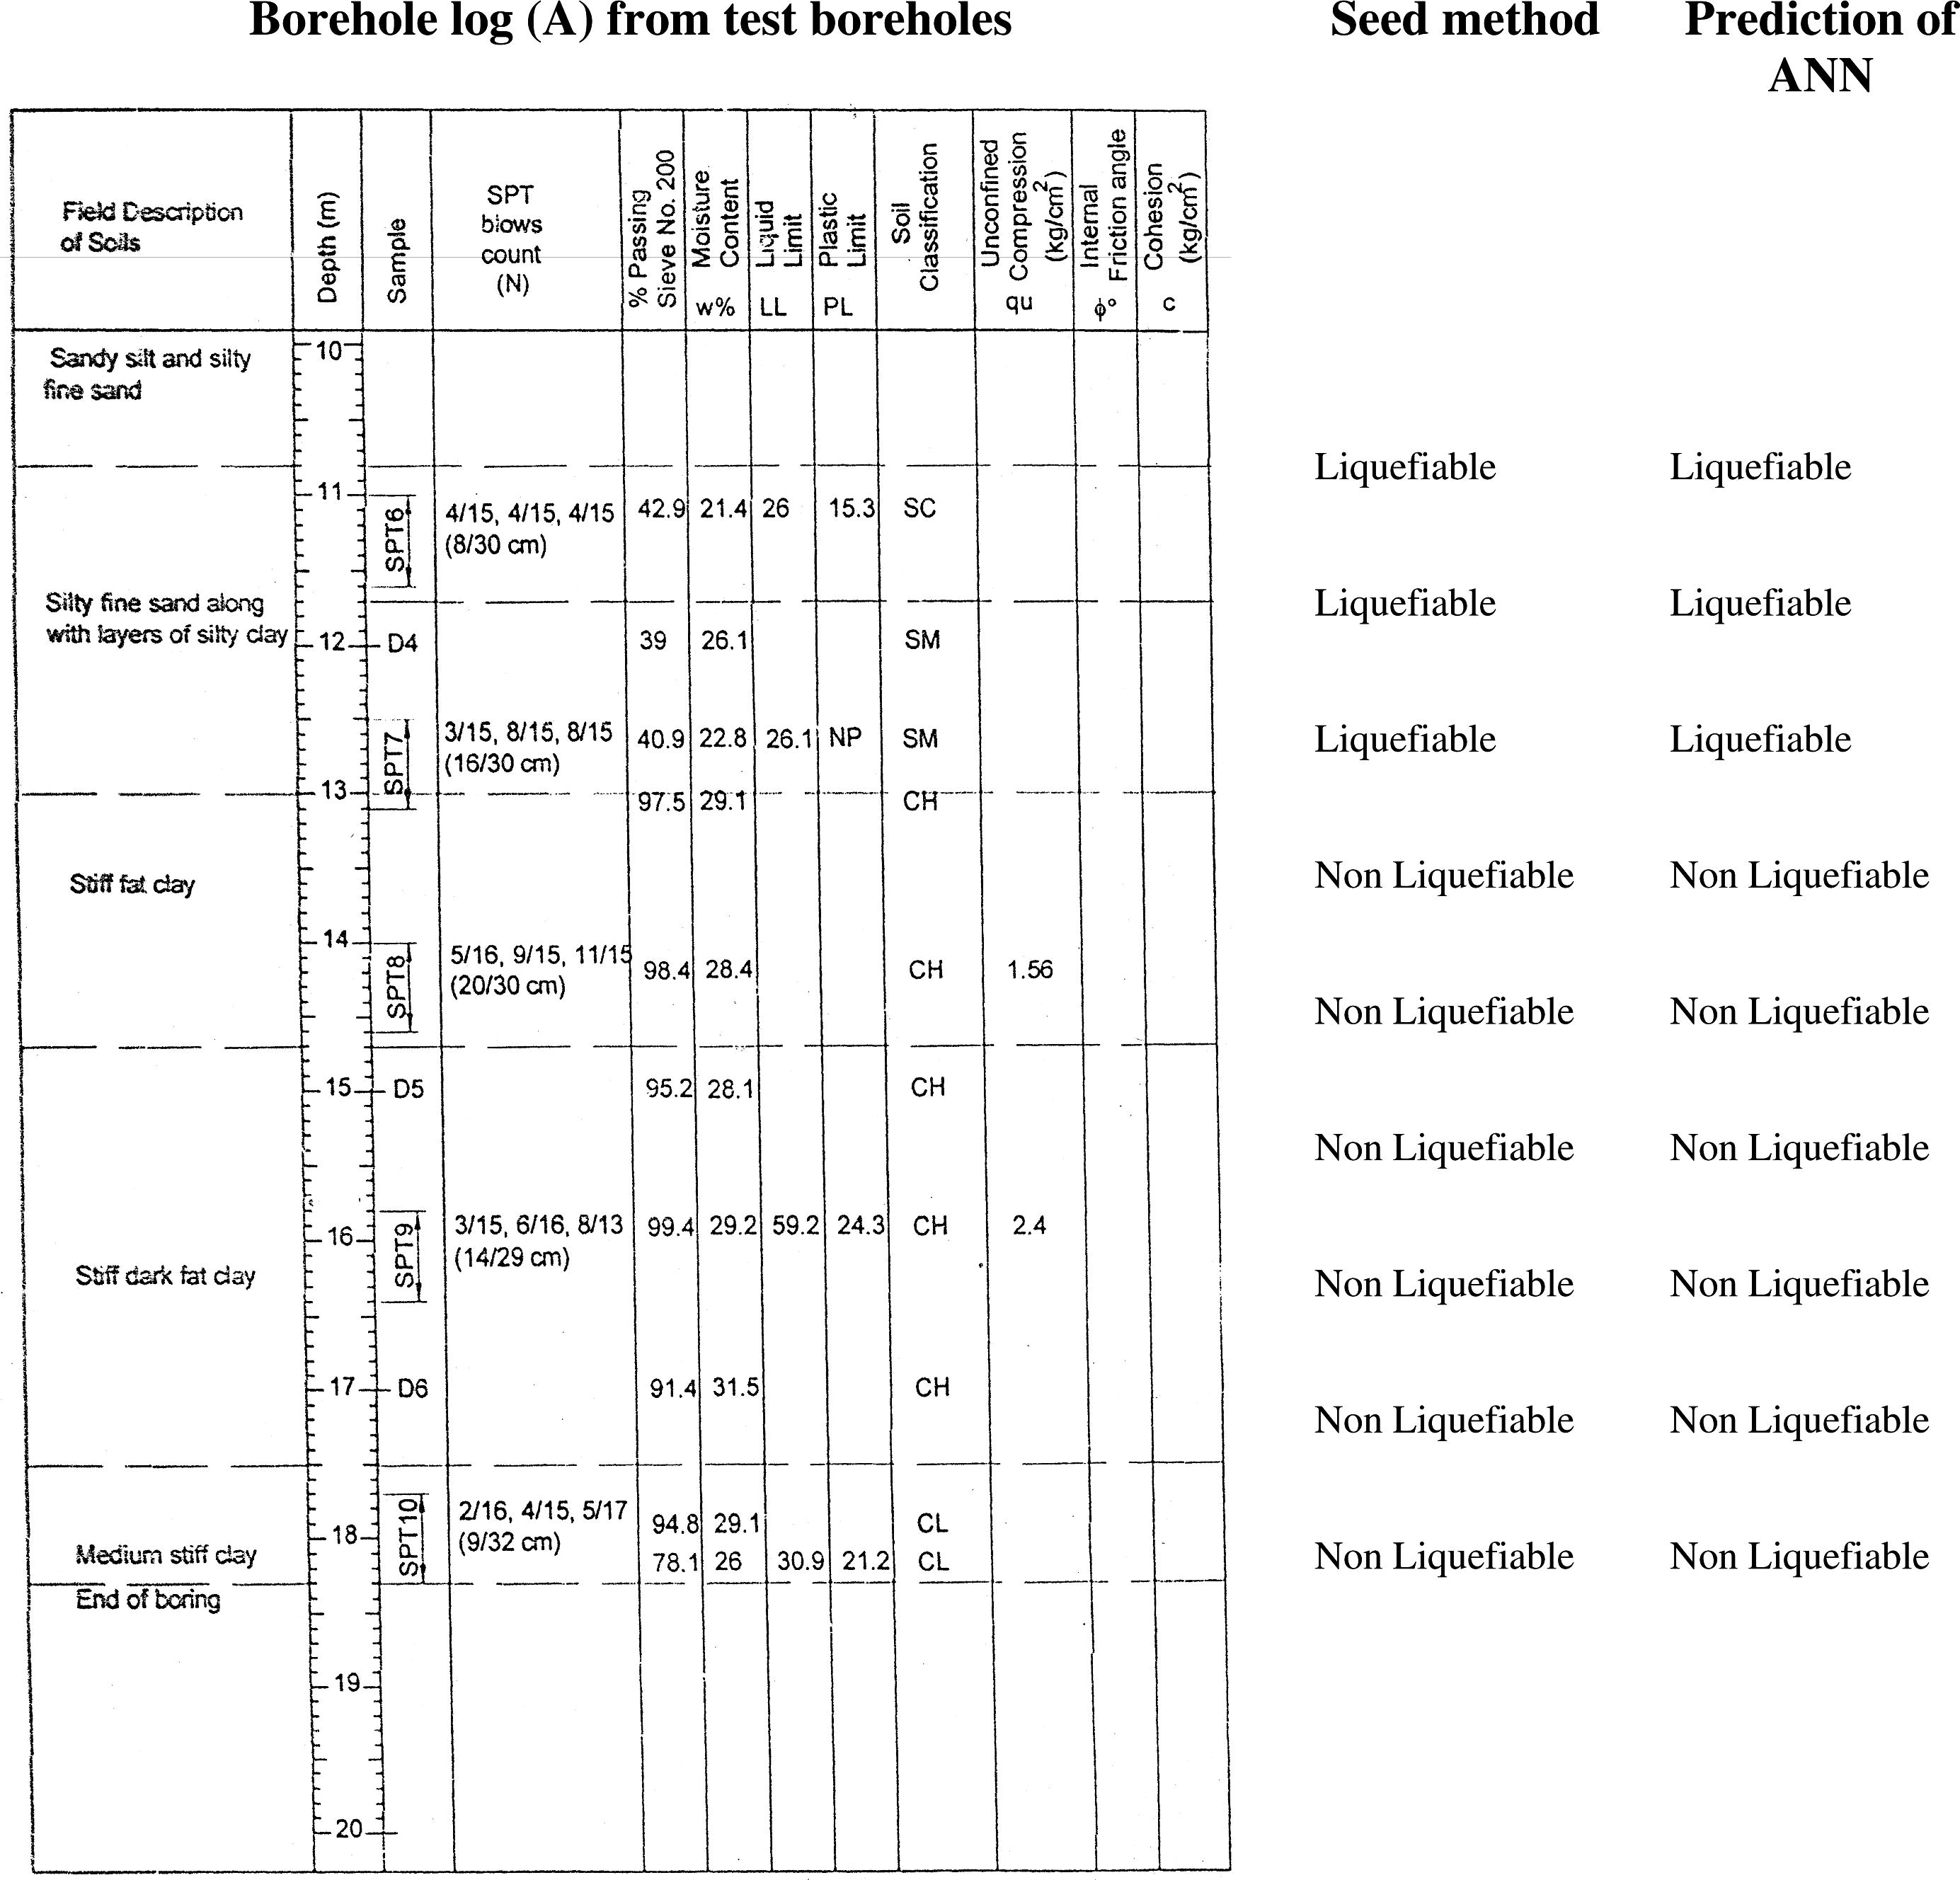
Results of ANN analysis for 3 random selected boreholes from test boreholes in study area.
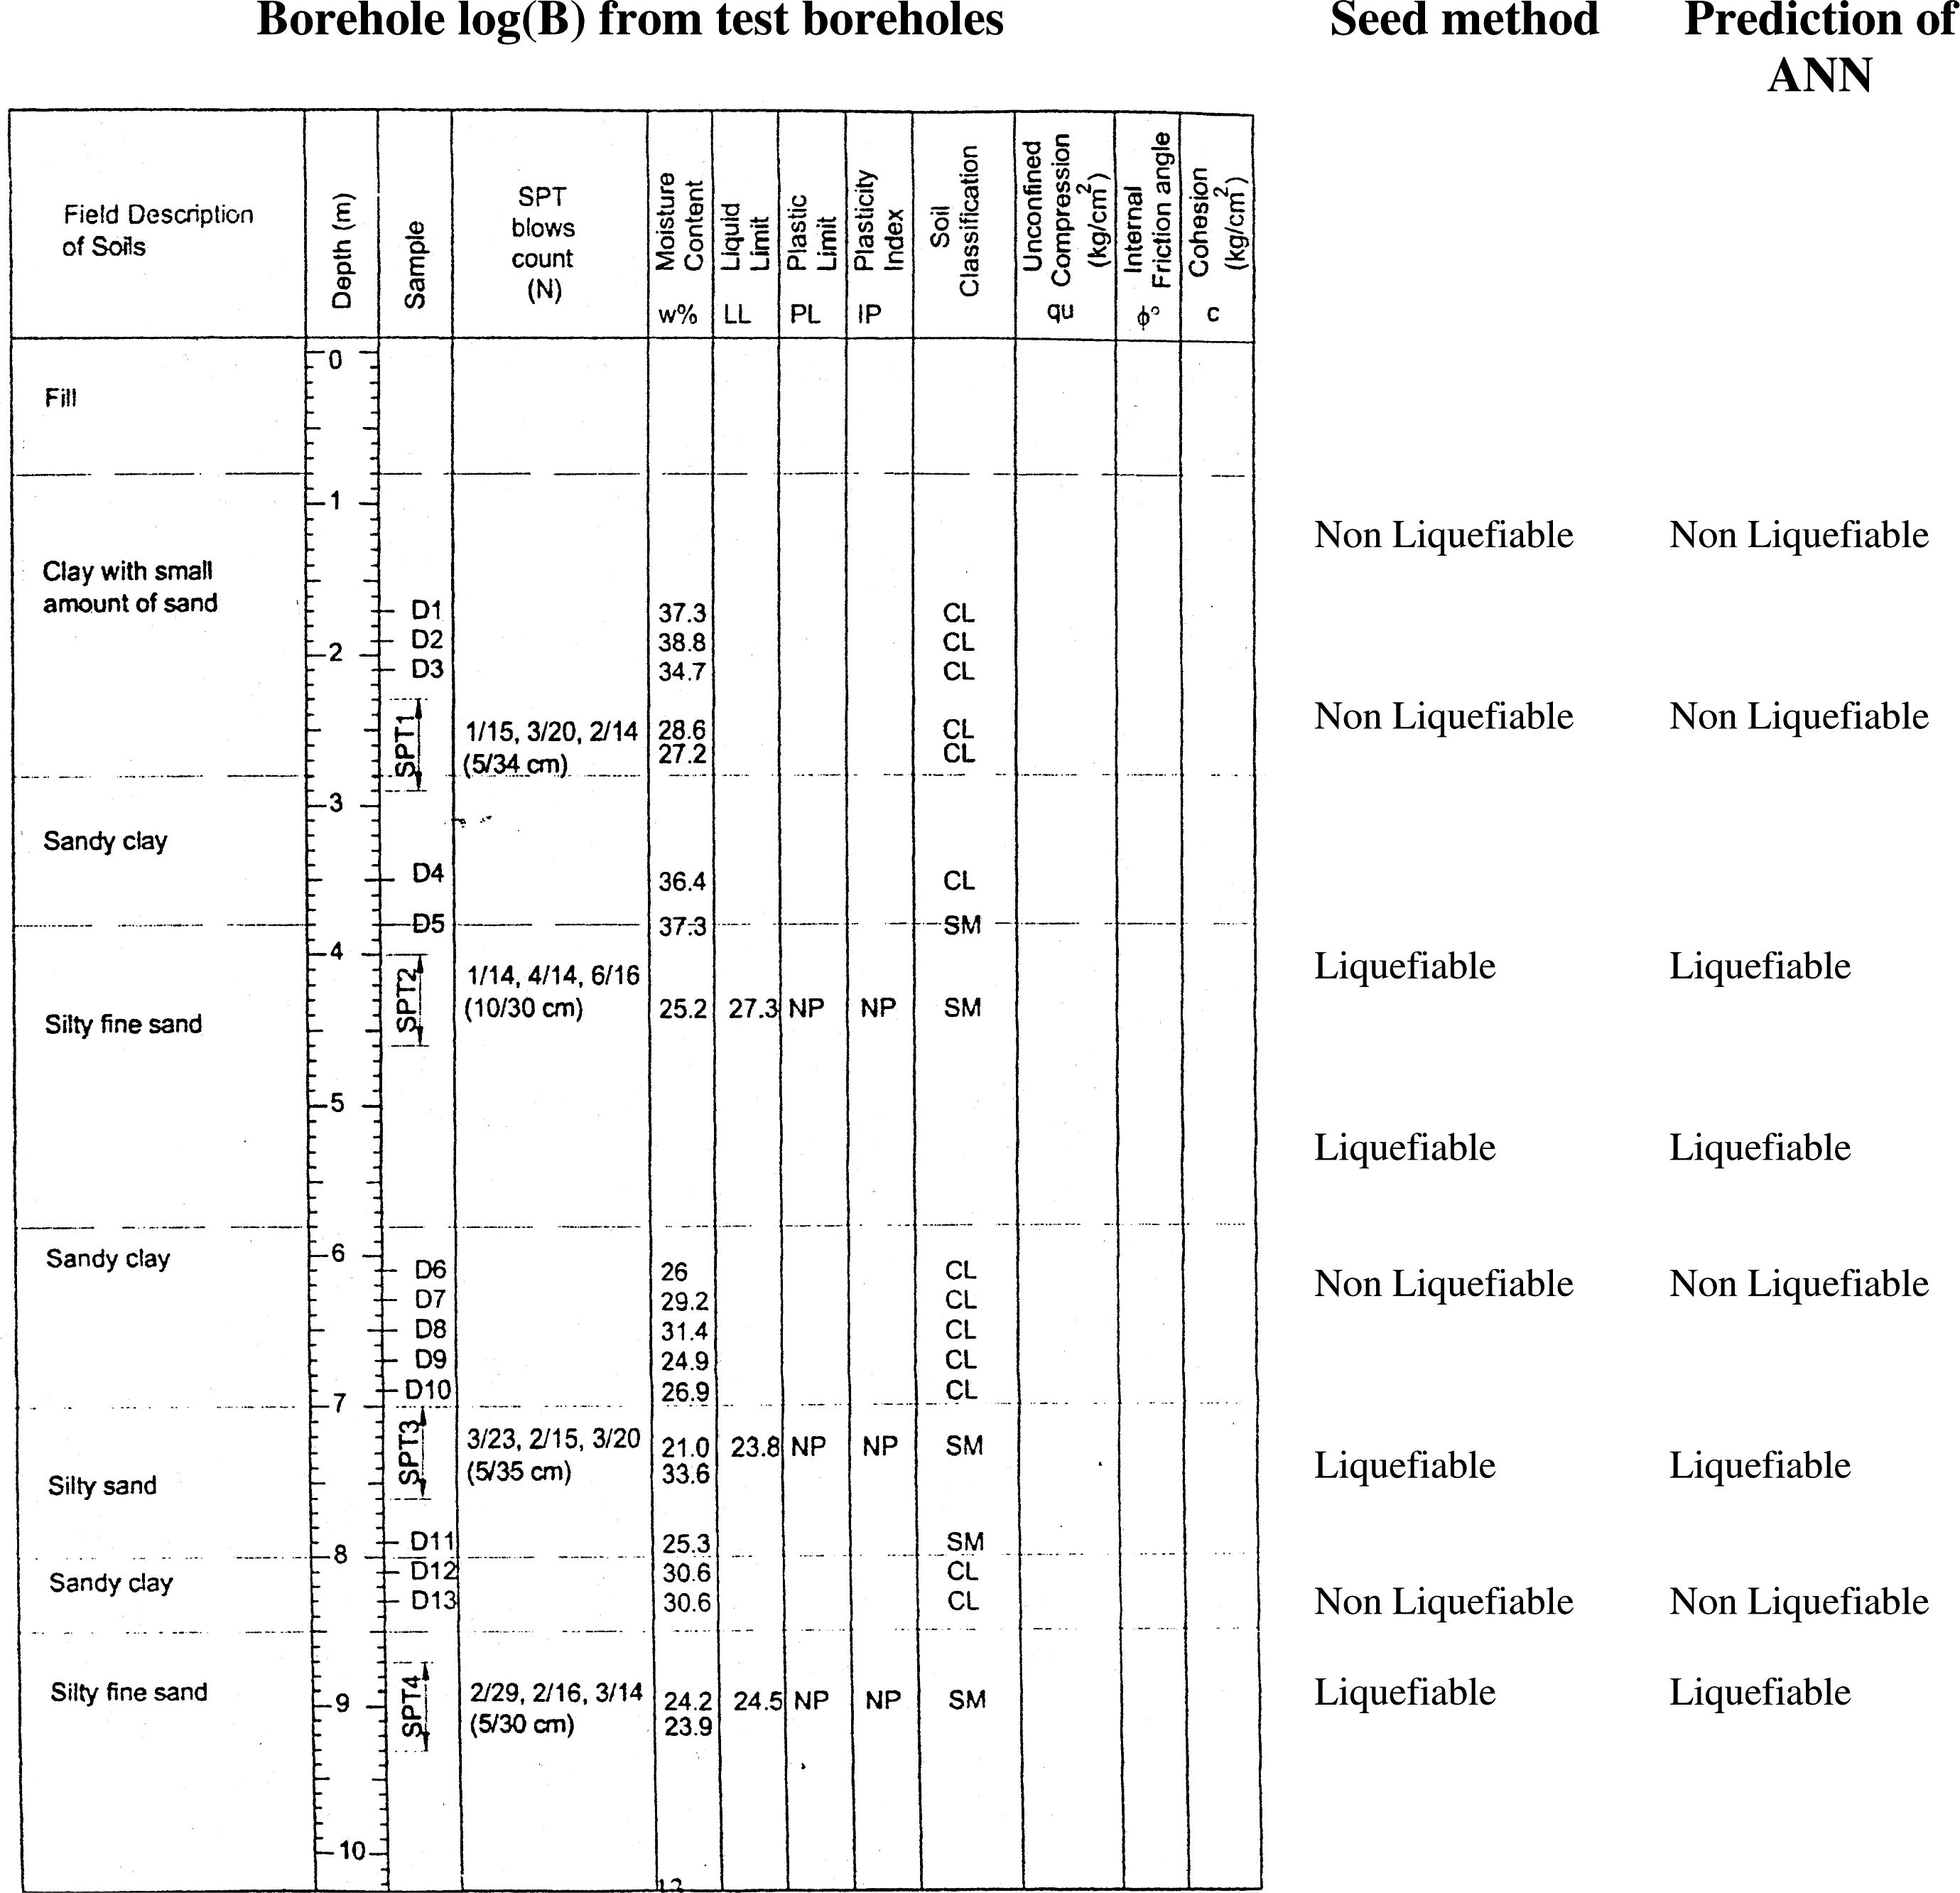
Results of ANN analysis for 3 random selected boreholes from test boreholes in study area.
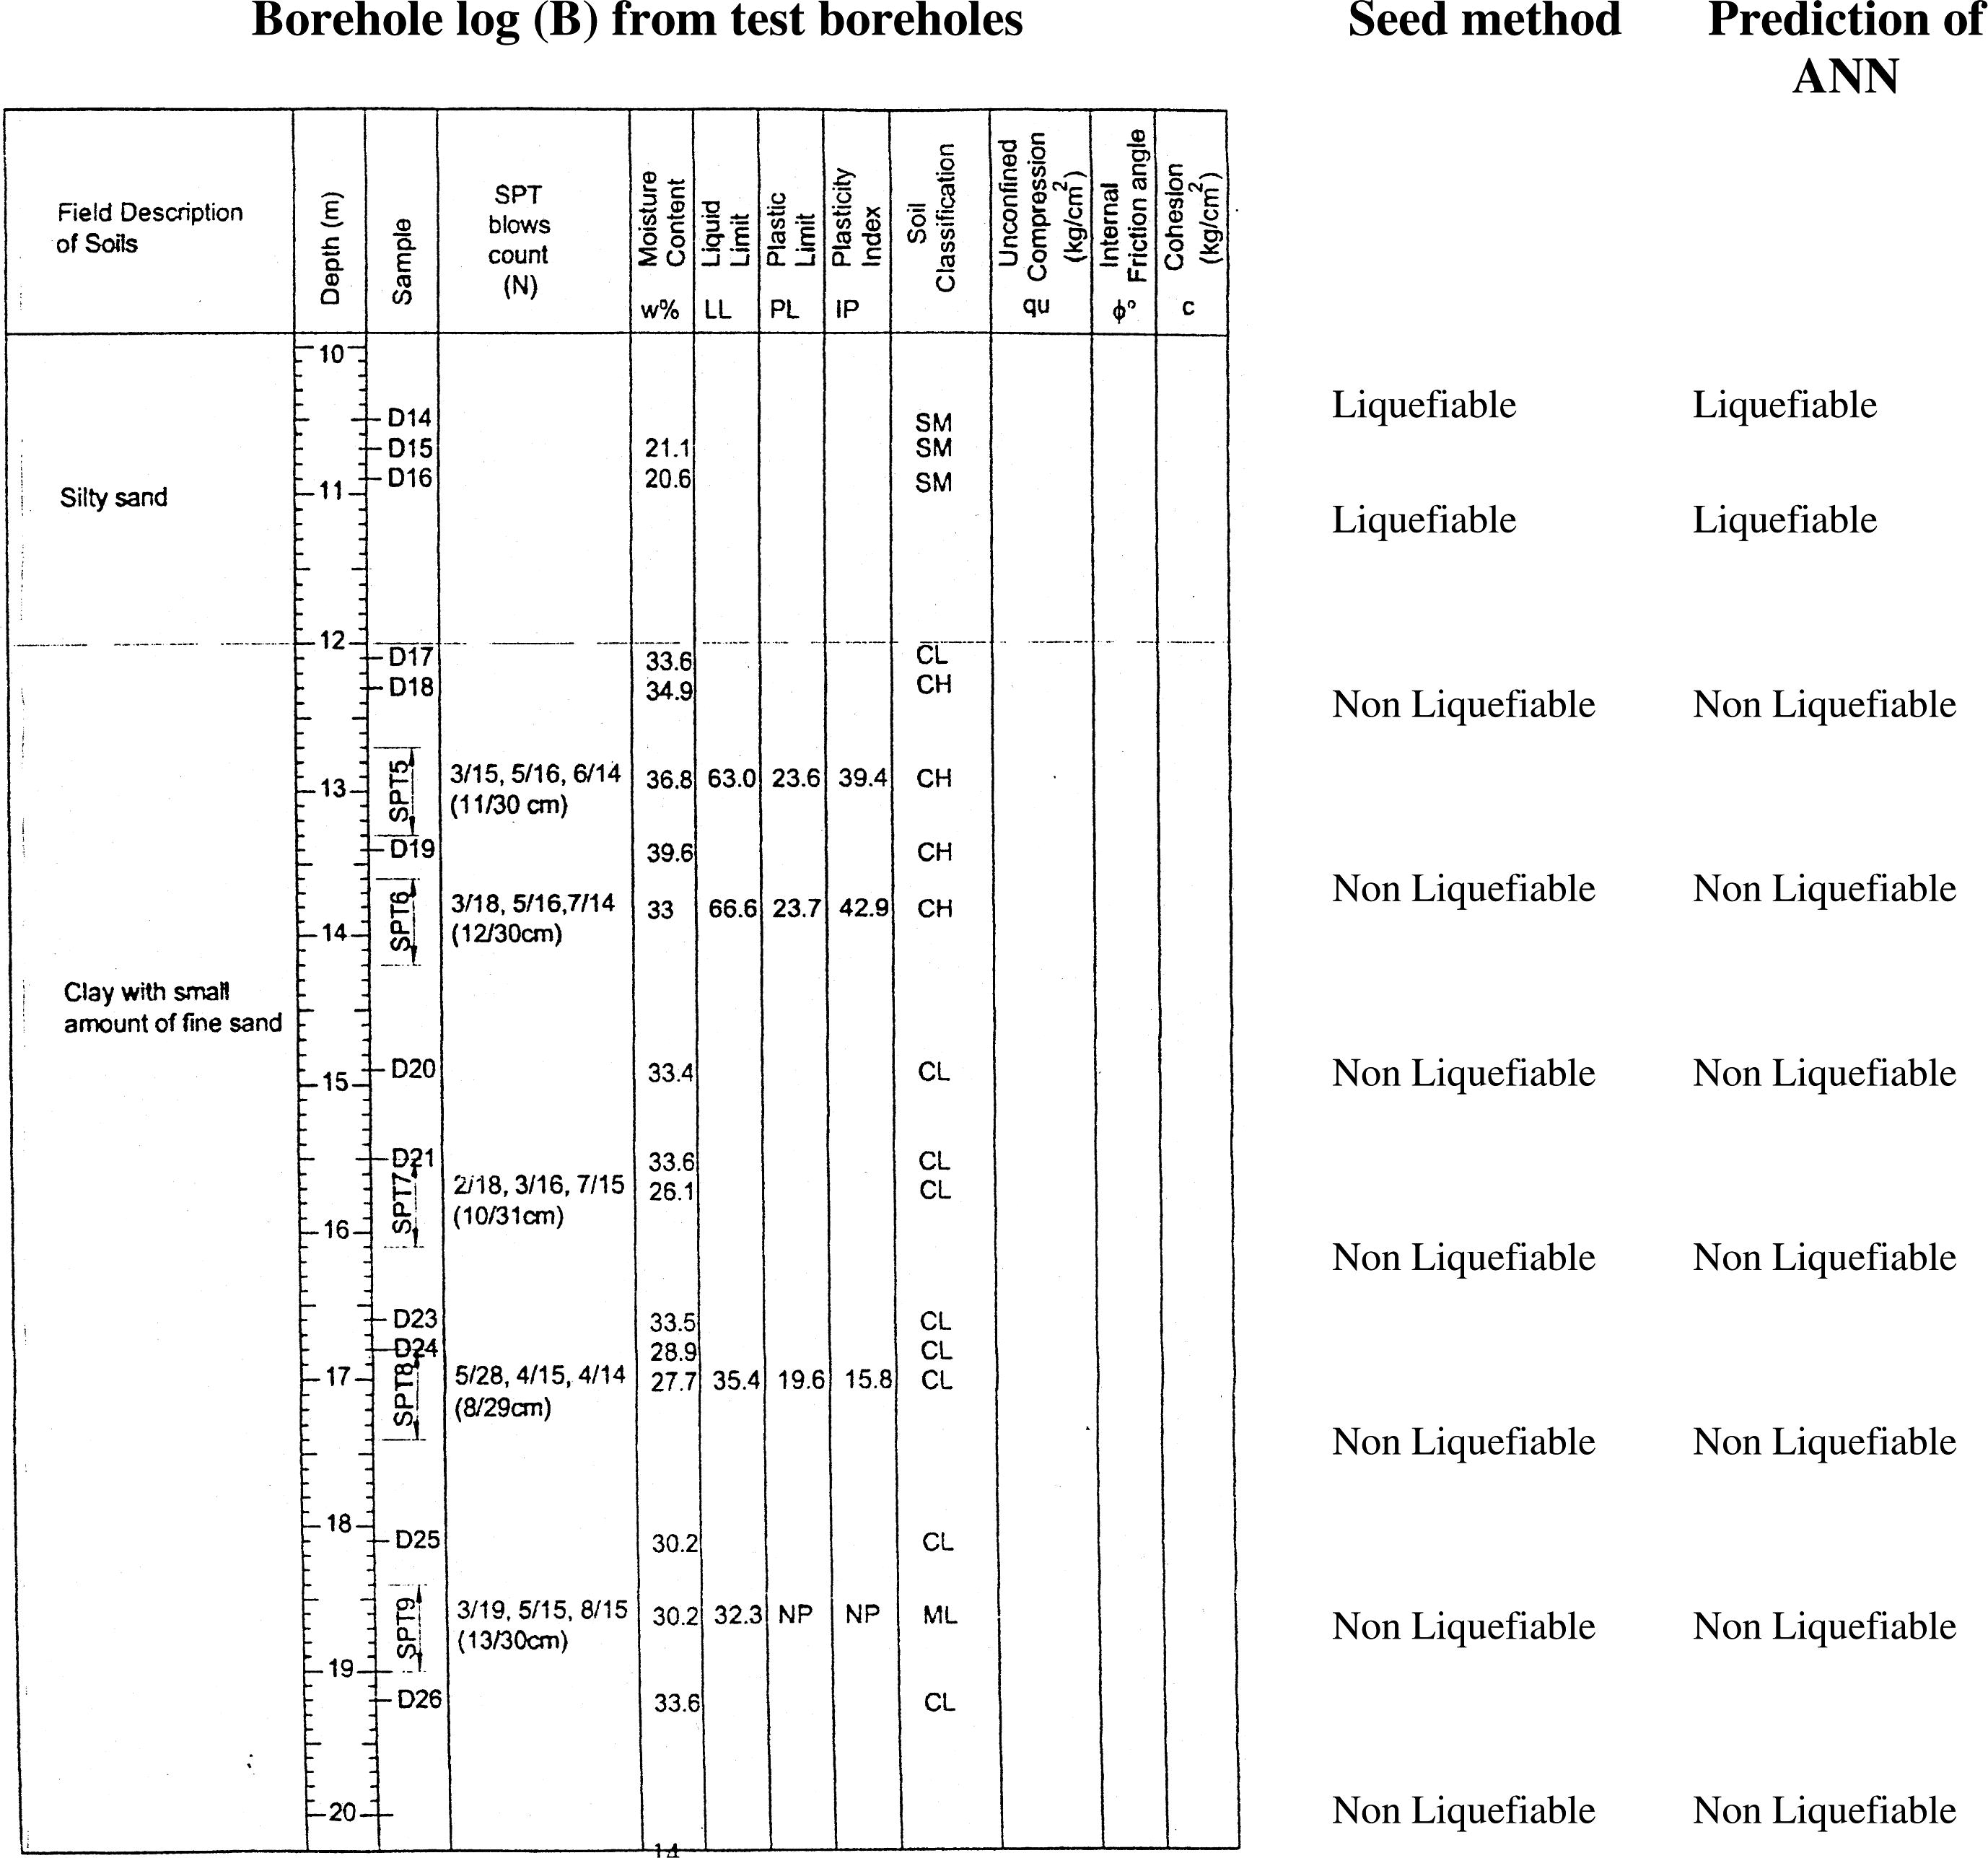
Results of ANN analysis for 3 random selected boreholes from test boreholes in study area.
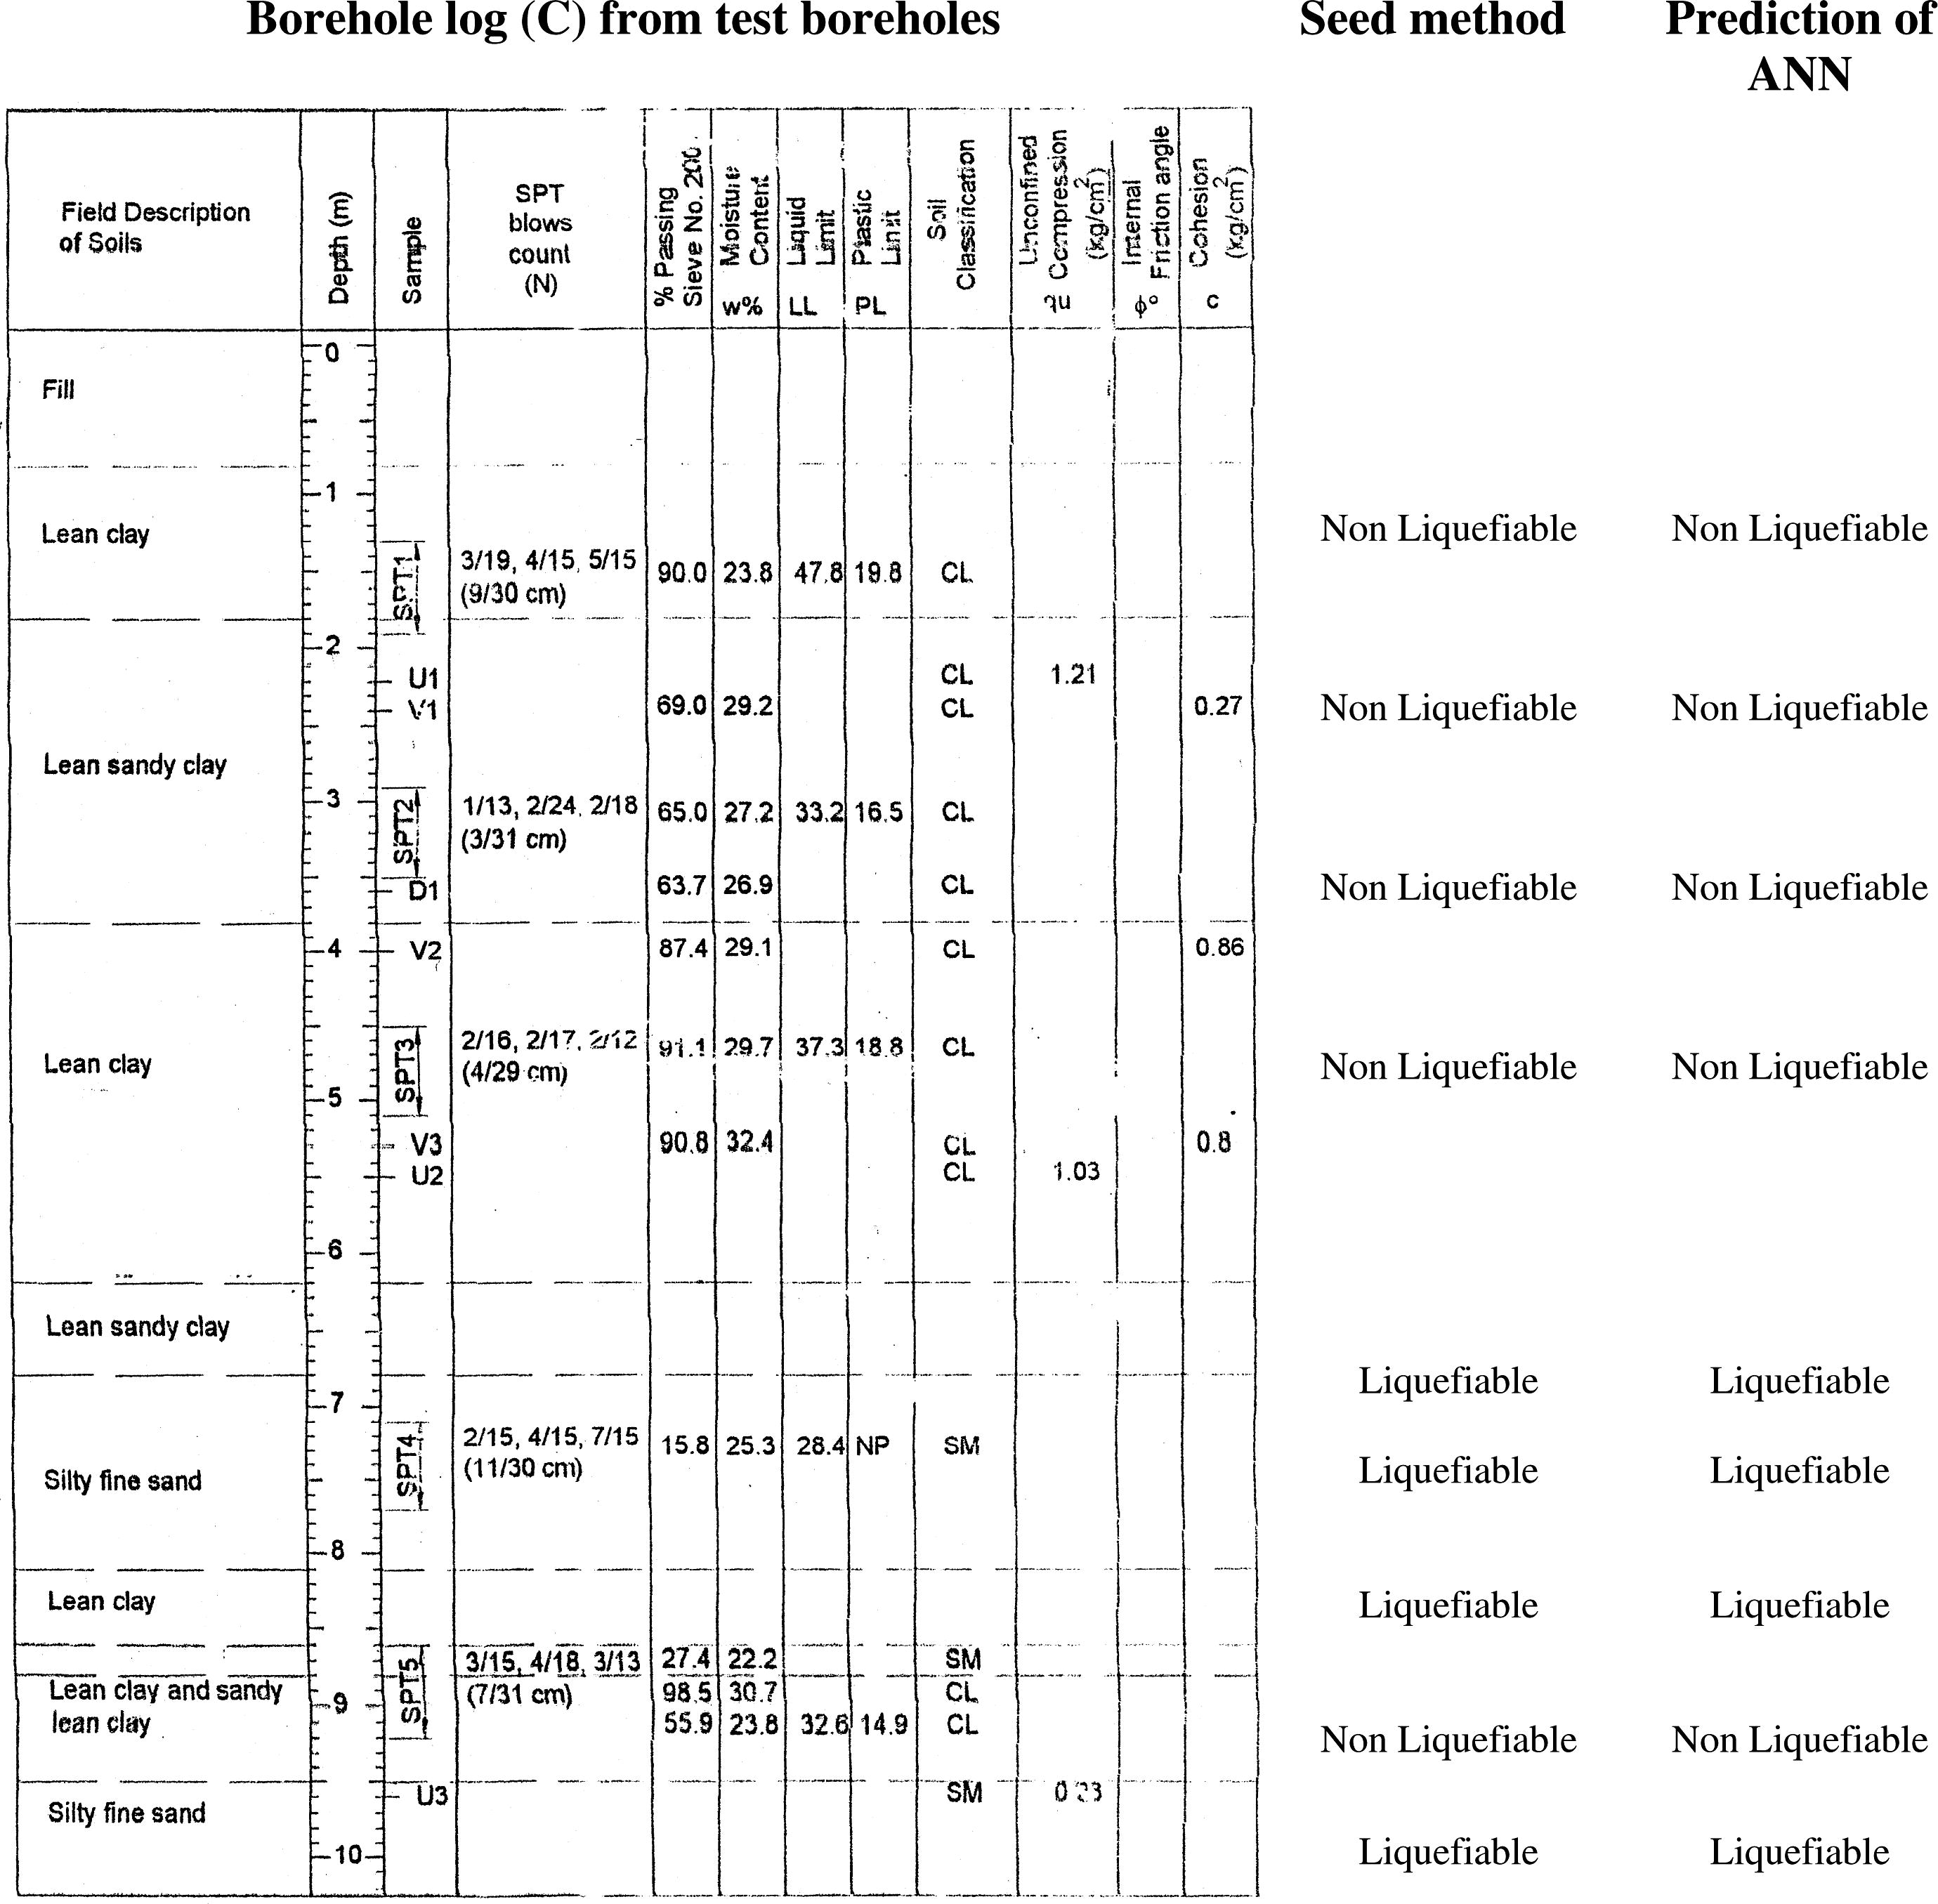
Results of ANN analysis for 3 random selected boreholes from test boreholes in study area.
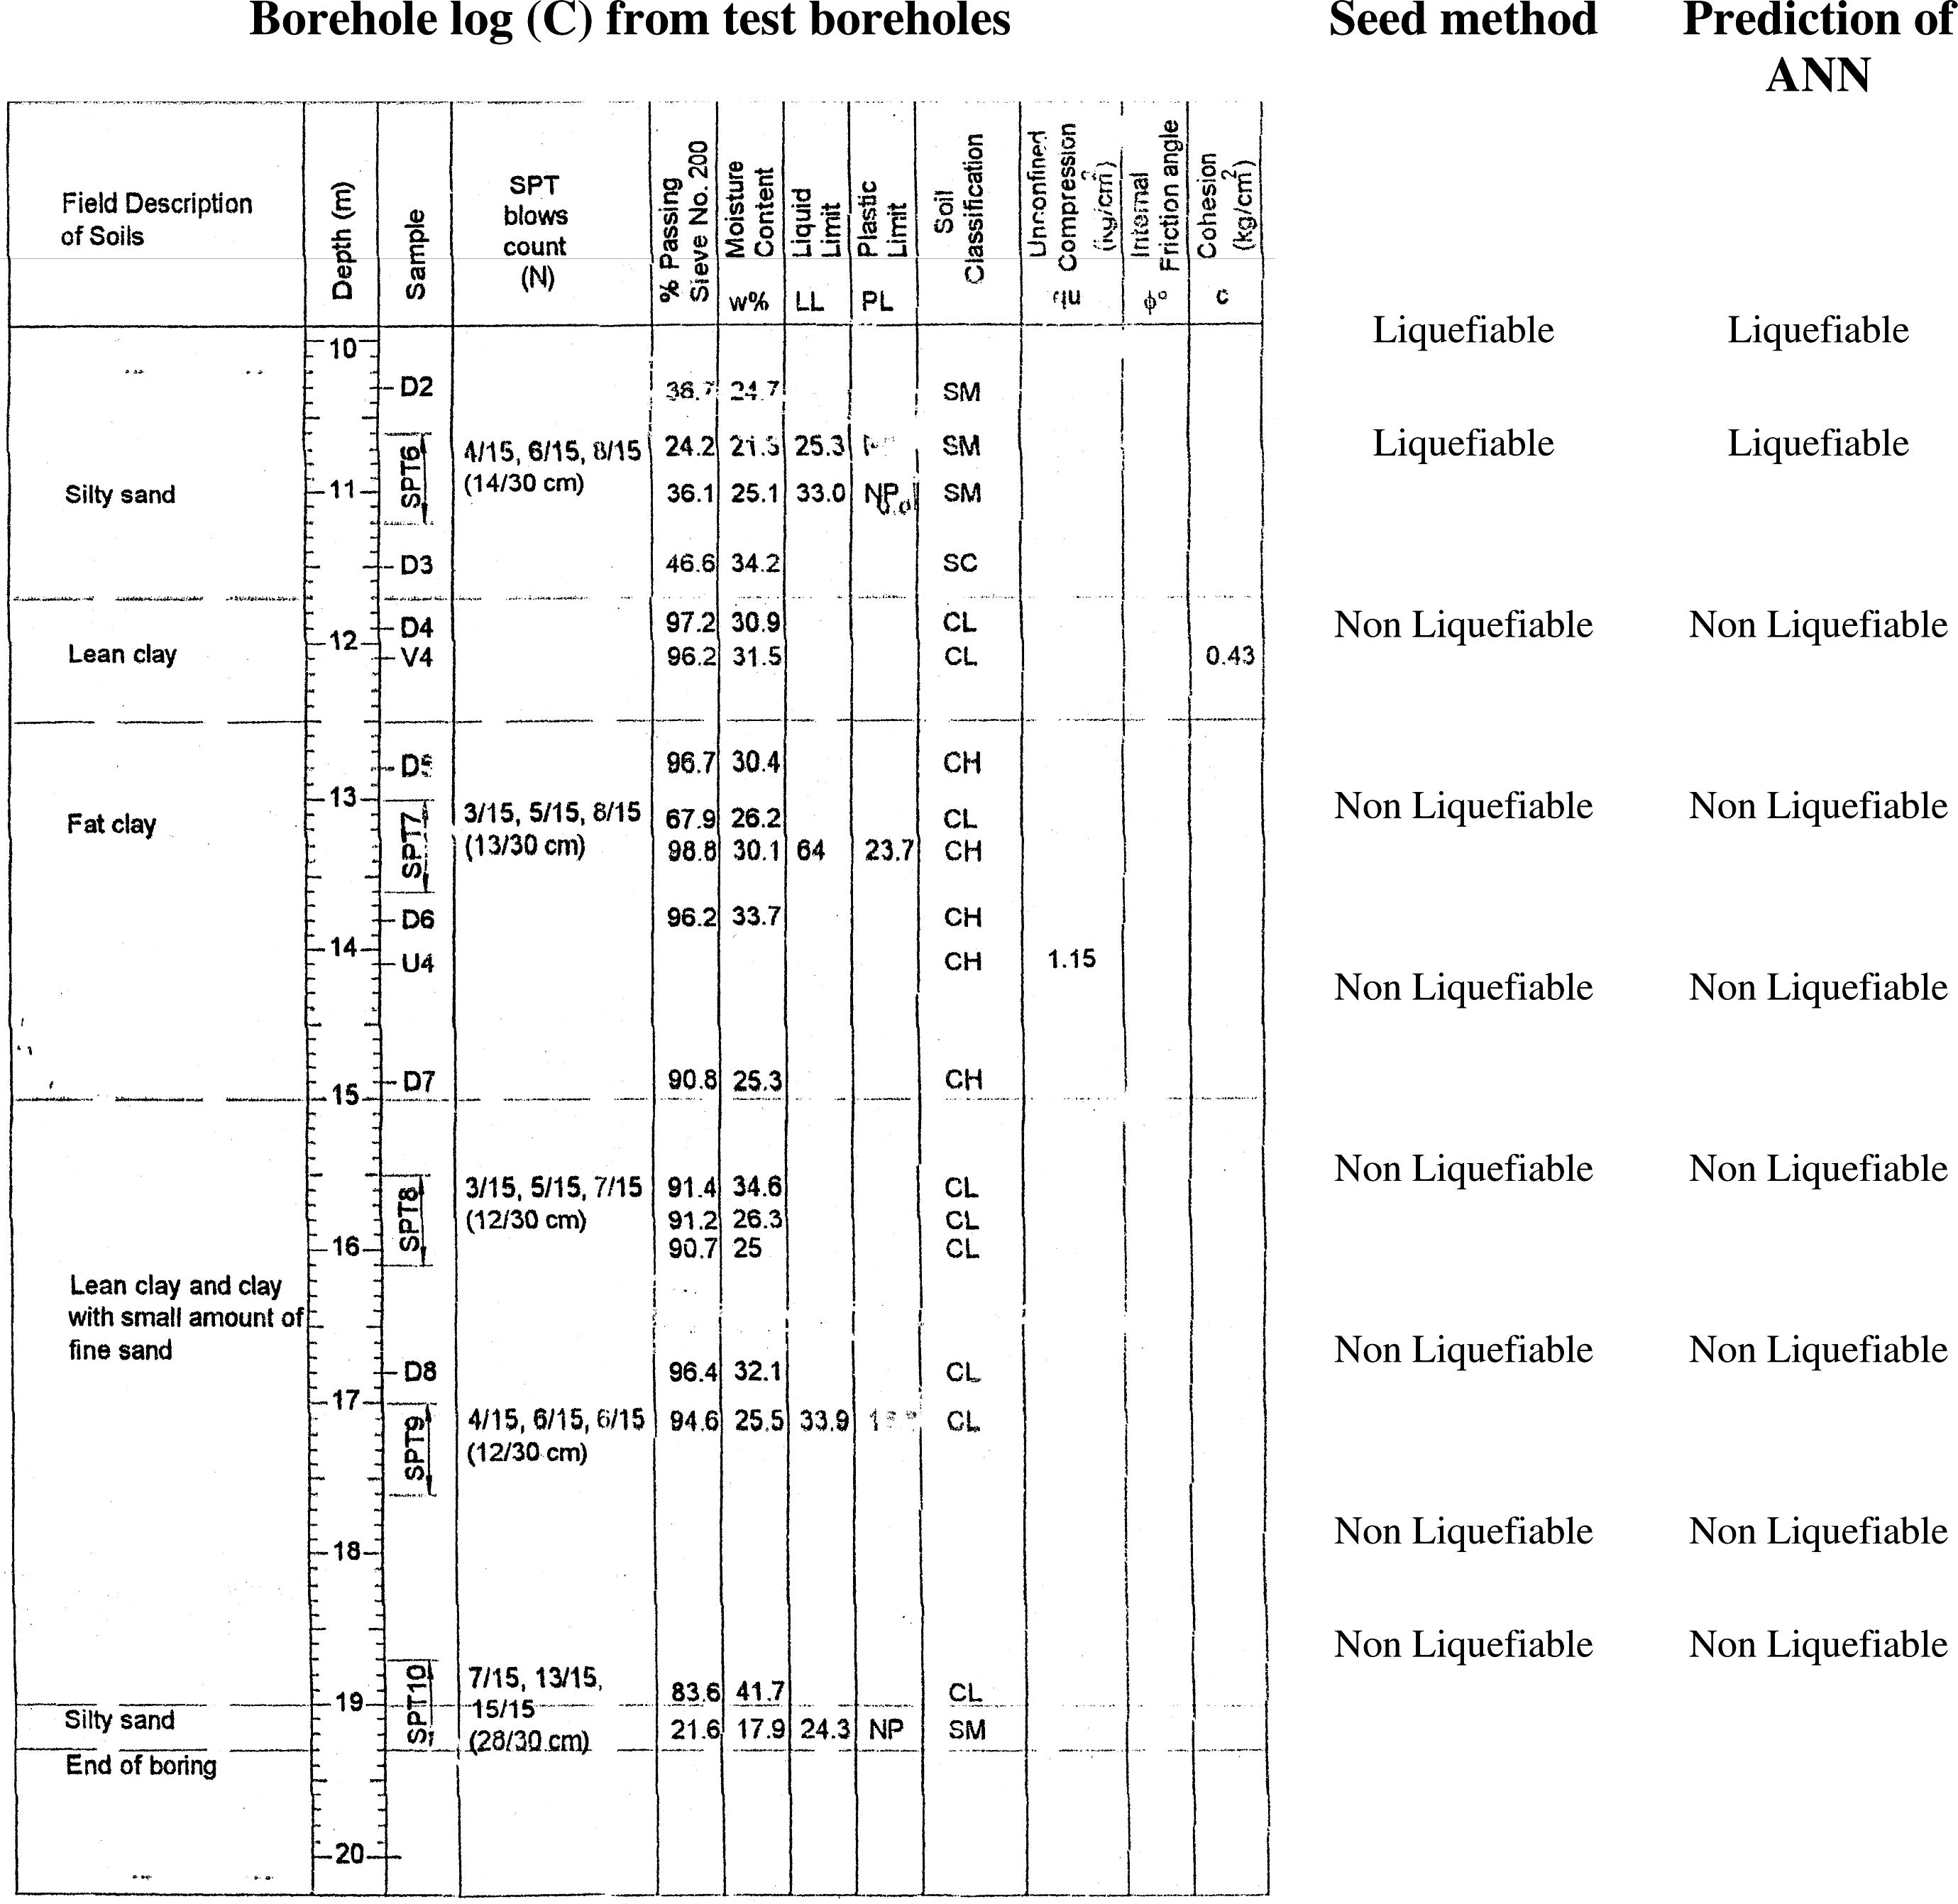
Results of ANN analysis for 3 random selected boreholes from test boreholes in study area.
In the previous section, the learning or training dataset is used to determine the weights. Then a second validation set is used to monitor the performance of the model during the training phase and to minimize over fitting and finally the test sets to evaluate the trained neural network. It is evident from test data sets that the experimental ANN can be applied successfully to predict liquefaction potential.
The samples are divided into 3 groups (training, validation and testing). In Fig. 6 samples of testing group and the RMSE value (comparison between prediction and real data) of each group are shown. Scattering pattern indicates the differences. It is clear that the average correlation of the ANN model and true data in all case is over 91%. So it can be concluded that the prediction of liquefaction potential agrees with calculated value collected from boreholes (see Fig. 8).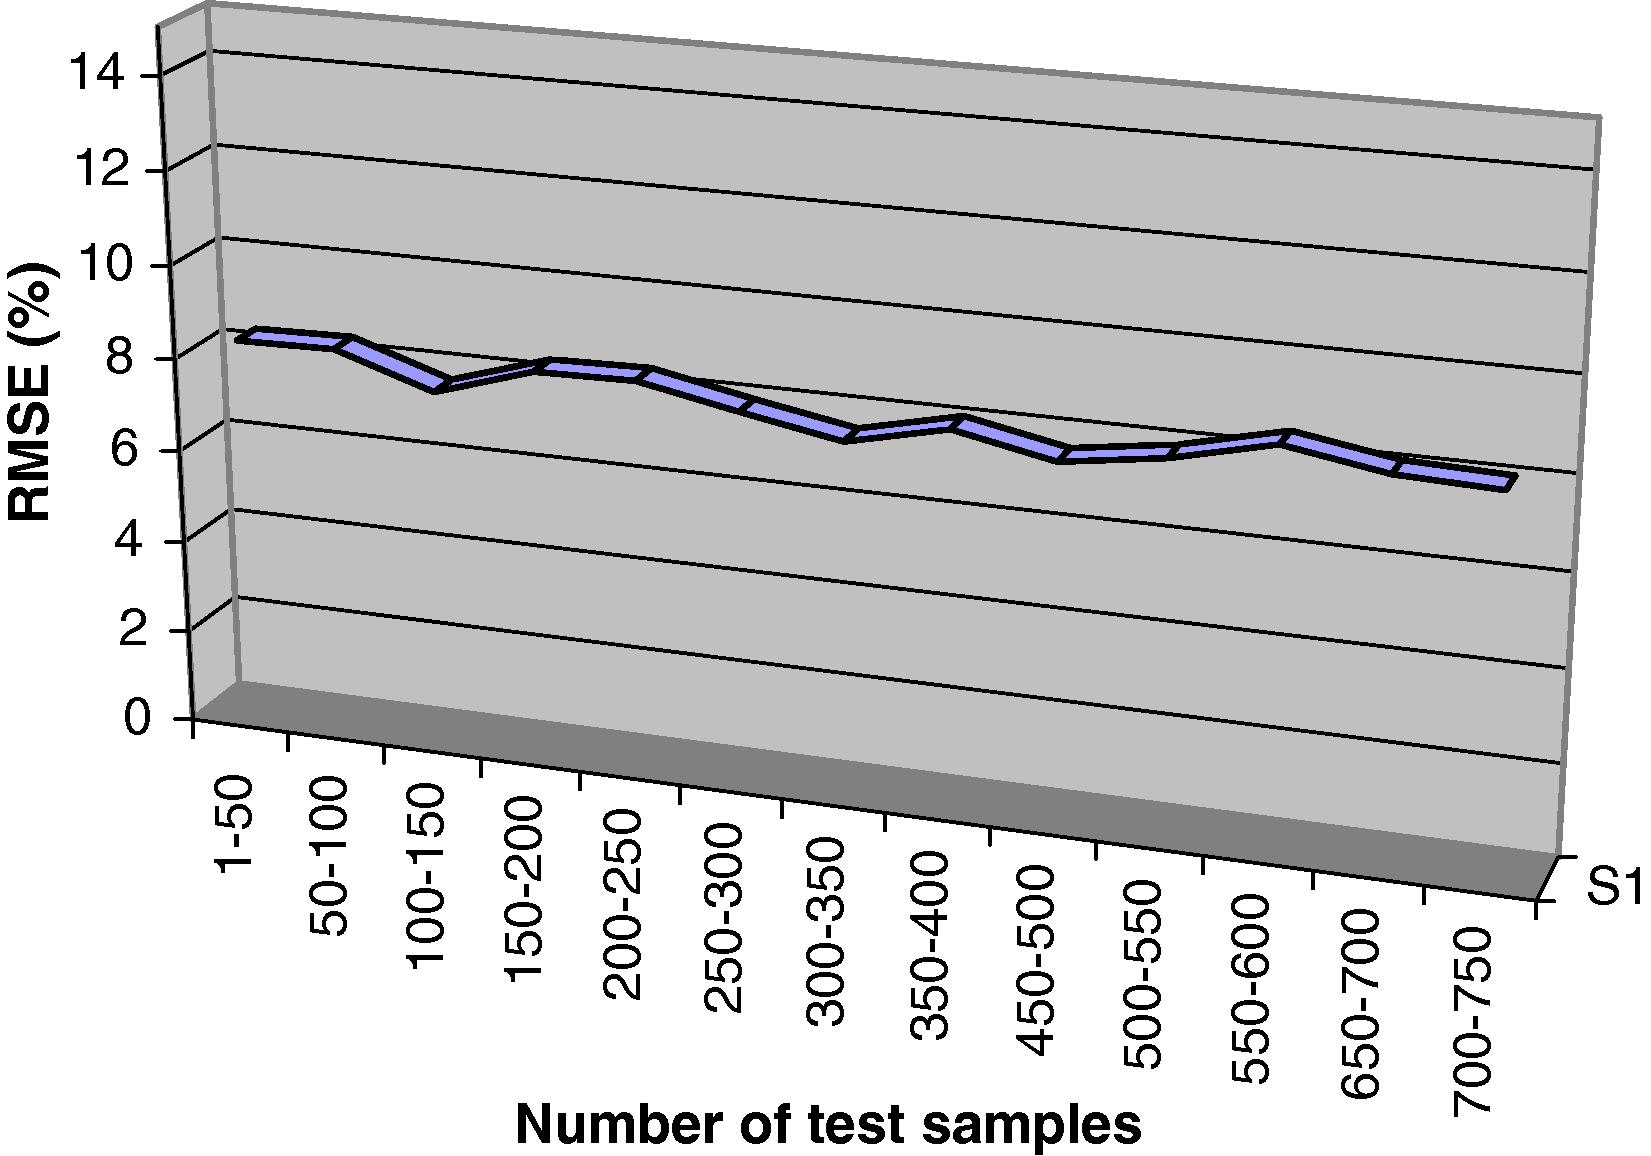
Errors involved ANN model for prediction of liquefaction potential in test boreholes.
Zoning of the city is carried out based on the predicted liquefaction potential variations. Based on these values and soil bore log details, the severity boundary for each group is marked which is indicated in zoning map. The guide map of Babol city is shown in Fig. 7. The undertaking of liquefaction-related microzonation in Babol was conducted for the first time in 2005 by this research group (Fig. 9).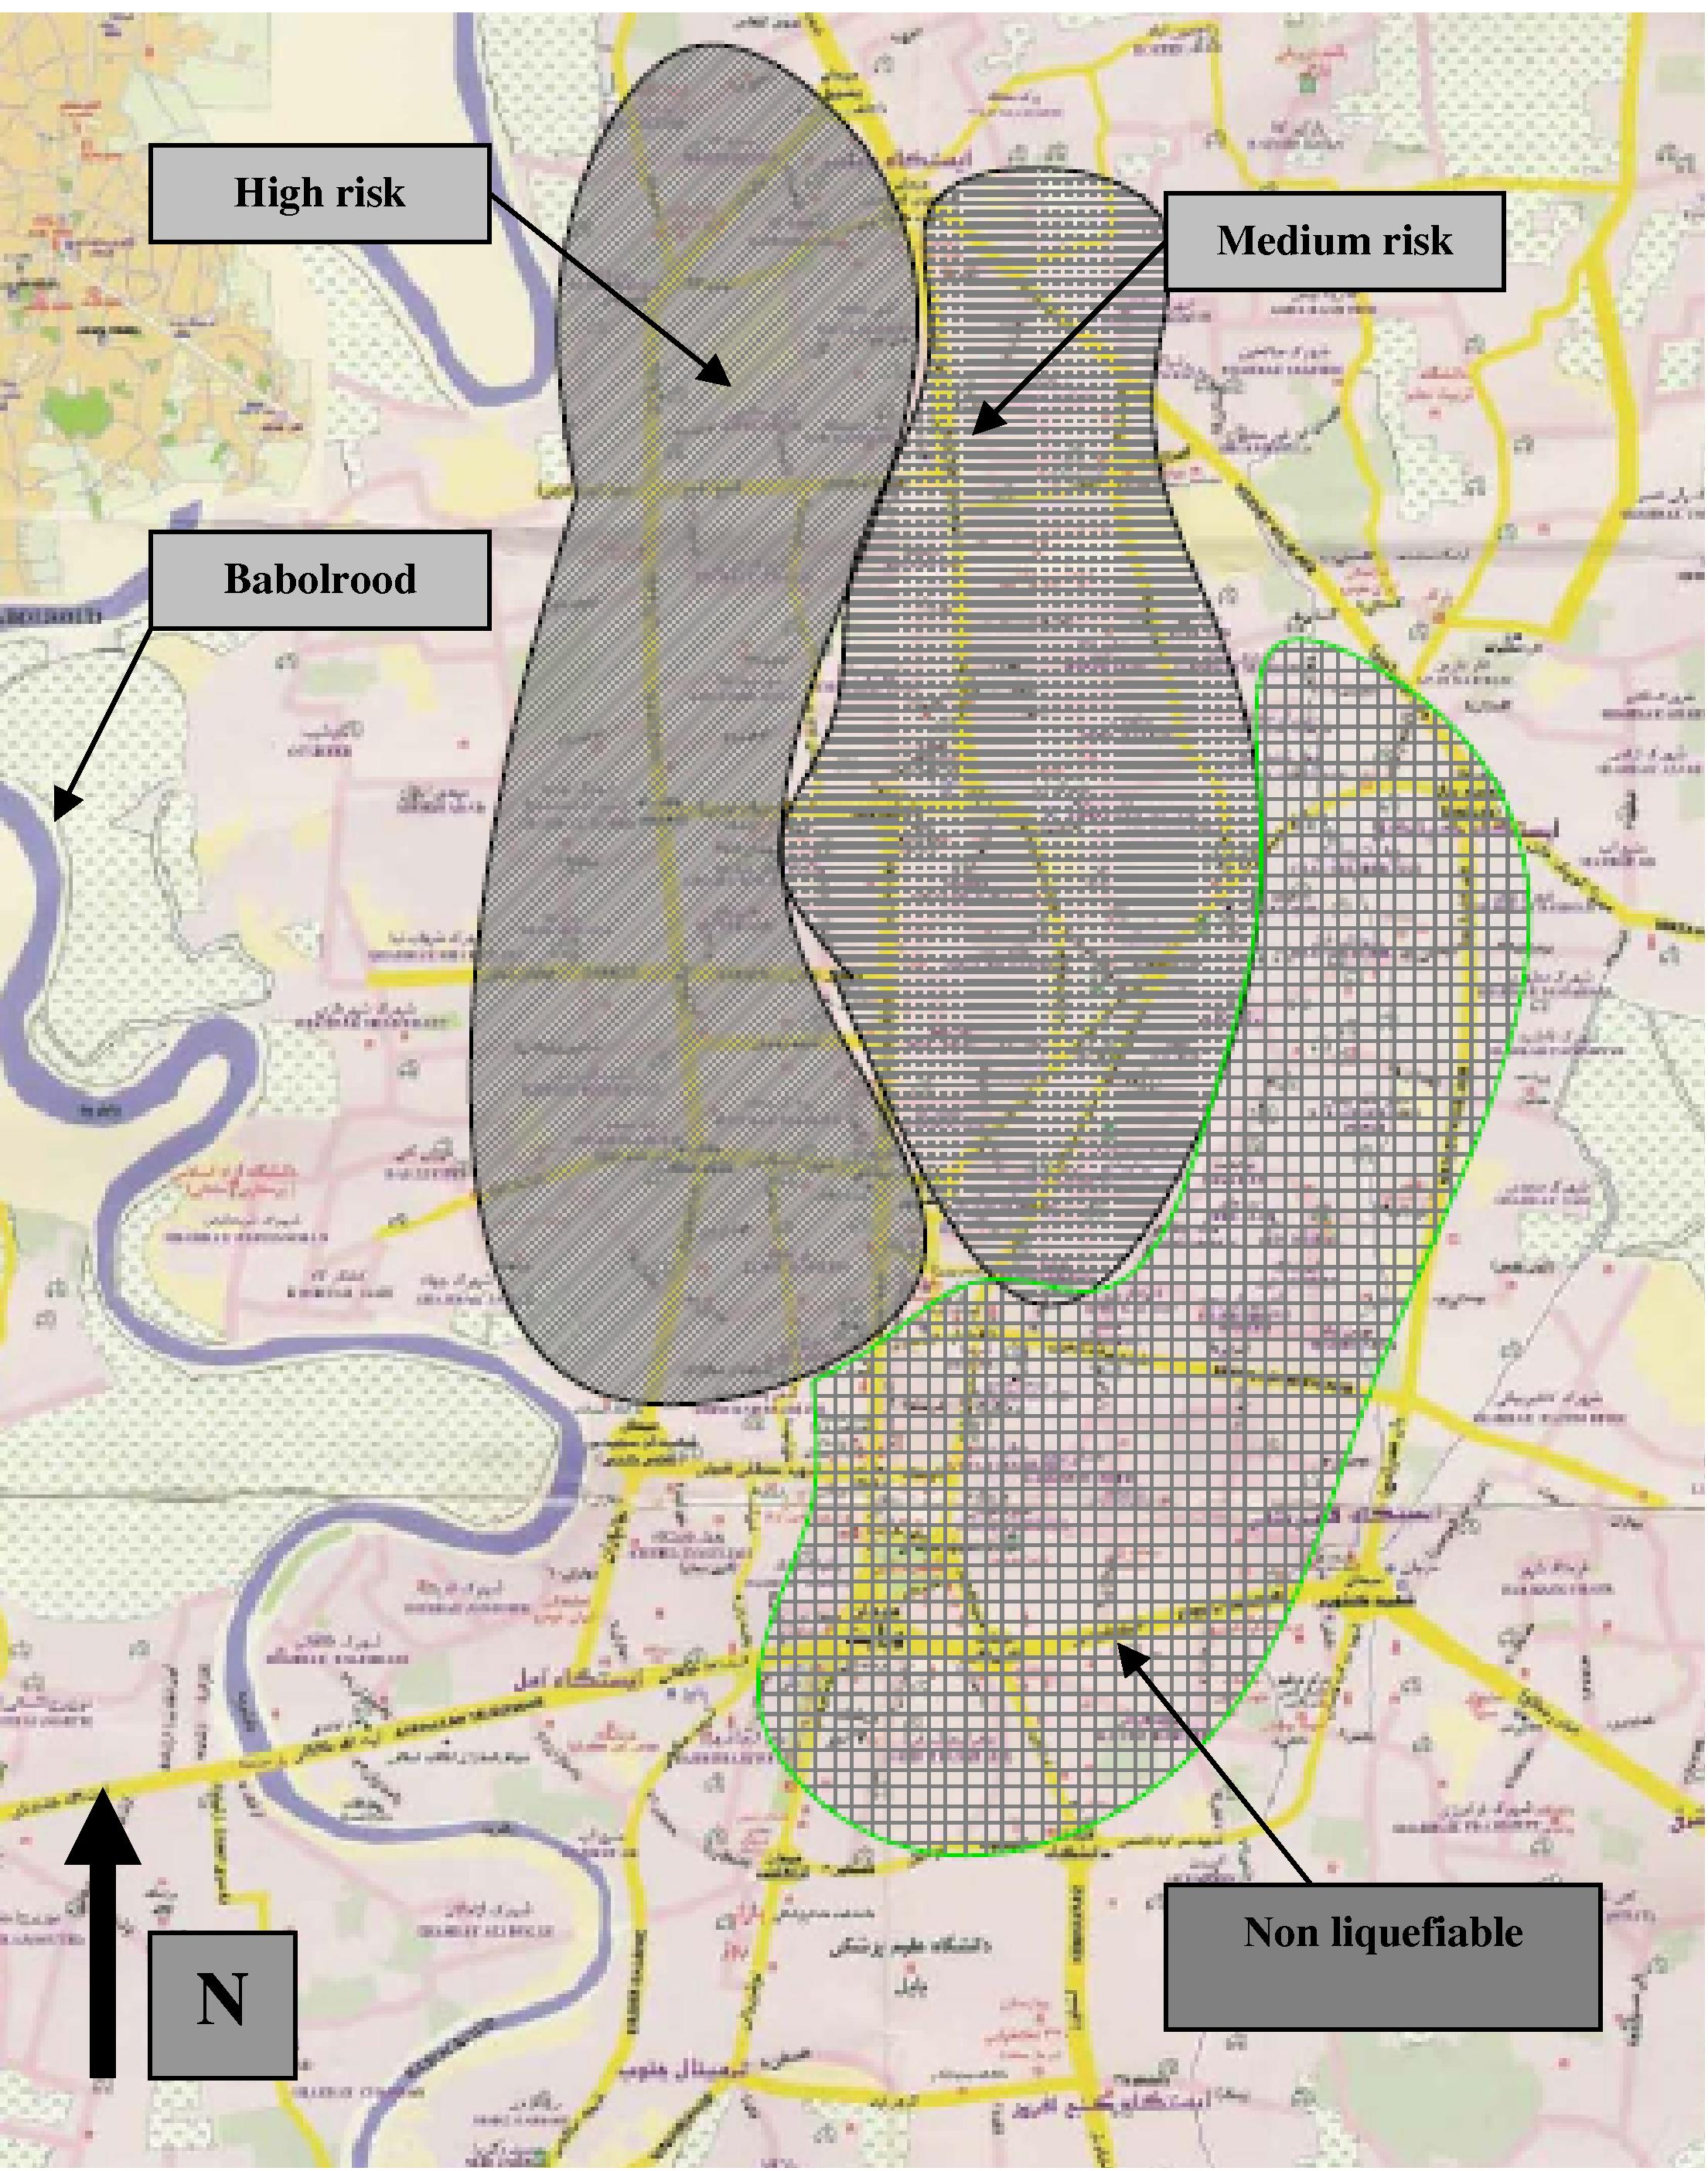
Liquefaction microzonation of Babol.
4 Conclusion
In this research, the data used in training of the model were taken from an area of 7 km2 of Babol region in the northern part of Iran. The dataset encompasses 2500 sampling points (samples) from 30 boreholes. To this end, first a complementary study involving field and laboratory tests, detailed geological survey of the site and its surroundings, using available boreholes data and published literature has been performed. In this ANN model, a back-propagation learning algorithm was used for the training process. The input data for liquefaction potential estimation consist of values of geotechnical and seismic parameters. The average accuracy between the ANN prediction and real data in all cases is over 91%.
Further work on the presented topic would be very useful to modify the procedure for better adapting artificial neural network with the concept of prediction of liquefaction potential. The results produced by the proposed artificial neural network model were compared well with the determined liquefaction decision obtained by simplified methods. It provides a viable liquefaction potential assessment tool that assist geotechnical engineers in making an accurate and realistic predictions. The results show that there is liquefaction potential in western part of Babol, and in southern part of Babol no liquefaction potential was seen. In middle part and eastern part low liquefaction potential was predicted by ANNs. This study shows that the neural networks are a powerful computational tool which can analyze the complex relationship between soil liquefaction potential and effective parameters in liquefaction.
References
- Agrawal, G., Chameau, J.A., Bourdeau, P.L., 1997. Assessing the liquefaction susceptibility at a site based on information from penetration testing. In: Kartam, N., Flood, I., Garrett, J.H. (Eds.), Artificial Neural Networks for Civil Engineers: Fundamentals and Applications, New York, pp. 185–214.
- Soil classification by neural-network. Advances in Engineering Software. 1995;22(2):9597.
- [Google Scholar]
- Choobbasti, A.J., Farrokhzad, F., Barari, A., 2009. Prediction of slop stability using artificial neural network. Arab. J. Geosci., doi:10.1007/s12517-009-0035-3.
- Neural network: an alternative to pile driving formulas. J. Comput. Geotech.. 1995;17:135-156.
- [Google Scholar]
- CPT-Based liquefaction assessment by using fuzzy-neural network. J. Mar. Sci. Technol.. 2008;16(2):139-148.
- [Google Scholar]
- Approximation capability of multilayer feed forward networks as universal approximators. Neural Networks. 1991;4:251-257.
- [Google Scholar]
- Sand liquefaction in hollow cylinder torsion under irregular excitation. Soils Found. 1975;15(1):45-59.
- [Google Scholar]
- Kusano, K., Abe, H., Ogawa, Y., Nakayama, T., 1988. Liquefaction Potential Map in Tokyo Lowland. In: Proc. of the 9th WCEE, vol. 2, pp. 157–162.
- Malvić, T., Velić, J., Cvetković, M., 2008. Review of Neural Network Analyses Performed in Croatian Part of Pannonian Basin (Petroleum Geology Data). XII. Congress of Hungarian Geomathematics and the First Congress of Croatian and Hungarian Geomathematics, Morahalom, Hungary, 29–31.05.2008.
- Triaxial compression behavior of sand and gravel using artificial neural networks (ANN) J. Comput. Geotech.. 1999;24:207-230.
- [Google Scholar]
- Learning internal representations by error propagation. In: Rumelhart D.E., ed. Parallel Distributed Processing. Cambridge, MA: MIT Press; 1986. p. :318-362.
- [Google Scholar]
- Riedmiller, M., Braun, H., 1993. A Direct Adaptive Method for Faster Backpropagation Learning: The Rprop algorithm. In: Proc. of the IEEE Int. Conf. On Neural Networks, San Francisco, pp. 586–591.
- Rizzo, D.M., Dougherty, D.E., 1994. Application of Artificial Neural Networks for Site Characterization using Hard and Soft Information. In: Peters A. et al. (Eds.), Proc. 10th Int. Conf. Computational Methods in Water Resources, vol. 12, Kluwer Academic, Dordrecht, pp. 793–799.
- Seed, H.B., Idriss, I.M., 1971. Simplified procedure for evaluating soil liquefaction potential. J. Soil. Mech. Found Div. ASCE 97(SM8), 1249–1274.
- Representation of irregular stress time histories by equivalent uniform stress series in liquefaction analyses. Report No. UCB/EERC-75/29. U.C. Berkeley: Earthquake Engineering Research Centre; 1975.
- Settlement predictions using neural networks. Australian Civil Eng. Trans. CE. 1998;40:49-52.
- [Google Scholar]


