Translate this page into:
Multi-criteria evaluation of stacking yard configuration
*Corresponding author F.golbabaie@yahoo.com (F. Golbabaie),
**Corresponding author r.alizadehganji@gmail.com (S.R. Seyedalizadeh Ganji)
-
Received: ,
Accepted: ,
This article was originally published by Elsevier and was migrated to Scientific Scholar after the change of Publisher.
Available online 27 August 2010
Abstract
Nowadays container terminals play a pivotally important role in the world. As a consequence of facing the global trend of containerization, this paper proposed a modification in yard layout configuration for terminal throughput improvement. In this regard, three different scenarios of container yard layout were considered in the paper. Site layout planning can affect productivity and is obviously crucial to project success. Because of many uncertainties, variables and variations, site layout planning is a typical multi-objective problem. Actually this shows the multi-criteria property of decision making. Since then we have considered fixed and variable cost, transfer cycle time, flexibility and stacking capacity as the performance indicators. We also employed analytical hierarchy process (AHP) to evaluate each alternative layout with respect to each of the criterion and finally prioritized all the alternatives.
Keywords
Sea transport
Container terminal evaluation
Layout configuration
Multi-criteria decision making (MCDM)
Analytical Hierarchy Process (AHP)
1 Introduction
Due to the explosive growth of shipping industries over recent decades and the high utilization of the world’s container terminals, expansion projects are considered to be the best way to boost productivity of terminals. Modification in layout design and equipments utility maximization is normally the cornerstone of any expansion project. The layout of a container terminal is conclusively proved to have a direct effect on the stacking and transshipment in port area. Yard layout determines the placement of containers as well as the routing and route network of the terminal. Additionally, the width and length of each lane, number of lanes, as well as the configuration/position of reefers, empty containers and dry vans should be determined as the basic consideration in maintaining the best lay out of the terminal. If the layout is poorly designed, it will have its effect on all aspects of the terminal. The first to suffer from such a poor design would be the transfer cycle and the second is ship-to-shore system, such a deficiency can be resolved by overinvestment (Nazari, 2005). In his dissertation, Performance Conditions for Container Terminals, Wiegmans (2003) firmly stated, “The terminal yard must be of a size to enable the handling of the anticipated throughput (Wiegmans, 2003).”
Container terminals vary significantly in terms of size, types of operation, location, management, types of equipment, layout and some other aspects. All these differences somehow show that there are so many factors that should be considered in the early stages of container terminal design and/or in decision making later. The complexity in decision making and designing for container terminals necessitates using tools that can provide enough information about different alternatives so that the managers of the terminals can base their decisions on these tools. On the other hand, they are decision making techniques that can model judgment and perception of managers about the actual terminal operations (Nazari, 2005). One of these techniques known as Analytical Hierarchy Process (AHP) is applied to evaluate three alternative container terminal layouts. The output of this method is a prioritized ranking of the decision making alternatives based on the overall preferences expressed by the decision maker.
2 Literature review
An extensive literature review is conducted on research focusing on improving the performance of container terminals using powerful methods (Bruzzone and Signorile, 1998; Kozan and Preston, 1999; Prescott and Grant, 1988; Seyedalizadeh Ganji et al., in press, 2009; Talley, 1994). This section reviews some of the studies related to MCDA techniques. Chen et al. (2000) researches port competitive advantages by using seven criteria under those categories, as port services, container terminal services, and economies and location. Liu et al. (2004) used a multi attribute decision making method to assess the performance of the two terminals and to determine the optimal number of deployed automated guided vehicles (AGVs) in each terminal. Teng et al. (2004) presented multi-criteria evaluation for port competitiveness of eight East Asian container ports. Tam et al. (2002) used a nonstructural fuzzy decision support system (NSFDSS) which allows assessments based on pair-wise comparisons of alternatives.
Nevertheless, based upon our review of the recent literature, little work has been done in the application of AHP for container ports assessment; some researches in this regard are presented here. Yeo and Song (2003) apply AHP to evaluate competitiveness among ten ports in China and Korea using cargo volume, port facility, port location, and service level as a criteria. Huang et al. (2001, 2002) apply the AHP/GRA to evaluate a container port’s competitiveness. Huang et al. (1999, 2003) use a multi-criteria grade classification model and AHP plus SWOT (strengths, weaknesses, opportunities, and threats) respectively to assess a port’s competitiveness. These researches employ 31 evaluation criteria.
3 Introduction to the MCDA and AHP
Multi-Criteria Decision Analysis (MCDA), often called multi-criteria decision making (MCDM), is the study of methods and procedures by which concerns about multiple conflicting criteria can be formally incorporated into the management planning process, as defined by the International Society on Multiple Criteria Decision Making, 2010. The relation between planning process and multi-criteria decision support framework is shown in Fig. 1. The rectangle shows the planning process and the bubbles show steps that are generally parts of standard MCDA techniques (Yoe, 2002).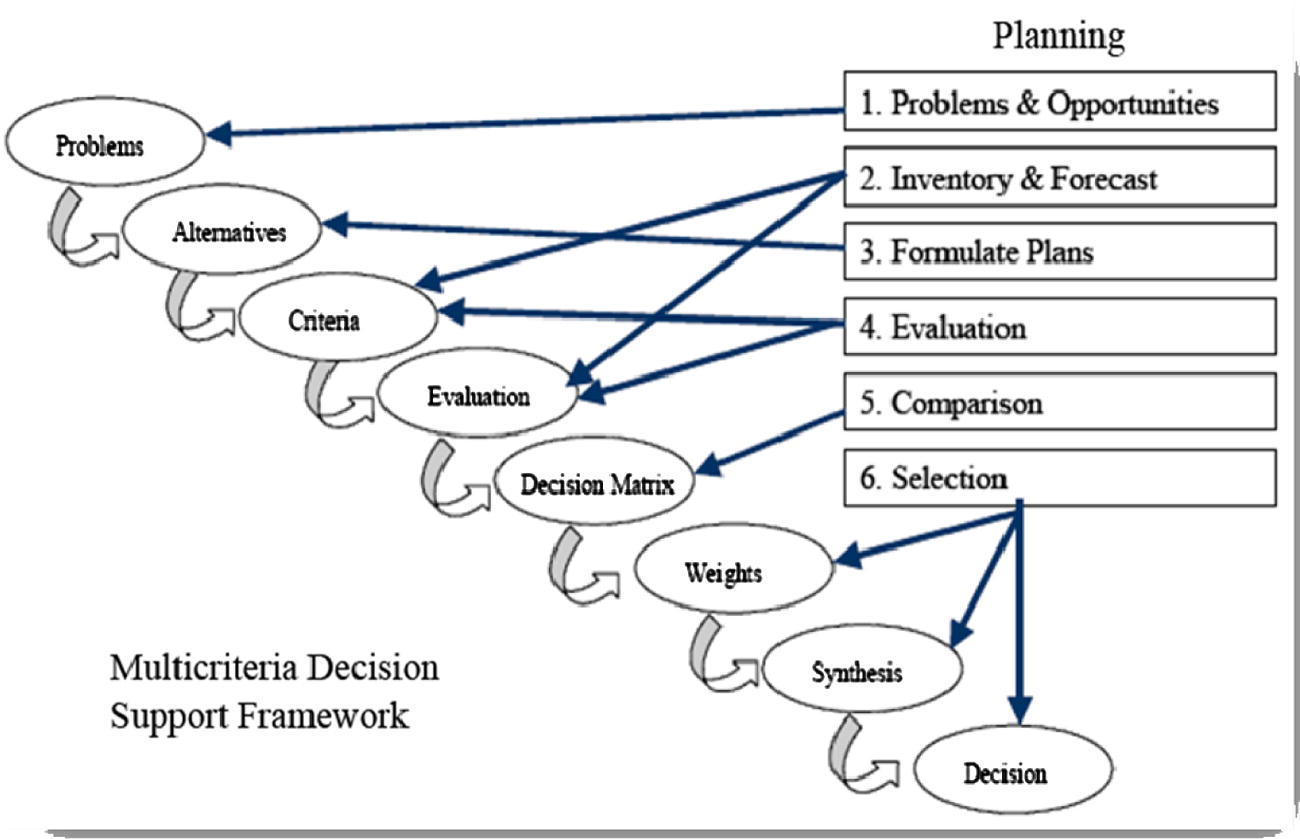
Multi-criteria decision support framework (Yoe, 2002).
MCDA methods evolved as a response to the observed inability of people to effectively analyze multiple streams of dissimilar information. There are many different MCDA methods. They are based on different theoretical foundations such as optimization, goal aspiration, or outranking, or their potent combination. The common purpose of these diverse methods is to be able to evaluate and choose among alternatives based on multiple criteria using a systematic analysis that overcomes the observed limitations of unstructured individual and group decision making. Different methods require different types of raw data and follow different optimization algorithms. Some techniques rank options, some identify a single optimal alternative, some provide an incomplete ranking, and others differentiate between acceptable and unacceptable alternatives (Linkov and Ramadan, 2004).
This paper applies one of the MCDA techniques named AHP to improve the container terminals design. Analytical hierarchy process, developed by Saaty (Saaty, 1999, 2005, 2008) in 1980, is a quantitative comparison method used to select the optimal alternative by comparing project alternatives (e.g. methods for disposing of contaminated sediments) based on their relative performance on the criteria of interest (e.g. impacts on ecological habitat, project costs, etc.), after accounting for the decision-maker’s relative preference or weighting these criteria. AHP completely aggregates various facts of the decision problem into a single objective function. The goal is to select the alternative that results in the greatest value of the objective function. This is a compensatory optimization approach. However, AHP uses a quantitative comparison method that is based on pair-wise comparisons of decision criteria, rather than utility and weighting functions. Evaluators’ express the intensity of a preference for one criterion versus another using a nine-point scale presented in Table 1.
Value
Preference
1
Equally preferred
2
Equally to moderately preferred
3
Moderately preferred
4
Moderately to strongly preferred
5
Strongly preferred
6
Strongly to very strongly preferred
7
Very strongly preferred
8
Very strongly to extremely preferred
9
Extremely preferred
All individual criteria must be paired against all others and the results are compiled in a matrix form. Thus for each comparative score provided, the reciprocal score is awarded to the opposite relationship. The ‘priority vector’ i.e. the normalized weight is calculated for each criterion using the geometric mean of each row in the matrix divided by the sum of the geometric means of all the criteria. The AHP technique thus relies on the supposition that humans are more capable of making relative judgments than absolute judgments (Linkov and Ramadan, 2004).
The procedure of using the AHP can be summarized as Saaty (1999):
-
Model the problem as a hierarchy containing the decision goal, the alternatives for reaching it, and the criteria for evaluating the alternatives (see Sections 4 and 5 for more details).
-
Establish priorities among the elements of the hierarchy by making a series of judgments based on pair-wise comparisons of the elements.
-
Synthesize these judgments to yield a set of overall priorities for the hierarchy. This would combine the investors’ judgments about the elements for properties with overall priorities for each property.
-
Check the consistency of the judgments.
-
Come to a final decision based on the results of this process.
As mentioned above, doing AHP requires some calculations. There are some pieces of software developed for this reason. EC (Expert Choice) is one of them and one can use the on-line program to solve decision making problems (Nazari, 2005).
4 Specifications of the alternatives
4.1 Yard layout I
In this type of layout the containers are stacked horizontally, that is parallel to the berth as shown in Fig. 2. This type of stacking is used in many container terminals and ports such as Shahid Rajaee port (old container terminal) of Iran and the Jebel Ali port of Dubai (see Fig. 3).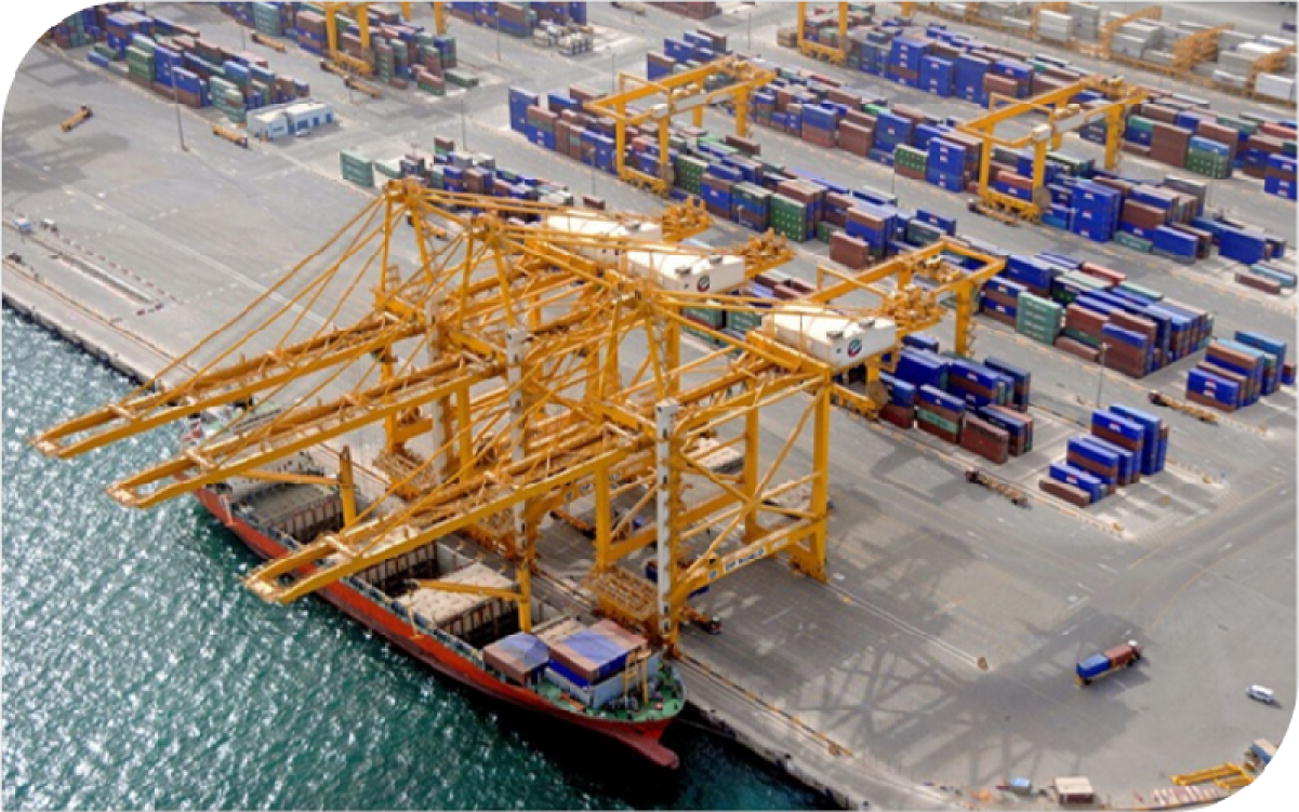
Layout I with horizontal stacks.
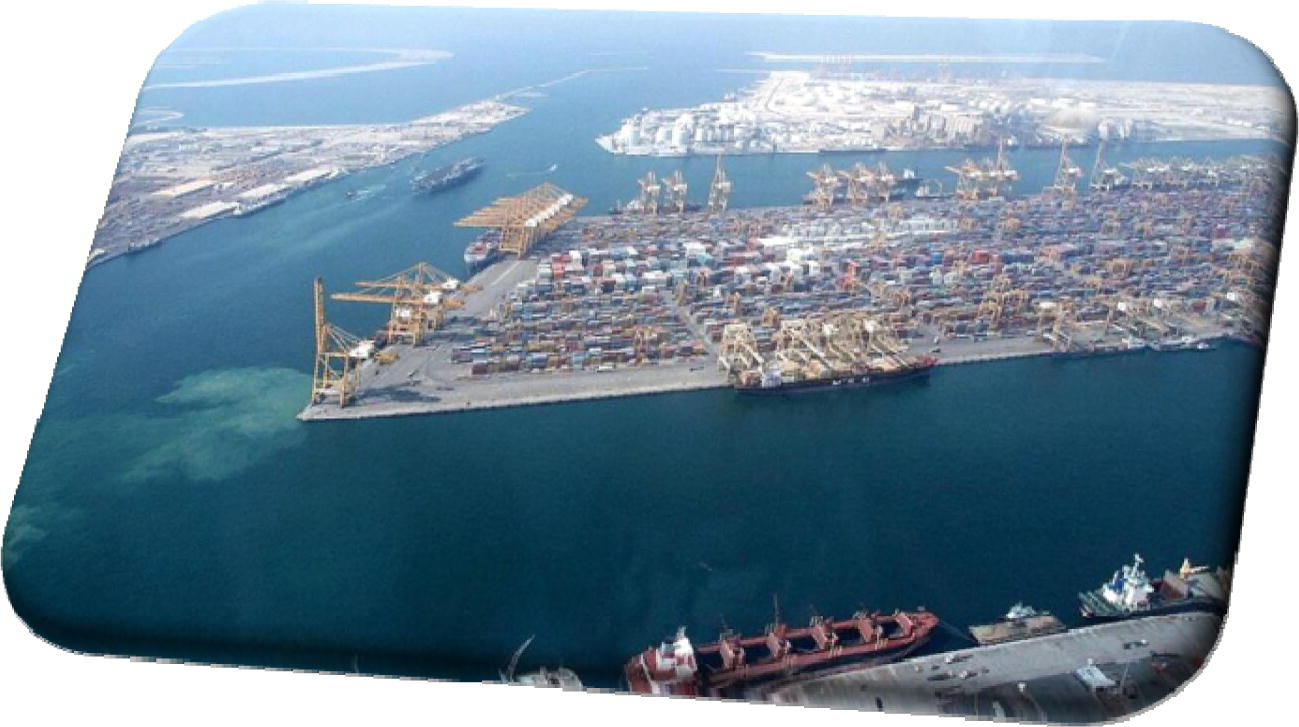
Jebel Ali port of Dubai.
All horizontal roads of this layout are 2-lane ones and unidirectional except the berth one, which is bidirectional. The roads are used for loading and unloading of vehicles (they park on the tenth lane of the stack) and are also used as transit roads. The reason for making such roads as unidirectional is that in most terminals it is required to put the containers in one direction, i.e. the doors of all containers should be placed in one direction.
All vertical roads are only used for the transit of vehicles not for loading and unloading (vehicles cannot stop in these roads). Two of them which are parts of the ring road are 2-lane roads and unidirectional. Others which have divided the yard into equal blocks are 4-lane roads and are bidirectional. The reason for making such roads bidirectional is that these roads are cross aisles of stacks and would make a faster access to the stacks available. In fact layout I enjoys long horizontal roads but the roads are disrupted by vertical roads (conjunctions). Any conjunction for trucks means a full stop or a slow down.
Vehicles always transfer an import container from berth to the import area and unload it, then load an export container from the export area and transfer it to berth in the shortest route. Usually each stack is given one stacking crane. The cranes serve the vehicles based on first come first served (FCFS) rule.
4.2 Yard layout II
In this layout the containers are perpendicularly stacked to the berth as shown in Fig. 4. This type of stacking is used in many container terminals and ports such as Shahid Rajaee port (new container terminal) of Iran and the port of Rotterdam (see Fig. 5).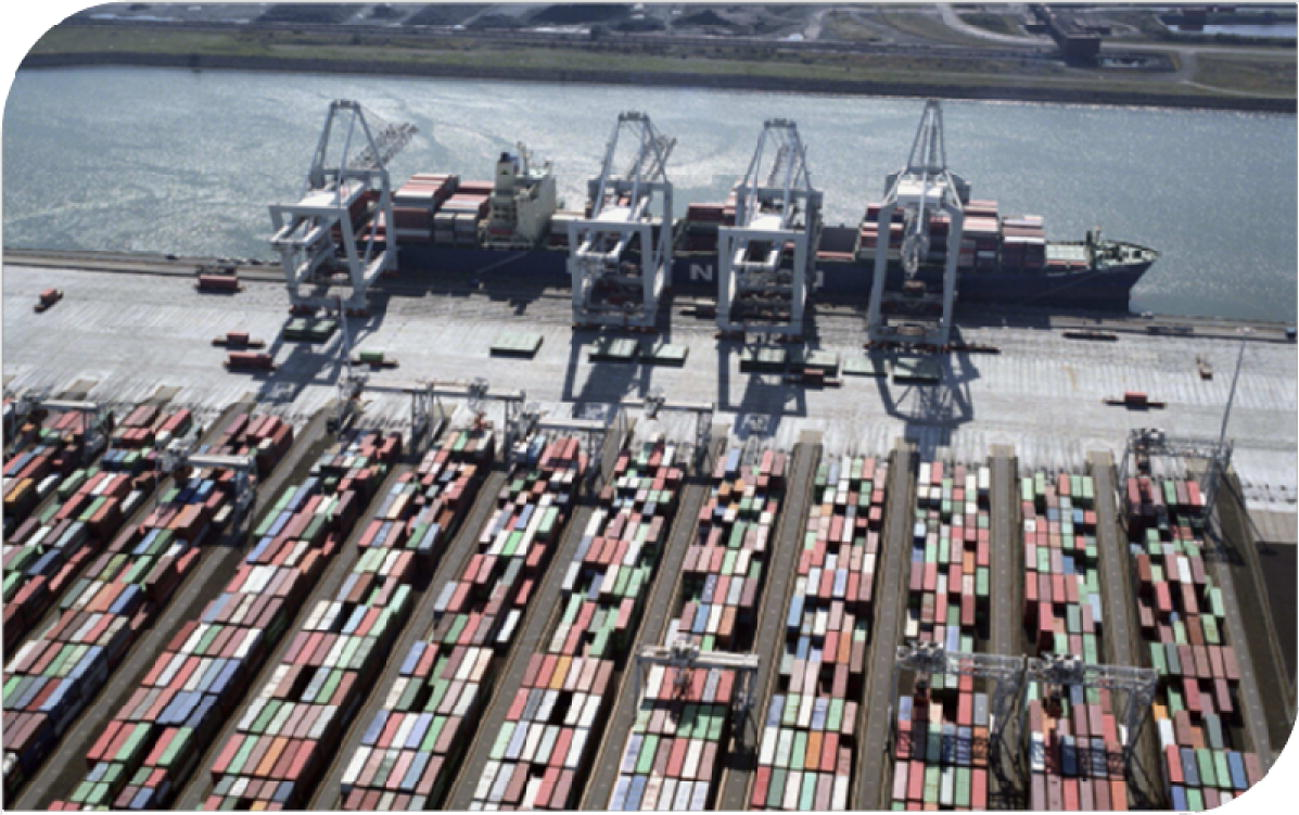
Layout II with vertical stacks.
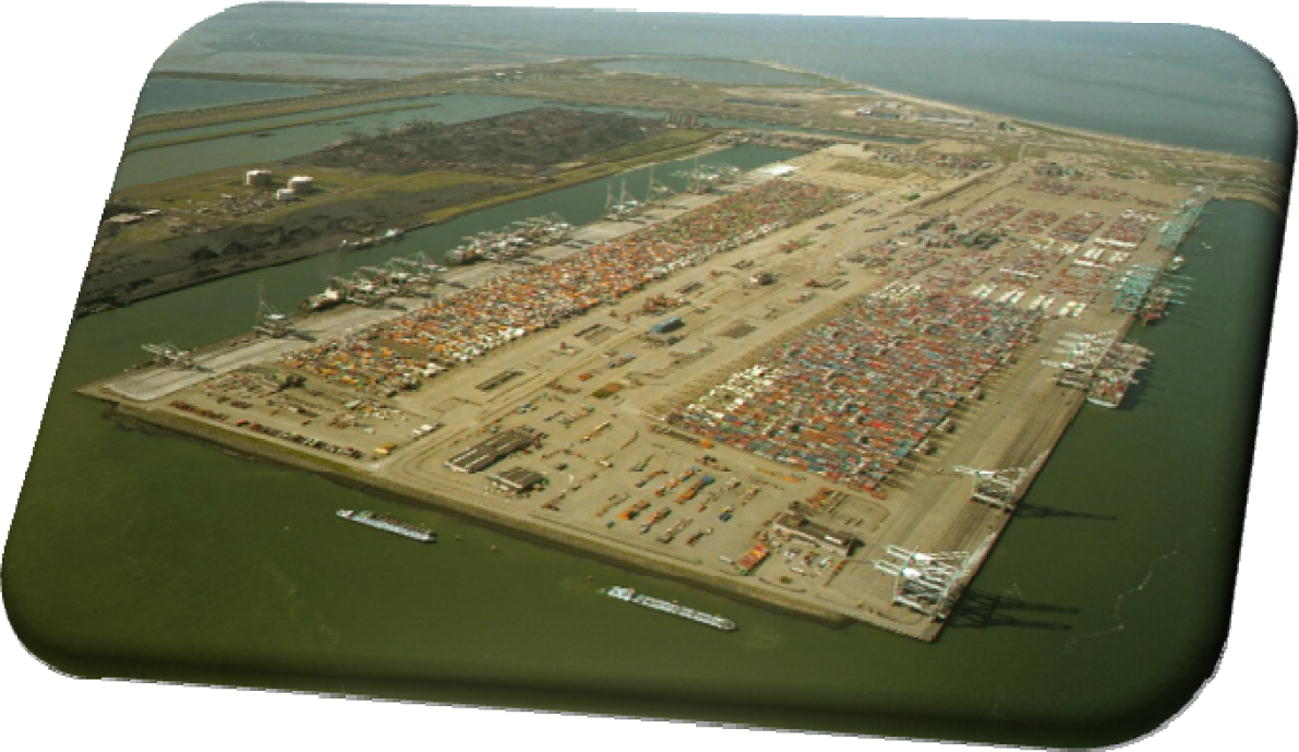
Port of Rotterdam.
There are two horizontal roads in this layout which are part of the ring road; both are 4-lane and bidirectional which are used for the transit of vehicles. All vertical roads are bidirectional and used for loading and unloading of vehicles (they park on the tenth lane of the stack) and are also used as transit roads. The roads in this layout provide a faster access to the mentioned cells.
Vehicles always transfer an import container from berth to the import area and unload it, then they load an export container from the export area and transfer it to berth in the shortest route. Usually each stack is operated by a stacking crane. The cranes serve the vehicles based on first come first served rule.
In layout II, the vehicles can move faster in vertical roads that do not have any conjunction. Therefore vehicles in layout II can speed up and maintain the speed more than those of layout I especially on the way back to the gantry cranes.
4.3 Yard layout III
The third alternative, called layout III is a modified form of layout II in which the exchange point of containers between vehicles and stacking cranes is switched as shown in Fig. 6. In the previously mentioned layout vehicles had to travel next to the designated cell (using the vertical roads) to get unloaded or loaded. In layout III the vehicles will not move into the vertical roads (in fact these roads can be eliminated or lessened in favor of more stacking capacity), instead they will be loaded or unloaded at the seaside tail of the stacks i.e. the stacking cranes have to travel along the stacks to load or unload. This means the vehicles travel a shorter distance, stacking cranes are utilized more and the traffic is less since a few number of vehicles will be needed. However, in layout III again there is a great interdependency between the subsystems. As mentioned before, to decrease the interdependency between the subsystems, one should apply buffer zones. This can bring other alternatives open to the decision making yet we do not deal with these.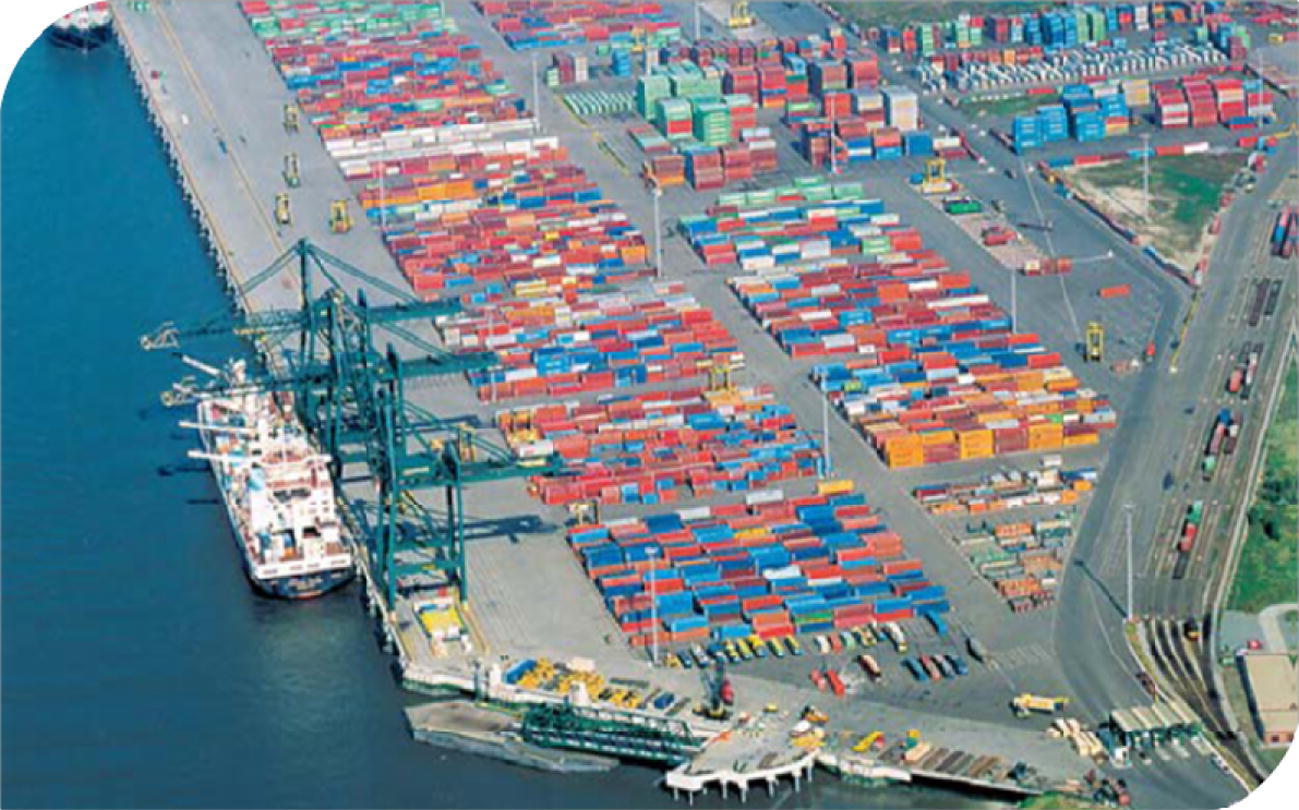
Layout III with lessened roads.
5 Characteristics of the decision making criteria
As it was mentioned, decision making for a typical container terminal requires taking more than one criterion into consideration. While many criteria can be translated into cost, still there are some points that should be looked at in a more qualitative way as we need a layout with:
-
–
Minimum transfer cycle time
-
–
Less number of vehicles to avoid congestion
-
–
Less number of roads to create more stacking capacity
-
–
Faster movement of containers from ship to the stacking area
-
–
More flexibility of layout for vehicles in switching from import to export area
-
–
Less traffic as a result of smoother layout
Actually this shows the multi-criteria property of decision making in this regard i.e. we would consider cost (fixed and variable costs), transfer cycle time, flexibility and stacking capacity. The following manifestation will shed more light on the proposed criteria.
5.1 Cost
Layout III will have the highest cost. Considering the assumption in this layout, vertical roads will be eliminated i.e. more stacks and there is a need for more stacking cranes. However, this layout will use the least number of vehicles compared to the other two as the distance for vehicles travel is less and more stacking cranes are there to serve. Next will be layout I and then the least cost is for layout II based on the above-mentioned assumptions.
5.2 Transfer cycle time
Layout III will have the minimum transfer cycle time with few number of vehicles and less traffic, next will be layout II and the highest transfer cycle time will belong to layout I with the same number of vehicles. The reason is that dissimilar routings of the layouts result in shorter average travel time for vehicles in layout II compared to those in layout I.
5.3 Flexibility and accessibility
Routing effects is combined with the effect of different number of stacking cranes (called equipment effect) and affect the accessibility and flexibility. In terms of using the stacking cranes in both import and export area and also the roads, layout II is the best. Layout III is flexible in using the stacking cranes but is not accessible. Layout I has enough accessibility roads but is not flexible in using stacking cranes.
5.4 Stacking capacity
Layout III is the most capacious followed by layout II and I. In fact in layout III, the vertical roads have been eliminated or lessened so the stacking capacity has increased. Also the capacity of the yard layout II is higher than layout I because of the length of the stacks.
We considered the above indicators whereas one can assume other ones since preferences differ from one decision maker to another.
6 Decision making on layouts
Having explained the procedure of AHP model in Section 3, in this part we will use AHP in order to rank layouts I, II and III.
Assigning the judgment of decision makers to each of the criterion is the first Step. In this way one can find the weight that the decision maker assumes for each criterion. We considered Table 2, but one can assume different priorities for different criteria; however, the overall ranking should be consistent (The criteria are compared pair-wise based on Table 1).
Pair-wise comparison
More important priority
How much more important
Numerical rating
Cost – transfer cycle time
Transfer cycle time
Moderately
3
Cost – flexibility and accessibility
Flexibility and accessibility
Equally or moderately
2
Cost – stacking capacity
Cost
Strongly important
5
Flexibility and accessibility – transfer cycle time
Transfer cycle time
Moderately
3
Transfer cycle time – stacking capacity
Transfer cycle time
Strongly important
5
Flexibility and accessibility – capacity
Flexibility and accessibility
Equally or moderately
2
Based on the above table we could produce a matrix that made it possible to have a numerical pair-wise comparison between criteria (as shown in Table 3).
Criteria
Cost
Transfer cycle time
Flexibility and accessibility
Stacking capacity
Cost
1
1/3
1/2
5
Transfer cycle time
3
1
3
5
Flexibility and accessibility
2
1/3
1
2
Stacking capacity
1/5
1/5
1/2
1
The rest of calculations are applied by dividing each cell of the matrix by its column totally for finding the unitized values and averaging the cells row-wise to determine the priority of each criterion. The final product of a consistent pair-wise comparison is the overall priorities of the criteria as illustrated in the last column of Table 4.
Criteria
Cost
Transfer cycle time
Flexibility and accessibility
Stacking capacity
Average /priority
Cost
0.16
0.18
0.10
0.38
0.205
Transfer cycle time
0.49
0.54
0.60
0.38
0.502
Flexibility and accessibility
0.32
0.18
0.20
0.16
0.215
Stacking capacity
0.03
0.10
0.10
0.08
0.078
However, by finding consistency ratio that requires some calculations, one can find out how the comparisons are consistent and the need to change, if any. (A consistency ratio of less than 0.1 is acceptable but for rates greater than 0.1, the subjective input in the pair-wise comparison matrix should be re-evaluated.).
Since the consistency is measured through a complicated calculation which is beyond the scope of this paper, an alternatively approximation method has been used in this regard.
Consistency Index (CI) and Consistency Ratio (CR) of the n criteria are determined using Eqs. (1) and (2).
As CR = 0.0958 is less than 0.1, so the pair-wise comparison that we did is considered acceptable.
Having created the above matrix (Table 3) and having found the priorities of the criteria (Table 4), each alternative was evaluated with respect to each of the criterion. Table 5 demonstrates the pair-wise comparison among layouts I, II and III for the cost, the rest of the tables are in similar pattern.
Cost
I
II
III
I
1
3
6
II
0.33
1
3
III
0.17
0.33
1
The priority of each of the layouts, illustrated in Table 6, was calculated by applying the pattern mentioned in computation of Table 4, for these new matrixes.
Layout
Cost
Transfer cycle time
Flexibility and accessibility
Stacking capacity
I
0.653
0.164
0.261
0.137
II
0.250
0.297
0.633
0.239
III
0.096
0.539
0.106
0.623
Actually the ranking numbers of the criteria demonstrate the weight for each of the criterion. In order to determine the overall ranking of the layouts, we weighted each layout’s priority by the corresponding criterion.
Overall priority of layout I:
Overall priority of layout B and C with similar calculations are equal to 0.355 and 0.361. Regarding the above results, layout III ranks better than the other two layouts.
7 Conclusions
The AHP model of multi-criteria decision making has convinced to be useful in decision making on the best scenario in yard configuration among three proposed layouts I, II and III with different stacking layout, roads, and different number of stacking cranes. The horizontal layout as the first layout, then the vertical layout would be the second one and the third layout is a modified form of the previous one. We could improve layout II by eliminating the vertical roads while adding more stacks by shifting the interchange point of containers between trucks and stacking cranes. The new layout is called III and considered as an alternative to the first two ones. In this regard, the following performance criteria have been considered in the decision making process: cost, transfer cycle time, flexibility and stacking capacity. Ultimately having considered the results of the calculations, in the overall ranking of the layouts, layout III is the best in terms of performance indicators followed by layouts II and I. Preferences differ from one decision maker to another; therefore, the outcome depends on who is making the decision and what their goals and preferences are. Furthermore, in future the managers and operators of container terminals should be more involved with non-monitory issues and decision criteria such as environmental issues like air and noise pollution etc.
References
- Simulation and genetic algorithms for ship planning and shipyard layout. Simulation. 1998;71(2):74-83.
- [Google Scholar]
- Chen, C.Y., Chao, S.L., Hsieh, T.W., 2000. A time–space network model for the space resource allocation problem in container marine transportation. In: Proceedings of the 17th International Symposium on Mathematical Programming, Atlanta.
- Huang, M.J., et al., 2001. Ports competitiveness evaluation-case study of Eastern Asian container ports. In: Proceedings of Eastern Asia Society for Transportation Studies, Hanoi.
- Competitiveness evaluation for Eastern Asian container ports by using grey relational analysis method. J. Grey Syst.. 2002;14(3):239-250.
- [Google Scholar]
- Huang, W.C., et al., 1999. Integration of the AHP and SWOT analysis for port competition evaluation in the Eastern Asian region. In: Proceedings of the Fifth International Symposium on the Analytic Hierarchy Process, Kobe, Japan.
- Port competitiveness evaluation by fuzzy multi-criteria grade classification model. J. Mar. Sci. Technol.. 2003;11(1):53-60.
- [Google Scholar]
- International Society on Multiple Criteria Decision Making, 6th June 2010. <http://www.mcdmsociety.org>
- Genetic algorithms to schedule container transfers at multimodal terminals. Int. Trans. Operat. Res.. 1999;6(3):311-329.
- [Google Scholar]
- Comparative Risk Assessment and Environmental Decision Making. Kluwer; 2004.
- Automated guided vehicle system for two container yard layouts. Trans. Res. Part C. 2004;12:349-368.
- [Google Scholar]
- Nazari, D., 2005. Evaluating Container Yard Layout, A Simulation Approach. Maritime Economics and Logistics, MS Thesis, Erasmus University, Rotterdam.
- A Manager’s Guide for evaluating competitive analysis techniques. Interfaces. 1988;18(3):10-22.
- [Google Scholar]
- Decision Making for Leaders: The Analytic Hierarchy Process for Decisions in a Complex World. Pittsburgh, Pennsylvania: RWS Publications; 1999.
- Theory and Applications of the Analytic Network Process. Pittsburgh, Pennsylvania: RWS Publications; 2005. p. ix
- Seyedalizadeh Ganji, S.R., Babazadeh, A., Arabshahi, N., in press. Analysis of continuous berth allocation problem in container ports using genetic algorithm. J. Mar. Sci. Technol. doi:10.1007/s00773-010-0095-9.
- Nonlinear mathematical programming for optimal management of container terminals. Int. J. Modern Phys. B. 2009;23(27):5333.
- [Google Scholar]
- Performance indicators and port performance evaluation. Logist. Transport. Rev.. 1994;30(4):339-352.
- [Google Scholar]
- Site layout planning using nonstructural fuzzy decision support system. J. Construct. Eng. Manage.. 2002;128(3):220-231.
- [Google Scholar]
- Multi-criteria evaluation for port competitiveness of eight East Asian container ports. J. Mar. Sci. Technol.. 2004;12(4):256-264.
- [Google Scholar]
- Wiegmans, B., 2003. Performance Conditions for Container Terminals Dissertation. Vrije University Amsterdam, Amsterdam, The Netherlands.
- Yoe, C., 2002.Trade-Off Analysis Planning and Procedures Guidebook. Prepared for Institute for Water Resources, US Army Corps of Engineers.
- An evaluation of container ports in china and Korea with the analytic hierarchy process. J. Eastern Asia Soc. Transport. Stud.. 2003;5(3):726-741.
- [Google Scholar]
Appendix A
See Tables A1–A3.
Criteria
Cost
Transfer cycle time
Flexibility and accessibility
Stacking capacity
Weighted sum
Cost
0.205
0.166
0.107
0.390
0.868
Transfer cycle time
0.615
0.502
0.645
0.390
2.152
Flexibility and accessibility
0.410
0. 166
0.215
0.156
0.947
Stacking capacity
0.041
0.100
0.107
0.078
0.326
Cost
4.2341
Transfer cycle time
4.2868
Flexibility and accessibility
4.4046
Stacking capacity
4.1794
Average or λmax
4.2762
Number of alternative (n)
Random index (RI)
3
0.58
4
0.90
5
1.12
6
1.24
7
1.32
8
1.41


