

Translate this page into:
ZnO nanocomposites containing Cd are synthesized with high photodegradation potential for wastewater treatment
⁎Corresponding authors at: UNESCO-UNISA Africa Chair in Nanosciences/Nanotechnology Laboratories, College of Graduate Studies, University of South Africa (UNISA), Muckleneuk Ridge, PO Box 392, Pretoria, South Africa (K. Kaviyarasu). gobi.rect@gmail.com (G. Gobi), kavi@tlabs.ac.za (K. Kaviyarasu)
-
Received: ,
Accepted: ,
This article was originally published by Elsevier and was migrated to Scientific Scholar after the change of Publisher.
Peer review under responsibility of King Saud University.
Abstract
The zinc oxide (ZnO) nanoparticle on a two - electron oxygen reduction reaction is a particularly promising candidate for in-situ application. Herein, we prepared the Cd doped ZnO nanocomposites through a simple hydrothermal method. The X-ray diffraction (XRD) analysis has been carried out to confirm the structure and size of the nanomaterial. The optical absorption and energy gap of the prepared nanoparticles have been identified by UV–vis-NIR studies. Photoluminescence (PL) studies on the synthesized nanomaterials confirm the characteristic existence of blue and green emission bands. Fourier transform infrared (FTIR) spectroscopy has been studied on the ZnO nanoparticles to analyze the -OH and CO-O vibrations. The structural and surface morphology analysis was inferred by scanning electron microscopy (SEM), transmission electron microscopy (TEM), and energy dispersive X-ray (EDX) microanalysis. Cd doped ZnO nanocomposites are environmentally friendly and can be utilized to quickly remove contaminants from wastewater. The findings from the adsorption equilibrium fit the Brunauer-Emmett-Teller (BET) model very well, showing multi-layer adsorption. The photodegradation studies on Cd doped ZnO nanocomposites were carried out, which is an advanced oxidation process widely used for methylene blue removal. Therefore, the higher photocatalytic performance revealed that Cd doped ZnO nanocomposites could be a promising photocatalyst for environmental remediation applications.
Keywords
Cd doped ZnO nanocomposites
Organic dyes
Brunauer-Emmett-Teller (BET)
Photocatalytic performance
Scanning electron microscopy
Advanced oxidation process

1 Introduction
Because of their unique physical properties, nanoparticles are of tremendous attention for numerous technical applications and basic research (Kasinathan et al., 2016; Rekha et al., 2010; Chandrasekar et al., 2021). The optical characteristics of ZnO nanostructures have sparked fresh interest in recent years (Entisar et al., 2012). They have a big surface area for their size, and ZnO has a high catalytic activity despite its small size of fewer than 100 nm. ZnO is a wide bandgap semiconductor with an energy gap of 3.37 eV at room temperature (RT). By activating exaction emission at temperatures much above room temperature, it can be employed as a UV lasing material. ZnO is a chemically and thermally intriguing table-type semiconductor with a broad direct bandgap and great sensitivity to hazardous and flammable gases (Vinayagam et al., 2022). ZnO has been studied as an optoelectronic transparent conducting and piezoelectric material because it has a higher excitation binding energy than other semiconductor materials. The properties of ZnO nanostructures can be adjusted for specific and desired applications, which has recently gained a lot of attention. Among the various dopants, currently, the Cd doped ZnO nanocomposites have gained a large focus as by doping ZnO, its absorption edge can be blue-green shifted. In addition to this, due to the almost similar ionic radius of Cd+ (0.74 Å) and Zn2+ (0.60 Å), the synthesized materials have very rare reports of Cd doped ZnO nanocomposites as a photocatalyst for photodegradation of organic dyes.
Photocatalytic materials are used in solar cells, laser diodes, UV lasers, thin-film transistors, optoelectronics, piezoelectric applications, surface acoustic wave instruments, and wastewater treatment, to name a few. In fact, zinc oxide nanostructures hold a lot of potential for wastewater treatment and have increased in popularity in recent years as one of the most promising materials. Furthermore, having a catalyst permits for easy modification of physical and chemical properties (Muhson Naji et al., 2022; Geetha et al., 2018). The enhancement of photocatalytic activity may be attributed to electron trapping by cadmium ions, reduced particle size, greater surface area, and more surface roughness. Cd incorporation in zinc oxide is thought to increase the amount of Cd+ ions, resulting in higher photocatalytic activity of parent nanoparticles. The hydrothermal approach was used to prepare Cd doped ZnO nanocomposites, which is the simplest and most efficient method. The prepared materials are characterized by powder X-ray diffraction method gives the size, crystalline nature. FTIR spectral analysis on the Cd doped ZnO nanocomposites gives the presence of stretching and vibration modes. The morphology of Cd doped ZnO nanocomposites was calculated by scanning electron microscopy technique. Moreover, UV–visible spectroscopy and photoluminescence spectra were also used to figure out the optical characteristics apparently (Osmond and McCall, 2010; Kaviyarasu et al., 2016; Mangala Nagasundari et al., 2021; Yuan et al., 2022; Chandrasekar et al., 2022). In fact, under visible light irradiation, photocatalytic activity on Cd doped ZnO nanocatalyst is used to adsorptive remove the organic pollutant methylene blue dye, confirming that the current candidate is a difficult one for environmental investigations were reported in detail.
2 Experimental procedure
2.1 Synthesis of pure ZnO and Cd doped ZnO nanocomposites
A hydrothermal technique was used to create the Cd doped ZnO nanocomposites. 0.1 M of zinc acetate [Zn(CH3COO)2H2O] and 0.05 M of sodium hydroxide (NaOH) aqueous solution were gradually added to the main mixture in a typical synthesis to keep the pH of the resulting solution at 12. The solution was agitated for 30 min until a white precipitate formed, then transferred to a Teflon-lined stainless-steel autoclave and placed in a hot air oven at 190 °C for 24 hrs. The completed goods were rinsed in distilled water and dried for 5 hrs at 80 °C. The resulting composite was pulverized with a mortar and pestle and calcined at 500 °C. The Cd doped ZnO nanocomposites were prepared using similar techniques, with the addition of 0.01 M cadmium chloride dihydrate (CdCl2·H2O) to incorporate the Zn.
3 Results and discussion
3.1 XRD analysis
X-ray diffraction analysis was used to determine the phase composition and crystalline size of the produced ZnO sample. The doping of ZnO with Cd is done to the point where the number of doped atoms in the new substance is up to 10% of the total number of Zn atoms. They go through the same phases as ZnO. In the observed XRD pattern, several well-defined dominating diffraction reflections are all connected and well-matched with the diffraction reflection in the sea of wurtzite hexagonal phase ZnO (Umar et al., 2009; Raja et al., 2014; Espitia et al., 2012). For higher Cd content, the XRD peaks of the wurtzite phase show increased full width at half maximum (FWHM) values. The (1 0 1) plane corresponds to the acute and high-intensity diffraction peaks as shown in Fig. 1. The planes are (1 0 0), (0 0 2), (1 0 1), (1 0 2), (1 1 0), and (1 0 3), respectively (1 1 2). The high crystalline quality of the produced material is indicated by the tiny linewidths. The average crystalline size of all the samples was calculated using the Debye-Scherrer formula, D = 0.9λ/(βcosθ), where ‘λ’ is the X-ray wavelength, is the full width at half maximum (FWHM) of the peaks and is the diffraction angle. The predicted sizes for pure ZnO and Cd doped ZnO nanoparticles were 21 nm and 18 nm respectively. The crystal plans of Cd doped ZnO are as follow (1 0 1), (1 0 2), (1 1 2) respectively.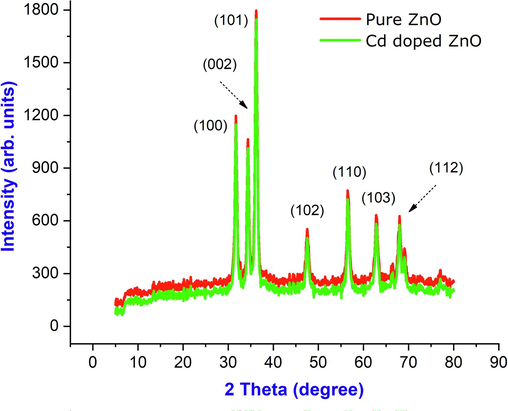
XRD pattern of pure ZnO and Cd doped ZnO nanocomposites.
3.2 SEM and EDX analysis
The produced Cd doped ZnO products were analyzed using a scanning electron microscope to evaluate the overall geomorphologies. The ZnO nanoparticles are a small grain of size in the nano range. The research of materials was done for preparation; therefore, the grain size was reduced compared to what the XRD analysis revealed. Fig. 2(a-f). Displays the nanoparticles have a relatively similar structure, according to the SEM image, with grain sizes ranging from 25 to 15 nm. Pure and Cd doped ZnO nanoparticles have a homogeneous hexagonal particle distribution and high crystalline quality. It is evident that as the Cd ion is doped, the crystalline size decreases. The EDAX test was used to validate the presence of Cd ions in the lattice of ZnO nanoparticles as shown in Fig. 2(g-h). The results demonstrate that the nanoparticles are made up of Zn, Cd, and O, indicating that Cd has been doped with ZnO. The content of Cd in the doped samples was determined to be 05.29 percent. The chemical compositions of Zn and O in pure ZnO nanoparticles are 54.66 % and 42.37%, respectively. The zinc percentage falls in ZnO doped Cd nanoparticles, but the oxygen percentage increases significantly which confirms the reduced size of the synthesized material.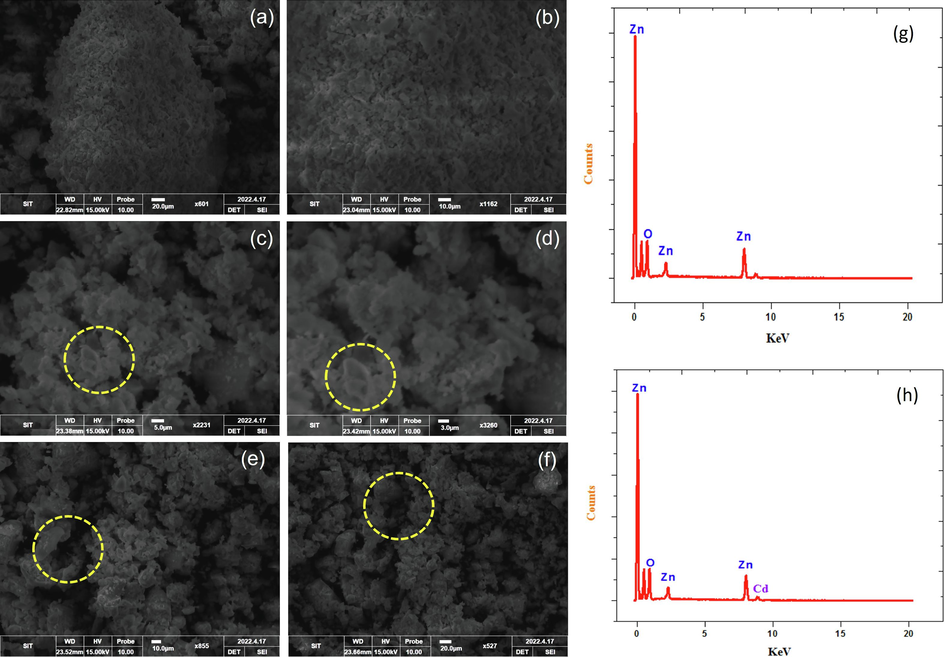
(a-f) SEM image of pure ZnO and; Cd doped ZnO nanocomposites; (g, h) EDAX spectrum of pure ZnO and Cd doped ZnO nanocomposites.
3.3 FTIR analysis & Raman studies
The functional group absorbed on the surface of produced nanoparticles during the precipitation method was detected using infrared spectroscopy. The FTIR spectra of ZnO nanoparticles acquired with the JASCO-FT-IR 460 plus spectrometer in the range 500 cm−1– 4500 cm−1 are shown in the Fig. 3(a). The stretching vibration of the intermolecular hydrogen bond (O—H) occurring between the absorbed water molecules correlates to the peak centered at 768 cm−1. The two weak bonds at 436 cm−1 and 457 cm−1, which correspond to the CH stretching modes, were well matched in the data. Pure ZnO lacks the vibrational frequency of 564 cm−1. As shown in Fig. 3(a), it also confirms the presence of Cd doped in ZnO angle lattice. In Cd-ZnO, the vibrational frequency of ZnO (485 cm−1) is moved to the lower frequency side (430 cm−1), showing that Cd is present in the nano lattices of ZnO (Gomes Miranda et al., 2021; Panimalar et al., 2022a; Kazemi et al., 2013). The impact of Cd on the molecular vibrational and stretching modes of ZnO nanoparticles is confirmed by Raman spectral analysis of pure ZnO and Cd doped ZnO nanocomposites. The Raman spectrum of pure ZnO and Cd doped ZnO nanocomposites as shown in Fig. 3(b), show three distinct peaks at 240 cm−1, 413 cm−1, and 521 cm−1, respectively. E2H - E2L multi-phonon process, A1 (transverse optical), and E2 High modes are the origins of these three scattering peaks, respectively. In addition, the spectra of Cd doped ZnO showed two peaks at 521 cm−1 and 645 cm−1. Second-order Raman processes can be blamed for the peak at 1118 cm−1. Due to structural flaws in the lattices of ZnO, the peak at 521 cm−1 was assigned to the E1L mode of ZnO. The presence of the E1L peak demonstrated that cadmium has been effectively incorporated into the ZnO lattices. In the ZnO nanocomposite system, where the surface properties of ZnO doped Cd are strongly dependent on grain size and distribution, oxygen vacancies and local disorder contribute to the introduction of new modes of Raman spectrum vibrations (Perumal et al., 2022). This could be due to the presence of cadmium ions and structural flaws in ZnO, such as vacant lattice sites or vacancy clusters, or local disorder, which can cause the lattice to shift and lose its symmetry.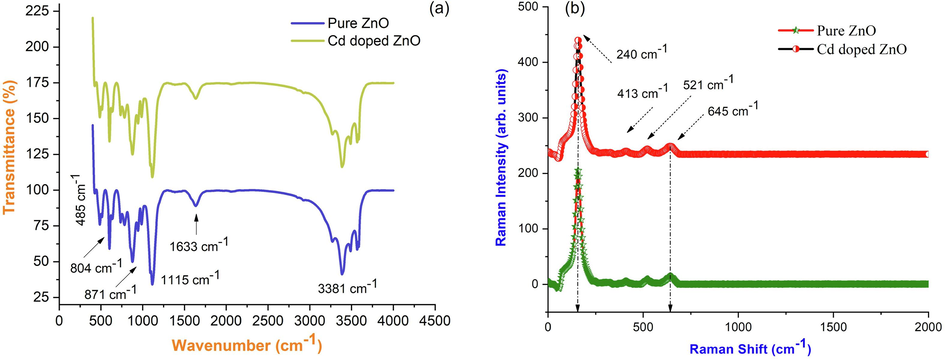
(a) FTIR spectrum, (b) Raman analysis of pure ZnO and Cd doped ZnO nanocomposites.
3.4 UV–vis-absorbance analysis & Photoluminescence studies
To investigate the optical properties of as-synthesized Cd doped ZnO nanocomposites were characterized by UV–visible spectroscopy. It refers to the number of light that the measuring model reflects and measures the amount of light that a sample returns. Fig. 4(a) shows the UV–vis spectra of Cd doped ZnO recorded at room temperature between 200 nm and 1200 nm. At 232 nm and 291 nm, the absorption spectra show a significant peak. The bandgap energy for pure ZnO and Cd doped nanocomposites was determined as Eg = 3.376 eV and 3.45 eV, respectively, using this absorption value in Planck's equation. E = hc/λ (eV); where, ‘h’ is Planck’s constant (6.626 × 10⁻³⁴Js), ‘c’ is the velocity of light (3 × 10⁸ m/s), ‘λ’ is the wavelength corresponding to the sharp absorbance. Fig. 4(b) shows the photoluminescence spectrum of pure ZnO and Cd doped ZnO nanocomposites. Photoluminescence is produced by the recombination of photogenerated charge carriers. An excitation wavelength of 361 nm is used to record the PL emission spectra. Peaks at 377 nm, 410 nm, 436 nm, and 489 nm were discovered in the PL spectra. The emission at 436 nm is caused by a defective band transition. The emission peaks of 436 nm and 489 nm are caused by electron recombination with oxygen vacancies. The emission at 3.37 eV, as well as a broad visible defect-related emission ranging from 2.3 eV to 1.7 eV.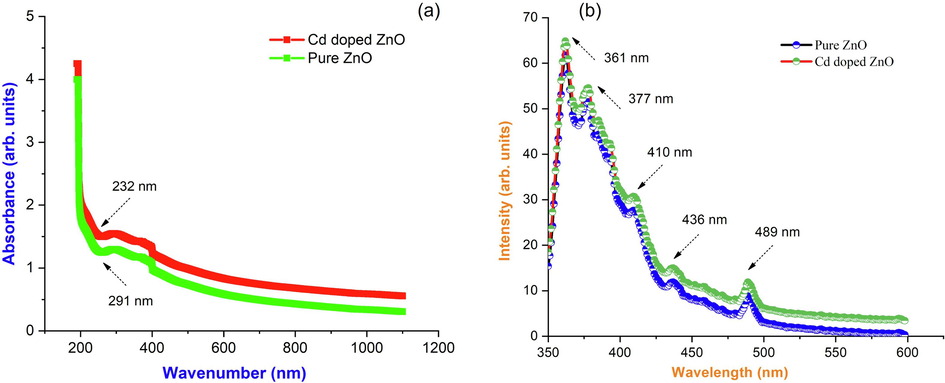
(a) UV–vis spectrum; (b) Photoluminescence spectrum of pure ZnO and Cd doped ZnO nanocomposites.
3.5 BET studies
The porous structure and specific surface area of zinc oxide and Cd doped ZnO nanocomposites. The photocatalytic activity of Cd doped ZnO was investigated using nitrogen adsorption -desorption analysis, which is crucial for photocatalysts. The pseudo-second-order model accurately represented the adsorption kinetics. Because of their mesoporous structure, both samples produce a type IV isotherm (Nwanya et al., 2015; Henni et al., 2016; Panimalar et al., 2020). Fig. 5(a-b) shows in comparison to bare ZnO (74.21 m2/g and 43.78 nm), the Cd doped zinc oxide photocatalyst has a large surface area (89.23 m2/g) and pore size (21.13 nm). During the dye degradation process, the larger pore size and volume contribute to effective electron transport.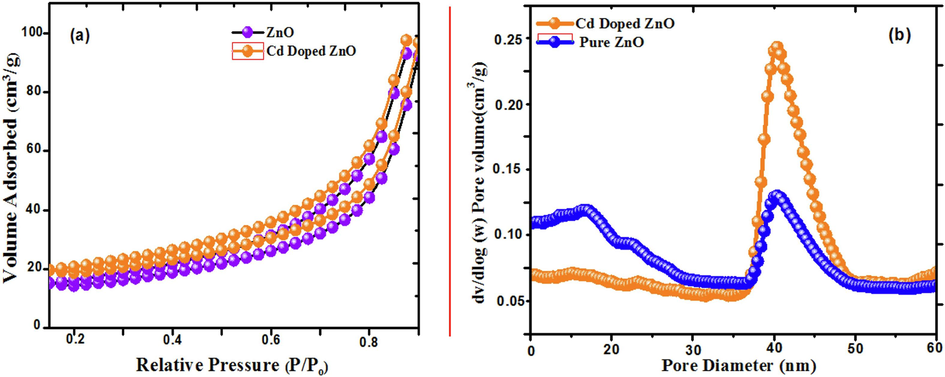
(a) N2 adsorption and desorption analysis of pure ZnO and Cd doped ZnO nanocomposites; (b) corresponding pore size distribution nanoparticles.
3.6 Photocatalytic activity
The photocatalysis process, in which contaminants are gradually oxidized into low molecular weight intermediate products and eventually transformed into CO2, H2O, and anions by introducing UV–visible radiation and appropriate nanoparticles on the contaminated site, is another promising mechanism for pollutant/contaminant removal from wastewater. Zinc oxide nanoparticles are the most widely utilized semiconductor photocatalyst in wastewater treatment due to their low toxicity, chemical stability, low cost, and abundance as a raw material (Tyona et al., 2018). However, as demonstrated in Fig. 6(a-b), zinc oxide nanoparticle can be an effective photocatalyst in absorbance of visible light. In comparison to commonly used ZnO, which absorbs UV light with wavelengths of 380 nm due to its broad bandgap of 3.2 eV, is an interesting n-type semiconducting material and a good choice for photodegradation under visible light settings. For up to 150 min, the synthesized material is exposed to visible light. The relationship is used to compute the absorption percentage of each specific substance. Degradation % = (Co-C)/Co × 100 %; where “Co” is the initial concentration of MB, whereas “C” is concentration of the dye at various interval times (mole/mL), meantime “t” is the illumination time (min) and “k” is the reaction rate constant. The experiments are carried out to assess the influence of the catalyst with visible light radiation on the degradation of MB dye and to generate a first-order kinetic constant illustration of C/Co, as shown in Fig. 6(c-d).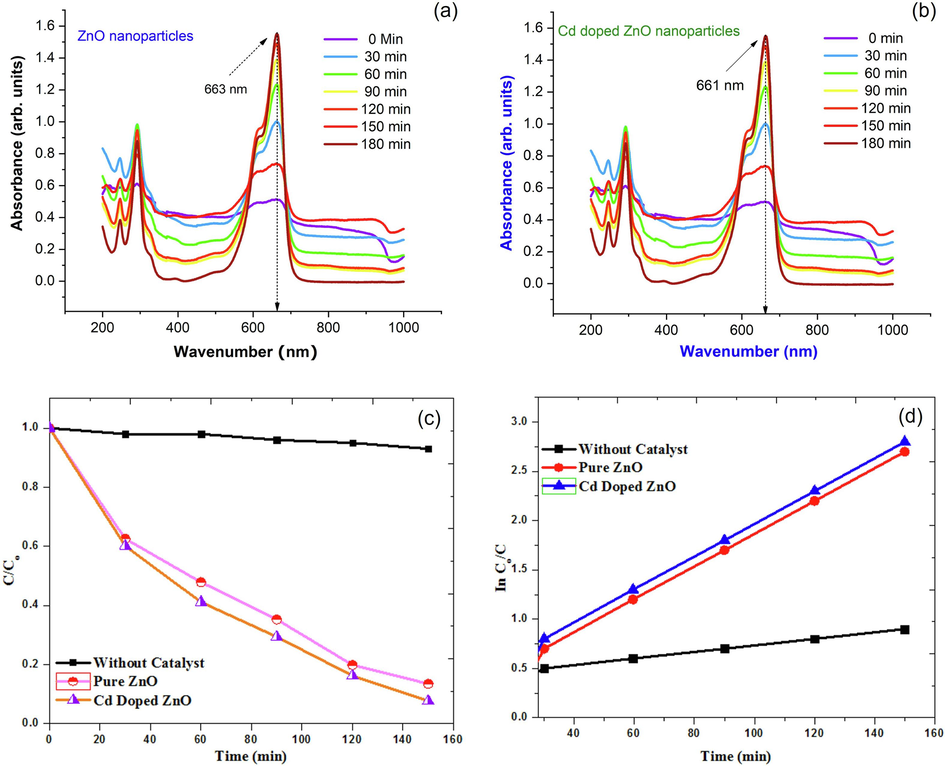
(a) UV–vis spectra during photocatalytic treatment of MB under UV-light irradiation of pure ZnO nanoparticles; (b) UV–vis spectra during photocatalytic treatment of MB under UV-light irradiation of Cd doped ZnO nanocomposites; (c) Plot of degradation efficiency (a) and C/Co versus irradiation time; (d) Plot of degradation efficiency of MB of pure ZnO and Cd doped ZnO nanocomposites.
The efficiency of degradation is calculated to be ∼85% for Cd doped ZnO nanocomposites. The deterioration graphs in Fig. 7(a) show that after exposing the test solution for 150 min, extremely good degradation results were obtained. The excitation of electrons from the valance band to the conduction band caused by photon absorption by Cd doped ZnO ions leads to charge separation, resulting in an electron in the conduction band (CB) and a hole in the valance band (VB).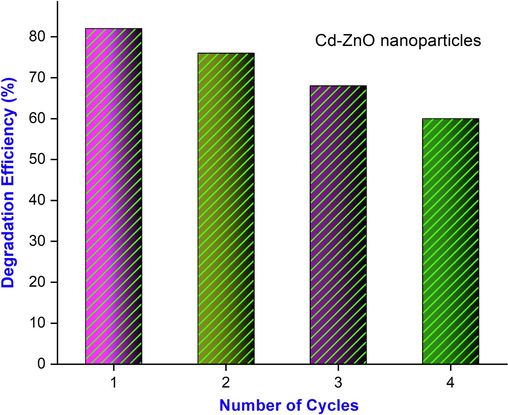
Photodegradation efficiency (%) of MB of Cd doped ZnO nanocomposites.
By using visible light, we examined the photocatalytic activity of Cd doped ZnO nanocomposites in methylene blue (MB) photodegradation. In Fig. 8 depicts the mechanism of MB photodegradation by Cd doped ZnO nanocomposites. Adsorption and electron transport are possible mechanisms by which Cd enhances ZnO nanocomposites photocatalytic activity. Indeed, the extremely reactive O2• combines with water molecules to generate hydrogen peroxide (H2O2), which then reacts with e− in the conduction band to form hydrogen peroxide (Okeke et al., 2020; Panimalar et al., 2022b). In fact, –OH radicals are produced by the effective photocatalyst due to light irradiation. Moreover, Fig. 6(a) shows how MB is photocatalyzed to degrade by photocatalysis. In addition, the photo-excited electrons (e−) are readily captured by Cd surfaces, which inhibits the recombination of (e−/h+) pairs. A radical is produced when photo-excited electrons combine with the O2 absorbed from solution by ZnO, leading to radical O2. As opposed to this, the photo - excited holes on the surface of Cd will react with –OH in order to form radicals •OH.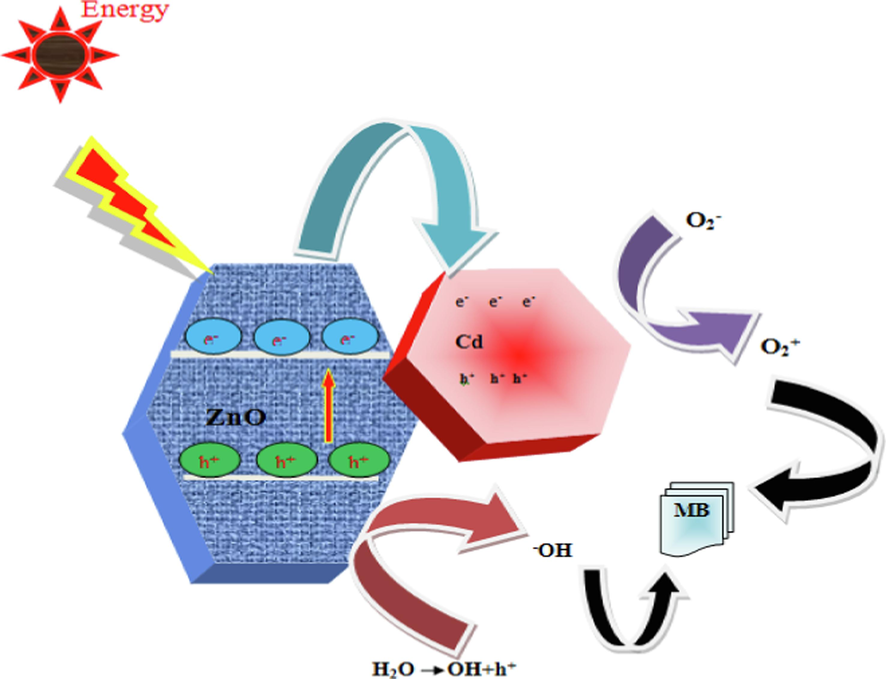
Schematic representation of photocatalytic mechanism of MB dyes using catalyst under visible light irradiation.
4 Conclusion
The high photocatalyst of Cd doped ZnO nanostructures were successfully synthesized via an efficient hydrothermal method. The synthesized ZnO nanoparticles are subjected to XRD analysis gives wurtzite hexagonal phase of ZnO and size is found to be 21 nm for ZnO and 18 nm for Cd doped ZnO nanocomposites. With TEM images, the structure of the synthesized particles is confirmed; all the particles appear cubic and somewhat agglomerated. The FTIR analysis confirmed the possible functional groups of O—H stretching vibrations and C—H stretching modes involved in ZnO nanoparticles and the presence of Cd doping ions. Photoluminescence experiments on Cd doped ZnO show the typical emission peaks caused by electron recombination with oxygen vacancies. The optical analysis revealed the tuning of optical bandgap energy in the range of 3.21 eV–3.47 eV. The BET study on Cd doped ZnO nanocomposites shows a high surface area and pore size compared to bare ZnO. During the dye degradation process, the larger pore size and volume contribute to effective electron transport. In the study of photodegradation under visible light irradiation, it was discovered that prepared Cd doped ZnO nanostructures played a key role in the photocatalytic activity, the Cd doping in the ZnO nanostructure acted as an electron scavenger, stopping electron - hole (e−/h+) pairs from recombination on the surface of ZnO nanoparticles and thereby enhancing charge transfer. The photodegradation efficiency of Cd doped ZnO reaches 97%, which is higher than those of the pure ZnO (90%). The finding of such a structural property association might lead to an improved understanding of Cd doped ZnO nanostructures, granting the effect of degradation performances for wastewater treatment.
Declaration of competing interest
The authors declare that they have no known competing financial interests or personal relationships that could have appeared to influence the work reported in this paper.
References
- Preparation and characterization studies of pure and Li+ doped ZnO nanoparticles for optoelectronic applications. Mater. Today: Proc.. 2021;36:228-231.
- [Google Scholar]
- Kaviyarasu Specific charge separation of Sn doped MgO nanoparticles for photocatalytic activity under UV light irradiation. Sep. Purif. Technol.. 2022;294:121189.
- [Google Scholar]
- Preparation, characterization, and electrical study of nanocomposites. American. J. Polym. Sci.. 2012;2(6):135-140.
- [Google Scholar]
- Zinc oxide nanoparticles: synthesis, antimicrobial activity and food packaging applications. Food Bioproc. Tech.. 2012;5:1447-1464.
- [Google Scholar]
- High performance photo-catalyst based on nanosized ZnO - TiO2 nanoplatelets for removal of RhB under visible light irradiation. J. Adv. Microsc. Res.. 2018;13(1):12-19.
- [Google Scholar]
- Raman spectroscopy study of Ga-doped ZnO ceramics: An estimative of the structural disorder degree. Phys. B Condens. Matter. 2021;606:412726
- [Google Scholar]
- Optical, structural, and photoelectrochemical properties of nanostructured ln-doped ZnO via electrodepositing method. J. Solid State Electrochem.. 2016;20(8):2135-2142.
- [Google Scholar]
- Photodegradation of organic pollutants RhB dye using UV simulated sunlight on ceria based TiO2 nanomaterials for antibacterial applications. Sci. Rep.. 2016;6:1-12.
- [Google Scholar]
- Photoluminescence of well-aligned ZnO doped CeO2 nanoplatelets by a solvothermal route. Mater. Lett.. 2016;183:351-354.
- [Google Scholar]
- ZnO nanoparticles as ethanol gas sensors and the effective parameters on their performance. J. Mater. Sci. Technol.. 2013;29(5):393-400.
- [Google Scholar]
- Current trends of Silver doped Zinc oxide nanowires photocatalytic degradation for energy and environmental application. Surf. Interfaces. 2021;23:100931
- [Google Scholar]
- Photocatalytic degradation of methylene blue dye using F doped ZnO/polyvinyl alcohol nanocomposites. Mater. Lett.. 2022;322:132473
- [Google Scholar]
- Synthesis, characterization and gas-sensing properties of SILAR deposited ZnO-CdO nano-composite thin film. Sens. Actuat. B: Chem.. 2015;206:671-678.
- [Google Scholar]
- Impact of Cu doping on ZnO nanoparticles phyto-chemically synthesized for improved antibacterial and photocatalytic activities. J. Nanopart. Res.. 2020;22:272.
- [Google Scholar]
- Zinc oxide nanoparticles in modern sunscreens: an analysis of potential exposure and hazard. Nanotoxicology. 2010;4:15-41.
- [Google Scholar]
- Studies of MnO2/g-C3N4 hetrostructure efficient of visible light photocatalyst for pollutants degradation by sol-gel technique. Surf. Interfaces. 2020;20:100512.
- [Google Scholar]
- Reproducibility and long-term stability of Sn doped MnO2 nanostructures: Practical photocatalytic systems and wastewater treatment applications. Chemosphere. 2022;293:133646
- [Google Scholar]
- Effect of Ag doped MnO2 nanostructures suitable for wastewater treatment and other environmental pollutant applications. Environ. Res.. 2022;205:112560.
- [Google Scholar]
- Enhancing the photocatalytic performance of surface - Treated SnO2 hierarchical nanorods against methylene blue dye under solar irradiation and biological degradation. Environ. Res.. 2022;209:112821.
- [Google Scholar]
- Structural, FTIR and photoluminescence studies of Fe doped ZnO nanopowder by co-precipitation method. Spectrochim. Acta A Mol. Biomol. Spectrosc.. 2014;131:183-188.
- [Google Scholar]
- Structural, optical, photocatalytic and antibacterial activity of zinc oxide and manganese doped zinc oxide nanoparticles. Phys. B Condens. Matter. 2010;405(15):3180-3185.
- [Google Scholar]
- Dye-sensitized solar cells based on Al-doped ZnO photoelectrodes sensitized with rhodamine. Mater. Lett.. 2018;220:281-284.
- [Google Scholar]
- Ultrasensitive cholesterol biosensor based on low-temperature grown ZnO nanoparticles. Electrochem. Commun.. 2009;11(1):118-121.
- [Google Scholar]
- Rapid photocatalytic degradation of 2, 4-dichlorophenoxy acetic acid by ZnO nanoparticles synthesized using the leaf extract of Muntingia calabura. J. Mole. Struct.. 2022;1263:133127.
- [Google Scholar]
- High response n-propanol sensor based on co-modified ZnO nanorods. J. Alloy. Compd.. 2022;910:164971.
- [Google Scholar]


