

Translate this page into:
Weed phyto-sociology and diversity in relation to conservation agriculture and weed management strategies in Northwestern Himalayas of India
⁎Corresponding author. tauseef.anwar@iub.edu.pk (Tauseef Anwar),
-
Received: ,
Accepted: ,
This article was originally published by Elsevier and was migrated to Scientific Scholar after the change of Publisher.
Peer review under responsibility of King Saud University.
Abstract
To create weed management techniques capable of improving agroecosystem sustainability, it is essential to comprehend the different weed flora composition and diversification dynamics in conservation agriculture production systems. In North Western Himalaya from 2018 to 2020, evaluation of various tillage techniques with and without residue incorporation and weed management techniques on diverse weed flora composition was performed. Fifteen treatment amalgamations of five tillages viz. CT (conventional tillage) in maize-CT in wheat, CT-ZT (ZT, zero tillage), ZT-ZT, ZT-ZTR (ZTR, zero tillage in amalgamation with remainder integration) & ZTR-ZTR and three weed management practices viz. H (suggested herbicide in maize)-H (suggested herbicide in wheat), IWM-IWM (IWM, integrated weed supervision) & HW-HW; (HW, hand weeding) were calculated in strip plot design. Significant differences (p = 0.05) of weed density and total weed count were recorded during summer (maize) and winter (wheat) seasons. Among tillage treatments, lowest weed population and total weed population were recorded in conservation tillage (ZTR-ZTR) in summer and conservative tillage followed by zero tillage in winter season (CT-ZT), respectively. IWM-IWM and H-H had a least weed population and total weed population in summer and winter seasons, respectively. Highest important value index during summer and winter seasons was recorded in Echinochloa colona (55.90%) and Avena ludoviciana (76.99%), respectively. Higher Shannon Wiener index and Evenness were recorded for CT+HW-CT+HW (1.83, 0.91) and ZT+IWM-ZTR+IWM (1.73, 0.86) which indicate higher weed species diversity during summer and winter seasons, respectively. ZTR-ZTR led to less diverse weed diversity compared to intensive conventional tillage (CT-CT) practices. However, higher Simpson’s diversity was recorded for CT+HW-CT+HW, i.e. 0.83 and 0.82 for maize and wheat, respectively, compared to the other conventional tillage treatments. This study helps in understanding the crop-weed relation such that the implementation of sound and economic weeds management strategies. Further, long-term experiments are required in order to interpret the complicated relationships of diverse weed species under different tillage and weed management strategies for sustainable and adoptive conservation agriculture production system for North Western Himalayas.
Keywords
Abundance
Conservation agriculture
Diversity
Tillage
Weed management

1 Introduction
Intensive tillage, skewed pesticides application and outrageous irrigation may cause degradation of soil, water and environment and led to serious upheavals (Penescu et al., 2001). Crop-weed competition for light, space, nutrients and water reduce the productivity and quality of the produce (Soltani et al., 2018). Although, farmers take up various weed management strategies to curtail the reduction of crop produce (Zhang and Wu, 2021). Yet, farmers are currently concentrating their usage of chemical herbicides on suppressing a variety of weed flora, which has resulted in a severe problem with weed herbicide resistance and environmental risks (Gu et al., 2019). Agronomic exercises such as crop rotation, tillage (Baghel et al., 2020; Yang et al., 2018), residue retention (Price et al., 2018) and intercropping are effective measures to control diverse weed flora. Zero tillage (ZT) has various environmental advantages, including a decrease in soil and water pollution, a decrease in runoff and soil degradation, improved nutrient cycling, and activities of soil macro and micro flora (Holland, 2004). Farmers' extensive implementation of zero tillage (ZT) has been highlighted as being hindered by the retention of weed seeds near or on the soil surface induced by ZT's little soil disturbance (Naeem et al., 2021). Yang et al. (2018). Besides, weed seeds at soil surface in ZT experienced rapid desiccation cause decrease in germination, emergence and weed seed bank (Peixoto et al., 2020) found that in ZT production system.
Yang et al. (2018) found that crop residue retention/incorporation is an effective weed management method for reducing weed diversity and biomass accumulation, but it also increases the likelihood of being infected by soil fungus, pathogens, and microorganisms (Kulkarni et al., 2017). Crops have an early competitive advantage over weeds because of the amount and kind of covering material that delays weed germination (Chauhan and Mahajan, 2012). But some studies have also found that agricultural residue may discharge allelo-chemicals that prevent weed seeds from sprouting and evolving (Duke, 2015). However, ZT without crop rotation and enough soil cover results in soil deterioration, a high weed, insect, and disease problem, which lowers crop output (Verhulst et al., 2011). Herbicides application is the key tool to manage the weeds in current agriculture scenario due to their high efficacy, low cost and ease of application (Chauhan et al., 2012). However, the application of herbicides is not a complete solution for the management of wide range of weeds.
In order to control the diverse weed population and decrease the risk of herbicide confrontation, environmental degradation, and pollution, integrated weed management (IWM) is a combination of two or more weed management tactics (Korres et al., 2019). Mulch cover, however, makes mechanical weed management and human weeding in California more challenging, which increases reliance on chemical weed control measures. Yet, crop rotation and crop diversification are two successful weed management strategies in California (Weisberger et al., 2019). However, the application of reduced herbicides along with crop rotation is an effective measure to control problematic weed species (Locke et al., 2002).
Competition by weeds is the major reason for the low crop productivity and may reduce the grain yield from 7 to 50 per cent in wheat (Kurchania et al., 2000) and 27–60 per cent in maize crop (Kumar et al., 2015). However, due to manpower shortages during the height of crop growth and high laborer wages in the commercial agriculture production system, weed management in the North Western Himalayas mostly relies on the use of prescribed herbicides (atrazine in maize and vesta, isoproturon in wheat crop). Consequently, aim of the current experiment was to ascertain how the weed composition, phyto-sociology, and diversity changed when tillage, residue, and various weed control techniques were used in a cropping system involving maize (Zea mays L.) and wheat (Triticum aestivum L.).
2 Material and methods
2.1 Study area
At the CSK Himachal Pradesh Krishi Vishvavidyalaya's Research Farm of Agronomy in Palampur (H.P.), India (3206′ N, 76°3′ E, 1280 m above mean sea level), a field experiment was conducted from the summer of 2018 through the winter of 2019–2020. The experimental location features a mid-hill zone with a sub-temperate environment and is located at 1290 m above mean sea level. As silty clay loamy with 21% clay, 43% silt, and 36% sand, the soil at the experimental site is classified by the USDA.
2.2 Experimental details
Table 1 provides a quick summary of the experimental therapies. Both years' summer and winter seasons saw the delivery of pre-sowing irrigation at a depth of 5 cm. With the exception of the zero tillage treatment, a rotary power tiller was used to prepare the plots. The conventional tillage (CT) plots were prepared for the experiment by being plowed to a fine tilth. This was accomplished by leveling, harrowing twice, and plowing once. There was no additional fertilizer applied to the intercrops of soybean grown in additive series and mustard grown in replacement series. The recommendations of the package of practices were followed in the application of all other production methods, excluding tillage and weed control measures, to both crops. Every single one of the main crops and intercrops was manually harvested when it was time. * intercropping of soybean in maize, ** intercropping of mustard in wheat.
a)
Treatments for horizontal plots' tillage and residue management
Maize crop
Wheat crop
Tillage
Residue retention
Tillage
Residue retention
T1 - Conventional tillage (CT)
No
T1 - Conventional tillage (CT)
No
T2 - Conventional tillage (CT)
No
T2 - Zero tillage (ZT)
No
T3 - Zero tillage (ZT)
No
T3 - Zero tillage (ZT)
No
T4 - Zero tillage (ZT)
No
T4 - Zero tillage + residue (ZTR)
Yes; maize residue
T5 - Zero tillage + residue (ZTR)
Yes; wheat residue
T5 - Zero tillage + residue (ZTR)
Yes; maize residue
b
Weed management (Vertical plots) treatments
Weed management
Intercropping
Weed management
Intercropping
W1 - Recommended herbicides (atrazine fb 2,4-D)
No
W1 - Recommended herbicides (isoproturon fb 2,4-D)
No
W2 - IWM (Intercropping* + pendimethalin spray + hand weeding)
Yes; Soybean intercropping
W2 - IWM (Intercropping** + isoproturon spray + hand weeding)
Yes; Sarson intercropping
W3 - Hand weeding (one hand weeding)
No
W3 - Hand weeding (one hand weeding)
No
2.3 Count of weed
A 0.5 m × 0.5 m quadrate was used to count weeds in both crops, and the mean value of two was calculated. The quadrate was placed at two random locations inside each experimental unit. To determine the overall weed density in a given treatment, the populations of several weed species were added. By adding together each individual weed count made during the observing period, the total weed count was calculated.
2.4 Data analysis
2.4.1 Weed phyto-sociology
The study of the links between weed populations and various crops and cropping systems, which influence the periods of control and/or coexistence between crops and weeds, is attempted in agro-ecosystems using phyto-sociological surveys. When a species' relative density, relative frequency, and relative abundance are calculated as a percentage of the total plant density and summed together, the result is provided as the species' Important Value Index (IVI).
Various diversity Indices were calculated as follows:
2.4.2 Species richness (Sr)
It is a way to gauge how many different weed species are present in a given area. It was determined as follows: where “S“ is the number of species and ”N“ denotes every single organism in a sample.
2.4.3 Species diversity
It serves as a gauge for the diversity of species present as well as their relative dominance or equality within a specific community. Shannon and Weaver (1949) used the following equation to create the Shannon-Weaver diversity index, which measures the diversity of species:
Calculated in this case is the proportion of species I to all species (pi). The values were then added up across species and multiplied by −1. Then multiply it by the natural logarithm of this ratio (ln pi).
2.4.4 Simpson’s index
It is calculated as follow: or where N is the total number of organisms in all species, s is the number of species with this index, 0 indicates infinite variety, and 1 indicates no diversity, n is the total number of organisms in a given species.
2.4.5 Evenness/ Shannon’s equitability (EH)
H is divided by Hmax, where Hmax equals LnS, to calculate it. Equitability presupposes values between 0 and 1, with 1 representing perfect evenness, i.e.
2.5 Statistical analysis
With the use of the analysis of variance (ANOVA) method and the OPSTAT statistical package, the weed count data (No. m−2) were examined. Fischer's least significant test with a 5% probability threshold was used to evaluate differences in standard error (SE) and least significant difference (LSD) across different tillage and weed management treatment means (Gomez and Gomez, 1984). With the GraphPad Prism 8.0.2 program, the figure was produced.
3 Results
3.1 Weed distribution
Eight and seven weed species, respectively, were seen throughout the summer months in all treatments during the first and second years. The two most common weeds during the first year were Ageratum conyzoides and Commelina benghalensis, which together made up 24 and 21% of the entire weed flora. In contrast, the two main weeds during the second year were Echinochloa colona and Digitaria sanguinalis, which together made up around 25% and 15% of the whole weed inhabitants, respectively. In all of the experiments during the winter, seven weed species were identified. In both years, Daucus carota and Avena ludoviciana were the most prevalent weeds. However, during the first year of the field experiment, Lolium temulentum, Poa annua, and Vicia sativa made up roughly 15%, 14%, and 10% of the total, but during the second year, 16, 12%, and 10%, respectively, of the total.
3.1.1 Density of weeds in maize crop
The pooled data on the densities of various grasses and wide-leaf weeds were significantly impacted by tillage and weed management techniques (p = 0.05) (Table 2). Conservation production system (ZTR-ZTR) resulted in lower population of sedge (Cyperus iria), grassy weed (Echinochloa colona) and broad-leaved weeds (Commelina benghalensis, Ageratum conyzoides and Bidens pilosa) which remained statistically (p = 0.05) similar with CT in maize and ZT in wheat (CT-ZT) compared to tillage treatments. Digitaria sanguinalis, on the other hand, was less prevalent in CT-ZT, which remained statistically comparable with ZT-ZTR and ZTR-ZTR. In CT-CT and ZT-ZTR, where Parthenium hysterophorus populations were lower but statistically similar to CT-ZT, this phenomenon was also observed. The presence of Parthenium hysterophorus was in the cropped land was recorded first time during 2018–2019 might be due to the transportation of this troublesome weed seeds with farm equipments which was completely eradicated by hand pulling before the flowering such that further spread of this nasty weed could be achieved in the cropped land. Of the total weeds during summer season, lowest weeds (No. m−2) were appeared in ZTR-ZTR (13.4%), although ZT-ZT (22.1%) and CT-CT (25.5%) had the highest levels of weeds, respectively. Lowest individual weed population of Cyperus iria (13.7%), Commelina benghalensis (13.4%) and Ageratum conyzoides (7.7%) was recorded in ZTR-ZTR, otherwise the density of Panicum dichotomiflorum (17.5%) and Polygonum alatum (6.4%) was minimum in ZT-ZTR. However, Parthenium hysterophorus was not appeared in CT-CT and ZT-ZTR which was highest in ZT-ZT (48.7%). The figures presented are the average of three replications with five tillage and three weed management treatments (combination = 15). *DAS, Days following planting; R stands for residues, H for herbicide, and ZT stands for zero tillage. IWM, or integrated weed management; hand weeding; Least Significant Differing, SEm, or standard error of the mean; The means that differ substantially among treatments are denoted by various letters in superscript (p0.05 for the least significant difference). CT-CT, or conventional tillage, is used in wheat and maize; CT-ZT, or conventional tillage in corn, then zero tillage; ZTR-ZTR, zero tillage + residue retention in maize and wheat crops; ZT-ZTR, zero tillage in maize followed by zero tillage + residue retention in wheat; IWM-IWM, or integrated weed management, is recommended for use in maize and wheat crops. in maize and wheat crops, HW-HW, hand weeding.
Treatment
(Maize -wheat)Cyprus iria
Commelina
bengalensis
Digitaria sanguinalis
Ageratum conyzoides
Echinochloa colona
Panicum dichotomiflorum
Parthenium hystrophorus
Polygonum alatum
Bidens pilosa
Tillage
CT-CT
9.1ab
19.7c
13.7c
32.0d
20.8b
4.4
0.0a
9.1c
5.3c
CT-ZT
8.8ab
13.1ab
5.1a
21.5c
18.2ab
6.2
0.6ab
10.2c
1.3ab
ZT-ZT
11.7b
15.3b
13.1c
23.1c
24.6c
4.6
2.0b
3.1ab
1.3ab
ZT-ZTR
10.6b
21.3c
7.3ab
12.6ab
27.1c
4.4
0.0a
1.7a
4.0c
ZTR-ZTR
6.4a
10.8a
8.2ab
7.5a
16.6a
5.5
1.5b
2.4ab
1.1a
SEm±
1.1
1.7
1.6
3.6
1.5
1.4
0.6
1.0
1.1
LSD (p = 0.05)
2.7
3.9
3.7
8.4
3.6
NS
1.4
2.5
2.6
Weed management
H-H
11.3b
15.6
8.5
19.0b
20.9b
5.8b
0.9
3.0a
1.7a
IWM-IWM
4.2a
15.0
9.7
25.6c
11.2a
1.7a
1.2
5.2ab
1.3a
HW-HW
12.5b
17.6
10.2
13.4a
32.4c
7.6b
0.4
7.7b
4.8b
SEm±
1.9
0.8
0.8
1.6
1.6
1.4
1.1
0.9
0.5
LSD (p = 0.05)
5.2
NS
NS
4.6
4.6
4.0
NS
2.7
1.5
Weed management treatments significantly affect the pooled density (No. m−2) of all the weeds except for Commelina bengalensis, Digitaria sanguinalis and Parthenium hystrophorus. Among different weed management treatments, IWM-IWM (27.9%) recorded lower percent of total weeds during summer season followed by H-H (32.3%). IWM-IWM reported lower weed density (No. m−2) of Cyperus iria (4.2 m−2), Echinochloa colona (11.2 m−2), Panicum dichotomiflorum (1.7 m−2) and Bidens pilosa (1.3 m−2). However, H-H had lower weed percentage of Digitaria sanguinalis (29.9%) and Polygonum alatum (18.8%), whereas, Ageratum conyzoides (23.1%) and Parthenium hysterophorus (16%) were minimum in HW-HW.
3.1.2 Density of weeds in wheat crop
Pool density of diverse weed flora during winter season has been given in Table 3. Tillage treatments significantly (p = 0.05) affect the weed density at maximum weed population stage except for Coronopus didymus. ZT-ZTR reported a lower Lolium temulentum population (13.2%) but statistically remained statistically equal to ZT-ZT and ZTR-ZTR. Population of Avena ludoviciana (12.3%), Vicia sativa (6.7%) and Phalaris minor (6.1%) was lower in CT-ZT. Lowest population of Coronopus didymus (7.3%) was reported in ZT-ZT followed by CT-ZT (18.5%). Daucus carota, a perennial broad-leave weed, was minimum in CT-CT followed by ZTR-ZTR. ZT-ZTR accumulated higher proportion of Daucus carota (39.3%) followed by CT-ZT (19.4%). The figures presented are the average of three replications with five tillage and three weed management treatments (combination = 15). Days after Sowing (DAS), Conventional Tillage (CT), Zero Tillage (ZT), Residues (R), Herbicide (H), Integrated Weed Management (IWM), Hand Weeding (HW), Least Significant Difference (LSD), SEm, or standard error of the mean; The means that differ substantially among treatments are denoted by various letters in superscript (p0.05 for the least significant difference). ZT-ZT, zero tillage in maize and wheat; ZT-ZTR, zero tillage + residue retention in maize and wheat crops; CT-ZT, conventional tillage in maize followed by zero tillage in wheat; CT-ZTR, zero tillage + residue retention in maize and wheat crops; Herbicides for maize and wheat crops are advised by H-H; Integrated weed management for maize and wheat crops (IWM-IWM); in maize and wheat crops, HW-HW, hand weeding.
Treatment
(Maize -wheat)Lolium temulentum
Avena ludoviciana
Vicia sativa
Phalaris minor
Coronopus didymus
Daucus carota
Poa anuua
Tillage
CT-CT
11.7c
24.4c
9.3c
9.1c
4.0
7.3a
3.3a
CT-ZT
19.3d
11.7a
2.6a
1.3a
3.3
18.4b
7.7ab
ZT-ZT
9.7abc
13.1ab
5.5b
2.8a
1.3
16.8b
15.1c
ZT-ZTR
7.5a
15.3ab
3.3ab
6.8b
3.7
37.1c
8.6b
ZTR-ZTR
8.2ab
30.4c
18.0d
1.3a
5.5
14.8b
8.6b
SEm±
1.4
3.0
1.0
1.2
1.4
2.8
2.2
LSD (p = 0.05)
3.3
7.0
2.4
2.8
NS
6.6
5.1
Weed management
H-H
4.9a
19.7
3.4a
0.0a
1.2a
9.7a
3.6a
IWM-IWM
21.0c
22.2
12.8c
6.2b
2.6a
27.3c
4.8a
HW-HW
8.0ab
15.0
7.0b
6.6b
6.9b
19.7b
17.7c
SEm±
1.9
2.3
0.9
1.0
1.5
3.3
2.1
LSD (p = 0.05)
5.4
NS
2.5
2.9
4.2
9.4
6.1
Among tillage treatments, Conservation agriculture (ZTR-ZTR) resulted in maximum proportion of weeds (23.6%) followed by ZT-ZTR (22.4%) might be due to the presence of higher population of Vicia sativa and Avena ludoviciana. Weed control treatments significantly (p = 0.05) affect the population of diverse weed flora except for Avena ludoviciana. H-H resulted in lower weed density proportion than HW-HW and IWM-IWM i.e. 19.2%, 36.7% and 43.9%, respectively. Lolium temulentum had a lower density proportion in H-H (14.4%) which remained statistically alike with HW-HW (23.5%). Vicia sativa (3.4 m−2), Phalaris minor, Coronopus didymus (1.2 m−2), Poa annua (3.6 m−2) and Daucus carota significantly decreased in density after the application of the suggested herbicides (H-H) (9.7 m−2). However, the density proportion of Avena ludoviciana was lower in HW-HW (26.3%) followed by H-H (34.6%).
3.1.3 Total weed count (maize and wheat)
During the summer and winter seasons, tillage and weed supervision experiments had a significant (p = 0.05) impact on fluctuation of the pooled total weed density (TWD) (No. m−2) (Fig. 1). Lower TWD was recorded during 30 DAS in maize crop which increased as crop growth period advance. However, total density of the weeds reduced as crop approaches to the harvesting.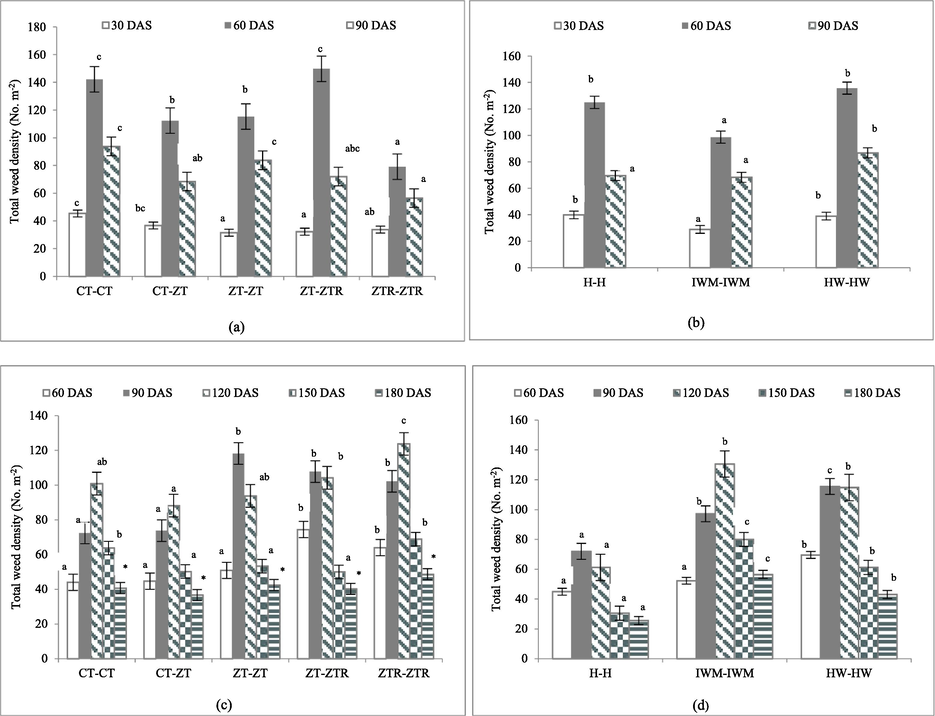
Significant (p = 0.05) effect of treatments on total weed count (No. m−2) in maize (a: tillage; b: weed management) and wheat crop (c: tillage; d: weed management). Error bars represent SE. *: represent non-significant.
During initial crop growth phase, conventional tillage (CT-CT) had higher total weed density compared to the conservation production system (ZTR-ZTR) and zero tillage (ZT-ZT). In comparison to zero tillage treatments without residue applied at 60 and 90 DAS of maize, the TWD was considerably lower when residue was applied in combination with zero tillage. Maximum TWD was recorded at 60 DAS; which was lower in ZTR-ZTR compared to ZT-ZT and CT-CT which were comparable to each other. ZTR-ZTR and ZT-ZTR were statistically comparable with one another and had lower TWD. IWM-IWM had significantly lower TWD during all the observational periods. Application of hand weeding (HW-HW) had higher TWD during 60 and 90 DAS in summer maize crop. With the exception of 180 DAS in the winter wheat crop, weed control and tillage treatments significantly (p = 0.05) varied TWD.
3.2 Phyto-sociology of summer season weeds
According to Concenço et al. (2017), phyto-sociology of weeds reveals a pattern of variation in plant populations within a crop, and these changes are related to production techniques. This information is then used to support various weed control strategies. A highly important value index would be present in the dominating weed species. Important value index (IVI) has been given for fifteen tillage and weed management treatment combinations (Table 4). A total of eight weed species, which have annual type of life span, were identified in the experimental area. IVI was differed with tillage and weed management treatments. The highest averaged IVI of all the weeds was recorded for Echinochloa colona (55.90%), followed by Commelina benghalensis (54.83%), and Ageratum conyzoides (50.28%). In regard to all the weeds, ZTR+H-ZTR+H and ZT+HW-ZT+HW had the highest IVI of Echinochloa colona. ZT+H-ZTR+H and ZT+IWM-ZTR+IWM, on the other hand, showed the highest Commelina benghalensis IVI levels. The Parthenium hysterophrus weed had the lowest averaged IVI of all the weeds (4.10%); however, the summertime treatment combination CT+HW-ZT+HW had the highest averaged IVI of all the treatments. The values in the table represent the combined effects of tillage and weed control measures. *CT, conventional tillage; ZT, zero tillage; ZTR, zero tillage combined with residue; Integrated weed management, hand weeding, and approved pesticides all begin with the letter H. tillage and weed control treatments are combined to form treatments; CT+H-ZT+H, conventional tillage in maize followed by zero tillage in wheat in combination with recommended herbicides in maize and wheat; CT+IWM-ZT+IWM, conventional tillage in combination with integrated weed management in maize and wheat; CT+HW-CT+HW, conventional tillage in combination with hand weeding in maize and wheat; and CT+HW-CT+HW conventional tillage in maize followed by zero tillage in wheat, together with integrated weed control in both crops; ZT+H-ZT+H, Zero tillage in maize and wheat combined with advised herbicides in maize and wheat; CT+HW-ZT+HW, Conventional tillage in maize followed by zero tillage in wheat in combination with hand weeding in maize and wheat; ZT+HW-ZT + HW, Zero tillage in maize and wheat in combination with hand weeding in maize and wheat; ZT+IWM-ZT+IWM, Zero tillage in maize and wheat in combination with integrated weed management in maize and wheat; ZT+H-ZTR+H, Zero tillage in maize followed by zero tillage + residue retention in wheat in combination with suggested herbicides for use in maize and wheat; ZT+IWM-ZTR+IWM, Zero tillage in maize followed by zero tillage + residue retention in wheat in combination with suggested herbicides for use in maize and wheat; ZT+HW-ZTR+HW, Zero tillage in maize followed by zero tillage + residue retention in wheat in combination with suggested hand.
Weed species
Treatments
Cyperus iria
Commelina benghalensis
Digitaria sanguinalis
Ageratum conyzoides
Bides pilosa
Panicum dichotomiflorm
Echinochloa colona
Polygonum alatum
Parthenium hysterophorus
CT+H-CT+H
55.90
50.75
46.80
60.20
12.50
18.20
46.65
9.0
0.0
CT+IWM-CT+IWM
30.55
57.10
27.35
78.15
16.80
19.15
39.65
21.95
9.30
CT+HW-CT+HW
44.95
47.05
40.05
44.60
28.35
19.00
48.70
27.30
0.0
CT+H-ZT+H
66.25
39.90
32.35
50.65
14.50
27.80
47.55
21.05
0.0
CT+IWM-ZT+IWM
14.40
58.95
39.35
83.70
15.95
19.65
42.35
25.55
0.0
CT+HW-ZT+HW
42.85
55.45
29.80
28.85
6.75
26.60
60.05
33.65
15.95
ZT+H-ZT+H
32.50
58.20
55.25
49.95
16.00
13.00
56.15
13.85
5.05
ZT+IWM-ZT+IWM
33.60
53.50
46.50
71.55
15.20
7.70
43.05
16.75
12.10
ZT+HW-ZT+HW
53.25
39.70
39.35
35.15
18.00
20.90
79.40
14.25
0.0
ZT+H-ZTR+H
51.10
63.45
34.10
54.65
14.15
22.00
60.60
0.0
0.0
ZT+IWM-ZTR+IWM
24.00
67.85
50.85
53.60
25.75
0.0
52.80
25.10
0.0
ZT+HW-ZTR+HW
41.55
46.80
46.50
47.90
21.20
24.45
62.70
8.85
0.0
ZTR+H-ZTR+H
42.35
62.90
58.65
26.45
4.60
17.80
79.55
0.0
7.70
ZTR+IWM-ZTR+IWM
61.45
73.50
35.35
27.40
9.60
23.35
60.90
0.0
8.40
ZTR+HW-ZTR+HW
37.90
47.40
51.40
41.35
14.90
22.40
58.40
23.25
3.0
Overall
42.17
54.83
42.24
50.28
15.62
18.80
55.90
16.04
4.10
3.3 Phyto-sociology of winter season weeds
Avena ludoviciana, Poa annua, and Lolium temulentum were the three weed species with the highest averaged total IVI values throughout the winter season among the seven (six annual and one perennial) weed species. (Table 5). The IVI average for Coronopus didymus, however, was the lowest (15.66%) of all the weeds. Following CT+H-CT+H came ZTR+H-ZTR+H as the treatment plan with the greatest IVI for Avena ludoviciana. Nevertheless, Lolium temulentum had the highest IVI in CT+H-CT+H and CT+IWM-ZT+IWM. Phalaris minor had a higher IVI value in the experiments CT+H-ZT+H and ZT+H-ZT+H. However, ZT+IWM-ZTR+IWM and ZT+HW-ZTR+HW both produced the greatest IVI value for Daucus carota, respectively. The values in the table represent the combined effects of tillage and weed control measures. *CT, conventional tillage; ZT, zero tillage; ZTR, zero tillage combined with residue; Integrated weed management, hand weeding, and approved pesticides all begin with the letter H. tillage and weed control treatments are combined to form treatments; CT+H-ZT+H, conventional tillage combined with advised herbicides in corn and wheat; CT+IWM-CT+IWM, conventional tillage combined with integrated weed management in corn and wheat; CT+HW-CT+HW, conventional tillage combined with hand weeding in corn and wheat; CT+HW-CT+HW, conventional tillage combined with hand weeding in corn and wheat; and CT+H-IWM-CT+IWM, conventional Zero tillage in maize and wheat combined with recommended herbicides; conventional tillage in maize followed by zero tillage in wheat; integrated weed management in maize and wheat; conventional tillage in maize followed by zero tillage in wheat; hand weeding in maize and wheat; and ZT+H-ZT+H, zero tillage in maize and wheat combined with recommended Zero tillage in maize and wheat combined with hand weeding in maize and wheat; ZT+H-ZTR+H, zero tillage in maize followed by zero tillage+residue retention in wheat in combination with recommended herbicides in maize and wheat; ZT+IWM-ZTR+IWM, zero tillage in maize followed by zero tillage + residue retention in wheat in combination with recommended herbicides in maize and wheat; and ZT+HW-Z.
Weed species
Treatments
Lolium temulentum
Avena ludoviciana
Phalaris minor
Coronopus didymus
Daucus carota
Poa anuua
Vicia sativa
CT+H-CT+H
31.20
165.85
21.80
27.75
9.65
34.50
9.30
CT+IWM-CT+IWM
61.25
72.90
50.25
11.70
48.20
30.80
24.90
CT+HW-CT+HW
67.85
70.30
41.35
26.95
17.90
56.25
19.45
CT+H-ZT+H
63.00
64.15
54.60
2.70
28.25
64.40
22.95
CT+IWM-ZT+IWM
66.75
61.35
11.35
8.70
50.65
70.75
30.50
CT+HW-ZT+HW
47.00
90.50
37.95
31.05
42.25
46.45
4.75
ZT+H-ZT+H
72.60
96.40
51.25
6.70
8.45
38.35
26.30
ZT+IWM-ZT+IWM
47.90
55.10
35.15
12.90
34.90
77.35
36.80
ZT+HW-ZT+HW
36.75
45.55
46.25
12.60
43.45
85.25
30.15
ZT+H-ZTR+H
39.45
51.35
29.20
7.80
49.90
106.65
15.75
ZT+IWM-ZTR+IWM
33.90
62.15
22.35
13.85
88.65
53.35
25.75
ZT+HW-ZTR+HW
37.85
86.70
42.95
18.30
53.60
51.30
9.40
ZTR+H-ZTR+H
37.55
101.80
36.75
25.15
46.15
36.20
16.40
ZTR+IWM-ZTR+IWM
47.95
76.35
46.75
12.30
35.30
50.70
30.60
ZTR+HW-ZTR+HW
24.30
54.40
41.60
16.40
51.30
75.90
36.15
Overall
47.69
76.99
37.97
15.66
40.57
58.55
22.61
3.4 Weed diversity indices
Thus, H' is more influenced by the existence of 'scare' species (Concenço et al., 2013). Higher values of the Shannon Wiener index (H') reflect a larger diversity of species in an area. ZTR+H-ZTR+H recorded the highest pooled species richness (D) in the summer maize crop (2.07) and was followed by ZTR+IWM-ZTR+IWM (1.87). Shannon Wiener index and Shannon’s equitability/ Evenness (EH) were higher for CT+HW-CT+HW followed by CT+H-CT+H. However, lower values of these indexes were associated with ZTR+H-ZTR+H (Table 6). The distribution of the occurrence of spontaneous species in a population is primarily related to a higher value of the diversity coefficient. According to Correia and Durigan (2004), increased weed infestation is not a direct result of more diversity. The study found that CT+HW-CT+HW had the lowest level of Simpson's index (0.17); however, ZTR+H-ZTR+H and ZT+HW-ZT+HW had lower Simpson's diversity indices. In context to these diversity indexes, Simpson’s reciprocal index was lowest in ZT+HW-ZT+HW. The values in the table represent the combined effects of tillage and weed control measures. *CT, conventional tillage; ZT, zero tillage; ZTR, zero tillage combined with residue; IWM is for integrated weed management. H stands for recommended herbicides. hand weeding; Richness of species; H': Shannon Wiener index EH: Equitableness (Shannon's equivalence); The Simpsons index, D. the use of approved herbicides in conjunction with conventional tillage in wheat and maize, or CT+H-CT+H; combining conventional tillage with integrated weed management in wheat and maize (CT+IWM-CT+IWM); Hand weeding in conjunction with conventional tillage in wheat and maize, or CT+HW-CT+HW; CT+H-ZT+H, Zero tillage in maize and wheat combined with recommended herbicides; conventional tillage in maize followed by zero tillage in wheat; integrated weed management in maize and wheat; conventional tillage in maize followed by zero tillage in wheat; hand weeding in maize and wheat; and ZT+H-ZT+H, zero tillage in maize and wheat combined with recommended Zero tillage in maize followed by zero tillage+residue retention in wheat in combination with suggested herbicides for use in maize and wheat; ZT+IWM-ZTR+IWM, Zero tillage in maize followed by zero tillage+residue retention in wheat in combination with suggested herbicides for use in maize and wheat; ZT+HW-ZTR+HW, Zero tillage in maize followed by zero tillage + residue retention in wheat in combination with suggested hand.
Maize
Wheat
Treatments
Sr
H'
EH
D
Simpson’s index of diversity
Simpson’s reciprocal index
Sr
H'
EH
D
Simpson’s index of diversity
Simpson’s reciprocal index
CT+H-CT+H
1.44
1.78
0.88
0.18
0.82
5.41
1.78
0.92
0.47
0.55
0.45
1.81
CT+IWM-CT+IWM
1.60
1.67
0.83
0.20
0.80
4.89
1.06
1.38
0.71
0.19
0.81
5.36
CT+HW-CT+HW
1.37
1.83
0.91
0.17
0.83
6.03
1.11
1.19
0.61
0.18
0.82
5.58
CT+H-ZT+H
1.48
1.70
0.85
0.18
0.82
5.71
1.79
1.33
0.68
0.19
0.81
5.19
CT+IWM-ZT+IWM
1.81
1.63
0.81
0.22
0.78
4.50
1.10
1.30
0.67
0.24
0.76
4.23
CT+HW-ZT+HW
1.75
1.57
0.78
0.20
0.80
5.14
1.23
1.14
0.59
0.21
0.79
4.87
ZT+H-ZT+H
1.62
1.66
0.82
0.18
0.82
5.71
1.75
1.06
0.52
0.33
0.67
3.06
ZT+IWM-ZT+IWM
1.62
1.66
0.83
0.19
0.81
5.33
1.17
1.34
0.69
0.20
0.80
5.09
ZT+HW-ZT+HW
1.47
1.64
0.81
0.24
0.76
4.45
0.95
1.08
0.56
0.23
0.77
4.28
ZT+H-ZTR+H
1.55
1.67
0.83
0.21
0.79
4.85
1.12
1.28
0.66
0.22
0.78
4.45
ZT+IWM-ZTR+IWM
1.71
1.66
0.83
0.21
0.79
4.87
1.09
4.73
0.45
0.45
0.55
2.24
ZT+HW-ZTR+HW
1.36
1.73
0.86
0.18
0.82
5.56
1.08
1.21
0.62
0.21
0.79
4.67
ZTR+H-ZTR+H
2.07
1.34
0.66
0.24
0.76
4.92
1.26
1.13
0.58
0.25
0.75
4.09
ZTR+IWM-ZTR+IWM
1.87
1.52
0.76
0.20
0.80
4.98
0.99
1.30
0.67
0.19
0.81
5.29
ZTR+HW-ZTR+HW
1.58
1.73
0.86
0.19
0.81
5.37
1.10
1.18
0.61
0.21
0.79
4.80
In winter wheat crop, CT+H-ZR+H had higher species richness followed by CT+H-CT+H. Values of Shannon Wiener index (H') ranged from 4.73 for ZT+IWM-ZTR+IWM to 0.92 for CT+H-CT+H. After ZT+IWM-ZTR+IWM, CT+IWM-CT+IWM showed the highest evenness/equitability. Shannon's Lowest values of Simpson’s index were observed in CT+H-ZT+H and ZTR+IWM-ZTR+IWM. However, a low Simpson’s diversity index was recorded for CT+H-CT+H. Simpson’s reciprocal index value ranged from 5.58 for CT+HW-CT+HW to 1.81 for CT+H-CT+H.
4 Discussion
Among all the weeds, the frequency of grassy and broadleaved weeds was more than sedges during summer season, whereas, more number of grassy weeds were observed during winter season compared to broadleaved weeds. Among different tillage and weed management treatments, likewise, broadleaved weeds and grassy weeds contributed around 48% and 41% of the total weed flora, respectively, in the summer season. Similarly, in winter season, broadleaved and grassy weed contributed about 41% and 59% proportion of weeds in various treatments. Armengot et al. (2016) reported that the total weed population was highest in reduced tillage, although it was not consistent for different crops. From the results of this study, Conservation agriculture (ZTR-ZTR) with zero tillage, crop rotation and soil covering with residue showed the potential to reduce the weed density during summer season compared to intensive tillage (CT-CT) (Table 2). Jat et al. (2021) also confirmed that CA comprising of crop diversification, zero ZT and crop residue incorporation/retention influence the diverse weed population compared to CT. Crop residue application might be a persuasive reason for the reduction in weed density due to physical barrier for emerging seeds which restrict the growth of germinating weed seeds by limiting absorbed direct light availability (Malik et al., 2018). Weed germination and growth were lower in ZT in combination with residue management than in ZT without residue incorporation (Fonteyne et al., 2020) which might be due to high soil fertility and soil water content (Verhulst et al., 2011), lead to better crop growth which enhance the crop ability to compete with weeds. However, ZT without residue incorporation resulted in poor soil fertility and infiltration (Verhulst et al., 2011) which provide unfavorable environment for weeds to emerge and grow. Our results are confirmed by Dash et al. (2020) who stated that IWM practices are more compatible and viable to control diverse weed flora in conservation agriculture production system. IWM treatment inclusion of crop rotation breach life cycle of weeds and reduce their persistence (Rao, 2000); hand weeding reduces the enrichment of weed seed bank which counteract diverse weed flora (Baghel et al., 2020); application of herbicides facilitates the reduction of weed population.
In wheat crop, among all weeds, annual broad-leave weeds were identified as the most populated species because of their high ability to proliferate. Many researchers found that tillage manipulation and modern agricultural practices in different cropping systems had a strong influence on weed occurrence and infestation (Kadziene et al., 2020).In contrast to ZT, in some studies, CT had higher weed densities (Shrestha et al., 2002), though in some cases, perennial species increased with ZT compared to CT during winter season (Torresen et al., 2003). Higher weed density in ZTR-ZTR was due to the higher presence of perennial weed Daucus carota, while annual weed species remained associated with a range of tillage application. Among weed management treatments, the application of recommend herbicide (H-H) gave better weed control results than HW-HW and IWM-IWM in wheat crop (Table 3). Application of recommended herbicides followed by hand weeding reduce diverse weed flora in wheat crop (Zahan et al., 2020). The findings of this research demonstrated that the application of recommended herbicides (H-H) in wheat crop had better weed control which are also confirmed by many researchers that the sole application of herbicide is not ample to control diverse weed flora (Zahan et al., 2020).
The most significant weeds in the maize crop at the North Western Indian Himalaya were Echinochloa colona, Commelina benghalensis, and Ageratum conyzoides, according to a phyto-sociological study (Table 4). Rana et al. (2019) also reported that Ageratum conyzoides, Echinochloa colona, and Echinochloa colona were the most important weeds in the maize field during studies in 2008 and 2018 in the North Western Indian Himalaya. Nonetheless, Avena fatua was also listed by Pala and Mennan (2018) as having a high importance value index in wheat crops.
The diversity and richness of the species varied depending on the extent of under-tillage operations and residue integration. In a conventional tillage system, a higher Shannon's index and evenness in the CT+HW-CT+HW system suggest a higher level of weed abundance (Table 6). Comparing conventionally tilled plots to conservation agricultural systems, Shannon's index was higher in traditional tilled plots (Carter and Ivany, 2006). However, contradictory report on Shannon’s index indices was reported by Pratibha et al. (2021) that ZT recorded a highest Shannon index over CT. Highly disturbed habitat resulted in a low Shannon index (Armengot et al., 2016). Simpson's index was greater in the maize crop CT+IWM-ZT+IWM and the wheat crop CT+H-CT+H. Wilsey and Stirling, (2007) reported that the degree of evenness in the plant communities was influenced by competitive interactions between the plant species. Species richness was higher in ZTR+H-ZTR+H and CT+H-CT+H for maize and wheat crops, respectively (Table 6). Higher species richness in ZTR-ZTR reveals higher germination opportunities in conservational production system. Armengot et al. (2016) also reported that higher species richness was recorded in ZT system compared to conventional production system (CT). Nevertheless, CT+HW-CT+HW in the maize and wheat crops had higher Simpson's reciprocity and diversity indices.
5 Conclusion
In this production system, weed control is a significant difficulty even though CA maintains higher system sustainability and little environmental impacts. In contrast to the wheat crop, where ZTR-ZTR produced the highest proportion of weeds, conservation agriculture (ZTR-ZTR) paired with IWM-IWM resulted in decreased weed population, TWD, and species richness and evenness. On the other hand, greater species richness and diversity were seen in the CT+H-ZR+H wheat crop as a result of the perennial weed Daucus carota's high favorability in zero-till plots (ZT) and conservation practices (ZTR), whereas annual weed species continue to be connected to a variety of tillage operations. However, in some cases, zero tillage without residue incorporation led to less diverse weed diversity compared to intensive conventional tillage (CT-CT). In CT+H-CT+H, higher Shannon Wiener and Simpson diversity indices as well as evenness were observed. Despite the fact that different tillage methods and weed control strategies had an effect on weed composition, phytosociology, and diversity, a consistent correlation between weed species population and tillage and weed control methods was not seen. This implies that weed density and diversity may be influenced by environmental and management factors in addition to tillage, residues, and weed management strategies. Further, long-term experiments are mandatory to understand the complicated relationships among weed species under tillage and weed management strategies for sustainable and adoptive CA for North Western Himalaya.
CRediT authorship contribution statement
Sachin Kumar: Conceptualization, Data curation, Formal analysis, Investigation, Methodology, Writing – original draft; Surinder Singh Rana: Conceptualization, Data curation, Formal analysis, Investigation, Methodology, Project administration, Software, Supervision, Validation, Visualization; Neelam Sharma: Conceptualization, Data curation, Formal analysis, Investigation, Methodology, Project administration, Software, Supervision, Validation, Visualization; Rana Khalid Iqbal: Funding acquisition; Huma Qureshi: Writing – review & editing; Tauseef Anwar: Funding acquisition, Writing – original draft; Asad Syed: Funding acquisition; Abdallah M. Elgorban: Funding acquisition; Rajalakshmanan Eswaramoorthy: Resources.
Funding
Also supported and funded by the All India Coordinated Research Project on Weed Management, India. The Head of the Department of Agronomy at CSK HPKV in Palampur, India, is gratefully acknowledged by the authors for conducting the field experiment.
Acknowledgements
The King Saud University in Riyadh, Saudi Arabia, and its researchers who supported Project number (RSP2023R367) are both thanked by the authors.
Declaration of Competing Interest
The authors declare that they have no known competing financial interests or personal relationships that could have appeared to influence the work reported in this paper.
References
- Tillage as a driver of change in weed communities: a functional perspective. Agric. Ecosyst. Environ.. 2016;222:276-285.
- [CrossRef] [Google Scholar]
- Impacts of conservation agriculture and herbicides on weeds, nematodes, herbicide residue and productivity in direct-seeded rice. Soil Tillage Res.. 2020;201:104634
- [CrossRef] [Google Scholar]
- Weed seed bank composition under three long-term tillage regimes on a fine sandy loam in Atlantic Canada. Soil Tillage Res.. 2006;90(1–2):29-38.
- [CrossRef] [Google Scholar]
- Role of integrated weed management strategies in sustaining conservation agriculture systems. Current Sci.. 2012;103:135-136.
- [Google Scholar]
- Ecology and management of weeds under conservation agriculture: a review. Crop Prot.. 2012;38:57-65.
- [CrossRef] [Google Scholar]
- Phytosociological surveys: tools for weed science? Planta Daninha. 2013;31:469-482.
- [CrossRef] [Google Scholar]
- Phytosociological surveys in weed Science: old concept. New Approach 2017
- [CrossRef] [Google Scholar]
- Emergência de Plantas daninhas em Solo Coberto com Palha de Cana-de-açúcar. Planta Daninha. 2004;22:11-17.
- [CrossRef] [Google Scholar]
- Integrated weed management in conservation agriculture-A Review. Int. J. Curr. Microbiol. Appl. Sci.. 2020;9(8):2319-7706.
- [CrossRef] [Google Scholar]
- Proving allelopathy in crop–weed interactions. Weed Sci.. 2015;63:121-132.
- [CrossRef] [Google Scholar]
- Rotation, mulch and zero tillage reduce weeds in a long-term conservation agriculture trial. Agronomy. 2020;10:962.
- [Google Scholar]
- Statistical Procedure for Agricultural Research (2nd edn.). New York, USA: Wiley Inter Science; 1984. p. :680.
- Responses of weed community, soil nutrients, and microbes to different weed management practices in a fallow field in Northern China. PeerJ. 2019;7:e7650.
- [Google Scholar]
- The environmental consequences of adopting conservation tillage in Europe: Reviewing the evidence. Agric. Ecosyst. Environ.. 2004;103:1-25.
- [CrossRef] [Google Scholar]
- Climate-smart agriculture practices influence weed density and diversity in cereal-based agri-food systems of western Indo-Gangetic plains. Sci. Rep.. 2021;11:15901.
- [CrossRef] [Google Scholar]
- Tillage and cover crop influence on weed pressure and Fusarium infection in spring cereals. Crop Prot 2020
- [CrossRef] [Google Scholar]
- New directions for integrated weed management: Modern technologies, tools and knowledge discovery. In: Advances in Agronomy. Vol vol. 155. Amsterdam: Elsevier; 2019. p. :243-319.
- [Google Scholar]
- The role of ground beetles (coleoptera: Carabidae) in weed seed consumption: a review. Weed Sci.. 2017;63:355-376.
- [CrossRef] [Google Scholar]
- Weed management in maize based cropping system. Indian J. Weed Sci.. 2015;47(3):254-266.
- [Google Scholar]
- Bio-efficacy of metsulfuron-methyl and 2, 4-D combinations for broad-leaf weed control in wheat. Indian J. Weed Sci.. 2000;32(1&2):67-69.
- [Google Scholar]
- Weed management in conservation crop production systems. Weed Biol. Manag.. 2002;2(3):123-132.
- [CrossRef] [Google Scholar]
- Conservation agriculture-based resource-conserving practices and weed management in the rice-wheat cropping systems of the Indo-Gangetic Plains. Indian J. Weed Sci.. 2018;50:218.
- [CrossRef] [Google Scholar]
- Weed flora composition of different barley-based cropping systems under conventional and conservation tillage practices. Phytoparasitica 2021
- [CrossRef] [Google Scholar]
- Pala, F., Mennan, H., 2018. Major weeds in barley fields of Diyarbakir. In: 70th International Symposium on Crop Protection, May 20, Ghent, Belgium.
- Occasional tillage in no-tillage systems: a global meta-analysis. Total Env. Sci. 2020
- [CrossRef] [Google Scholar]
- Cultivation and on the row herbicide application-a chain of the intergrated weed management. In: Garcia-Torres J.B., Martinez-Vilela A., eds. Conservation Agriculture, A World Challenge. Cordoba: XUL; 2001.
- [Google Scholar]
- Weed shift and community diversity in conservation and conventional agriculture systems in pigeonpea- castor systems under rainfed semi-arid tropics. Soil Tillage Res.. 2021;212:105075
- [CrossRef] [Google Scholar]
- Influence of a cereal rye cover crop and conservation tillage on the critical period for weed control in cotton. Weed Technol.. 2018;32:683-690.
- [CrossRef] [Google Scholar]
- Studies on shifts in weed flora in maize (Zea mays L.) in Kangra district of Himachal Pradesh. J. Res. Weed Sci.. 2019;2:230-240.
- [CrossRef] [Google Scholar]
- Principles of Weed Science (second ed.). USA: Science Publishers Inc.; 2000.
- The Mathematical Theory of Communication. Urbana, IL, USA: University of Illinois Press; 1949. p. :3-24.
- Effect of tillage, cover crop and crop rotation on the composition of weed flora in a sandy soil. Weed Res.. 2002;42:76-87.
- [CrossRef] [Google Scholar]
- Potential yield loss in sugar beet due to weed interference in the United States and Canada. Weed Technol.. 2018;32:749-753.
- [CrossRef] [Google Scholar]
- Long-term experiments with reduced tillage in spring cereals. I. Effects on weed flora, weed seedbank and grain yield. Crop Protect.. 2003;22:185-200.
- [CrossRef] [Google Scholar]
- Soil water content, maize yield and its stability as affected by tillage and crop residue management in rainfed semi-arid highlands. Plant Soil. 2011;344:73-85.
- [CrossRef] [Google Scholar]
- Does diversifying crop rotations suppress weeds? A meta-analysis. PLoS ONE 2019
- [CrossRef] [Google Scholar]
- Species richness and evenness respond in a different manner to propagule density in developing prairie microcosm communities. Plant Ecol.. 2007;190(2):259-273.
- [Google Scholar]
- Suppression of weeds and weed seeds in the soil by stubbles and no-tillage in an arid maize-winter wheat-common vetch rotation on the Loess Plateau of China. J. Arid Land. 2018;10:809-820.
- [CrossRef] [Google Scholar]
- Performance of pyrazosulfuron-ethyl in un-puddled transplanted rainy season rice and its residual effect on growth of the succeeding crop in rice-wheat cropping pattern. Int. J. Pest. Manag.. 2020;66:122-130.
- [CrossRef] [Google Scholar]
- Impact of tillage and crop residue management on the weed community and wheat yield in a wheat–maize double cropping system. Agriculture. 2021;11:265.
- [CrossRef] [Google Scholar]


