Translate this page into:
Water quality assessment in dry regions using statistical methods
⁎Corresponding authors at: Department of Geology, Faculty of Science, Assiut University, Assiut 71516, Egypt (A. Mohamed); Department of Civil, Environmental and Natural Resources Engineering, Lulea University of Technology, 97187 Lulea, Sweden (N. Al-Ansari). ahmedmohamed@aun.edu.eg (Ahmed Mohamed), nadhir.alansari@ltu.se (Nadhir Al-Ansari),
-
Received: ,
Accepted: ,
This article was originally published by Elsevier and was migrated to Scientific Scholar after the change of Publisher.
Peer review under responsibility of King Saud University.
Abstract
Water demands have increased even more in recent decades because of the high population density. Surface and groundwater resources are insufficient to meet these demands. As a result, governments have turned to the treatment of sewage water. Sewage water contains multiple types of contamination, creating a major health risk. In the research region, 48 water samples were obtained, including 18 samples of surface water and 30 samples of groundwater. The Canadian Council Water Quality Index (CCWQI) program calculates the water quality index to evaluate the water quality for drinking and human use. The World Health Organization (WHO) and the Egyptian Ministry of Health (EMH) determined regulatory limits for drinking water and each value of the investigated parameter connected with them. According to the findings, 79% of the tested water samples are safe to drink and are excellent for human and wildlife use. Due to infiltration or recharging of groundwater with drainage water, as well as the involvement of dissolution, leaching processes, and anthropogenic activities that damage human health, animals, and some plants, these samples are unfit for drinking and domestic consumption. The heavy metal level of Cd and Pb in the examined water samples was found to be above WHO and EMH acceptable limits. Furthermore, due to oral exposures, the examined water samples may cause complex health concerns such as non-carcinogenic and carcinogenic influences for children over adults due to a reduction in children's immunity. As a result, water treatment should be carried out in the examined region to protect the health of the residents.
Keywords
Drinking Water
Water Quality Index
Ingestion
Chronic Daily Intake
Surface and Groundwater
1 Introduction
Water needs have increased more than ever in recent decades as a result of population growth. For these demands, surface water and groundwater supplies become insufficient. As a result, governments have resorted to sewage water treatment. Sewage water contains a variety of toxins that pose serious health hazards (Sabet et al., 2017; El-Gohary et al., 2017). The quality of the water is a critical criterion for determining whether or not it can be reused. Season, geographic location, human activity, weather, and the existence of water sources like domestic and industrial wastes that can easily flow of water resources all affect the quality of the water (Asmoay, 2017; Mohamed et al., 2022; Mohamed et al., 2023). Inorganic pollutants produced from geogenic or anthropogenic action are known as heavy metals (Salman et al., 2019). The weathering of rocks produces geogenic sources, whereas mining and human activities produce anthropogenic sources (Mohammadi et al., 2020; Hu et al., 2020). Agricultural drainage, industrial waste, fertilizers, pesticides, wastewater, and sewage sludge are all examples of human activities (Mohammadi et al., 2020; Hu et al., 2020). These operations provide water, but heavy metals pollute the water, making it unfit for consumption and necessitating treatment procedures (Mohammadi et al., 2020; Muhammad et al., 2011; Fakhri et al., 2018). Heavy metals include Cd, Pb, Fe, Mn, Cu, Co, Ni, Zn, As, and other metals found in contaminated water (Said, 1990; Ibrahim et al., 2019; Haseen et al., 2005). High quantities of those heavy metals in drinking water, above the world's legal limits, can cause a variety of ailments and chronic health problems (Mohammadi et al., 2020; Muhammad et al., 2011; Fakhri et al., 2018; Hoang et al., 2020). Cd is a hazardous metal that is released through Cd-Ni batteries, metal plating, phosphate fertilizers, pigments, mining, paint, and alloy industries, as well as from sewage sludge (Salman et al., 2019; ATSDR, 1997). Cd is a very poisonous and carcinogenic metal, and long-term exposure can cause cancer, renal failure, bone lesions, skeletal damage, pulmonary insufficiency, and hypertension (Salman et al., 2019; ATSDR, 1997).
Many industries use lead, including battery production, lead smelting and processing, pigments, cable sheathing, solder, ammunition, plastics, fuels, and ceramics (Salman et al., 2019; USEPA, 2011). It is also replenished in water resources by urban runoff, automotive exhaust, and sewage sludge (Salman et al., 2019; USEPA, 2011). Pb is a very hazardous and carcinogenic element that can cause chronic ailments such as headaches, nerve damage, irritability, blood pressure, stomach cancer, kidney damage, lung cancer, gliomas and abdominal pain (Salman et al., 2019; ATSDR, 1997; USEPA, 2011). Anemia; behavioral abnormalities, memory impairment, and a reduced capacity to understand can all result from prolonged exposure to Pb-contaminated drinking water (Salman et al., 2019; ATSDR, 1997; USEPA, 2011). It is also dangerous and can destroy organs like the neurological system, heart, and bones (Salman et al., 2019; ATSDR, 1997; USEPA, 2011).
Because both Cd and Pb cause cancer in humans, the human health risk assessment model is highly effective in interpreting this risk (Zakir et al., 2020; Mthembu et al., 2021). The potential hazard of non-carcinogenic and carcinogenic effects for specific metals can be evaluated using statistical metrics of health risk from contaminated water resources (Zakir et al., 2020; Mthembu et al., 2021). Many researchers conducted studies on the health risk assessment of water (Mohammadi et al., 2020; Muhammad et al., 2011; Fakhri et al., 2018; Zakir et al., 2020; Mthembu et al., 2021).
The major goal of this research is to find out how hazardous metals are in drinking water and household products in the study region. In addition, the concentration levels of the concerned metals were compared to standard world norms such as WHO guidelines, as well as to other places in Egypt and around the world. It also attempts to identify and assess carcinogenic and noncarcinogenic risks for adults and children in the research area. Finally, decision-makers regarding the metal toxicity of water resources can be identified in the study region by taking into account all prior estimates.
2 Material and methods
2.1 Location
The study region includes the Nile Valley's core region, as well as the northern Assuit district. It lies between the latitudes of 27° 10ʹ and 27° 40ʹ N and the longitudes of 30° 40ʹ and 31° 20ʹ E. It is characterized geomorphologically by a low area bordered on the east and west by high calcareous plateaus. The older alluvial and the younger alluvial plains are found in the morphological units (Said, 1981). (Figs. 1, 2). The geologic succession includes Eocene rocks, Pliocene deposits, and Quaternary material from bottom to top (Fig. 2), (Said, 1990). Surface water in the research region represents the Nile River, canals, and drains. Groundwater aquifers, which are formed of sandy clays with gravels, cobbles, and calcareous rock pieces from the middle Pleistocene, constitute the second water resource in the examined area (Prenile). Groundwater recharges primarily from surface water and rains and flows toward the west of the research region (Sadek, 2001; Ibrahim et al., 2019).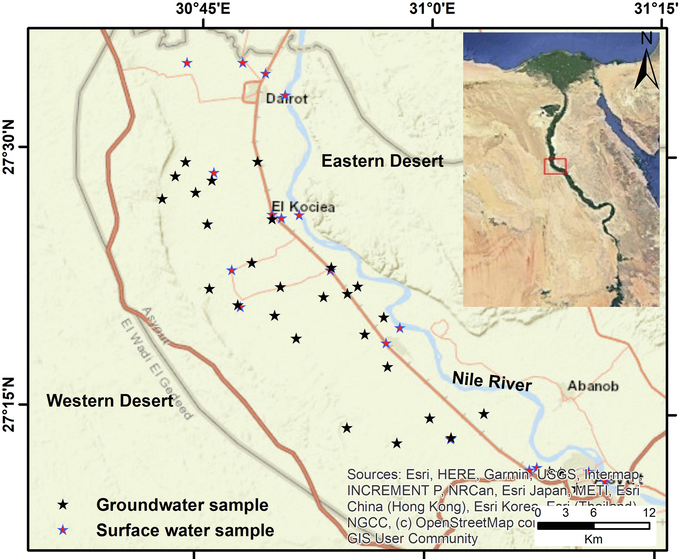
Map of the study area's location.
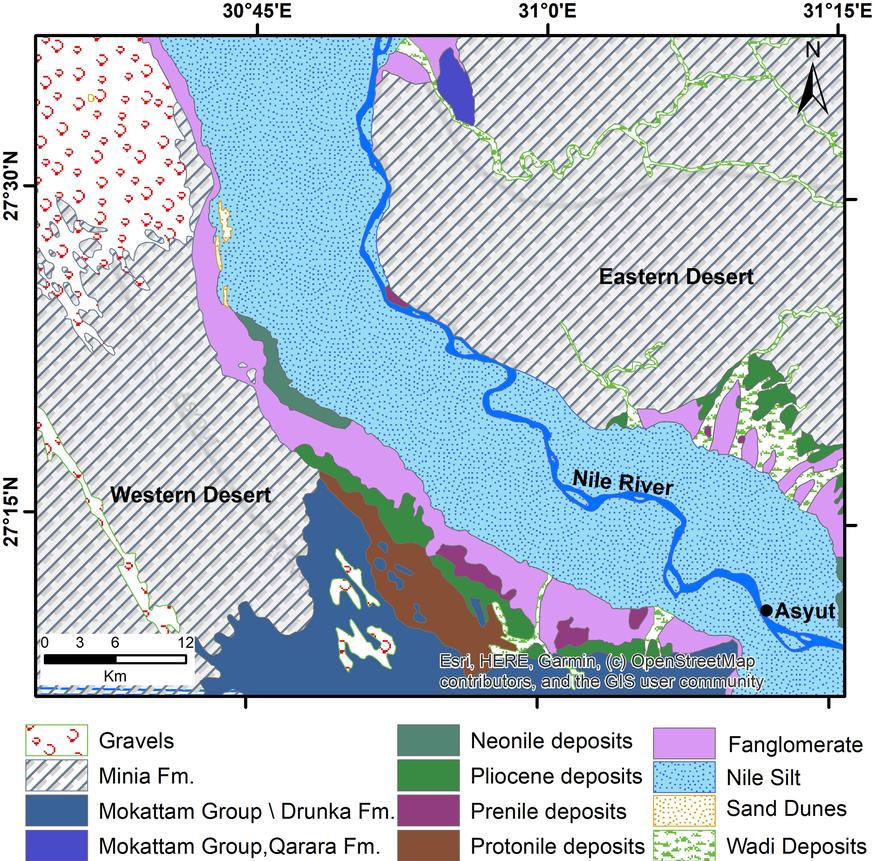
Map showing the study area's geology (After Conoco, 1987).
2.2 Sampling and laboratory methods
A total of 48 water samples were taken from the study area's water resources in April 2020. There are 18 surface water samples and 30 samples of groundwater aquifers among the water samples (Fig. 1). The materials were filtered, and their chemical components (APHA, 2012) were examined using conventional procedures. Total dissolved solids (TDS), electric conductivity (EC), and pH were all in-situ measurements using the pH-meter, while the Flame-Photometer was used to detect Na + and K+ concentrations. In Assuit University laboratories, the contents of Ca2+, Mg2+, CO32–, HCO3–, SO42-, and Cl- were also determined by titration. An atomic absorption spectrometer was used in the Assuit University Laboratories to measure the content of heavy metals in water samples (model: Perkin Elmer 400).
2.3 Water quality Index (WQI)
The Canadian Council Water Quality Index (CCWQI) was used to assess the quality of water for drinking and human use (CCME, 2001; Haseen et al., 2005). which was computed using the equation No.1 below.
Where, F1 is the percentage of variation that fails to meet its targets at least once during the consideration period (failed variables), as a percentage of the total number of determined variables (Eq. No.2). As provided in Eq. No. 3, F2 is the frequency in which the percentage of individual tests that do not continue objects (failed test) acts. F3 is the amplitude that displays the value of a failed test value that hasn't met its objectives. F3 is calculated in three stages. When the test value must not be greater than the objects:
F3 is determined in three steps. When the test value shouldn't pass the target as the following:
A- An “excursion” is the number of times a particular amount deviates from the objective by more than (or by less than, if the target is a minimum) the specified number of times and calculated using Eq. (4).
B- The probability value that an individual test is out of compliance is computed by adding all of the individual tests' deviations from their targets and dividing by the total number of tests (both those executing objects and those not performing objects). This variable represents the normalized sum of excursions (NSE), which is calculated using Eq. (5).
C- An asymptotic function that adjusts the normalised sum of the excursions from objects (NSE) to display a range between 0 and 100 is then used to detect F3 (Eq. No. 6).
The obtained values are normalised by the divisor 1.732 to lie within the interval 0–100, where 0 denotes the “worst” water quality and 100 the “highest” water quality (Haseen et al., 2005).
WQI values are divided into five categories, bad quality (WQI is roughly 0–45), marginal quality (45–65), fair quality (65–80), good quality (80–95), and excellent quality (95–100), (Haseen et al., 2005).
2.4 Health risk assessment
Analyzing the health concerns linked to oral exposure to water pollutants involves a variety of approaches. The hazard quotients for non-carcinogenic effects (HQN-c) and carcinogenic effects (HQc) for each chemical species, the hazard index (HI) for non-carcinogenic effects in numerous pathways, and the target cancer risk (TCR) for multiple pathways are all examples of these ideas. The following equations were used to calculate all of the previously mentioned terms (USEPA, 1992; Chrowtoski, 1994; Kavcar et al., 2009):
CDIOral = C × IR /BW
HQN-C = CDIOral / RfD
HQC = CDIOral × CSF
HI = Σ HQ N-C for each chemical species
TCR = Σ HQ C for each chemical species
C is the metal concentration in water (mg/L); IR is the daily intake rate for adults at 2 L/day and 1 L/day for children; and BW is the estimated body weight for adults at 73 kg and children at 32.7 kg. Oral Pb and Cd reference doses are 0.0004 and 0.0005 mg/kg/day, respectively (USEPA, 1992). Similarly, the cancer slope factors (CSF) for Pb and Cd are 8.5 and 6.1, respectively (USEPA, 1992; Chrowtoski, 1994; Kavcar et al., 2009).
3 Results and discussion
3.1 pH, major Ions, Pb, and Cd concentrations
Surface water resources, which include the Nile River, drains, and canals, are an urgent supply of water in the examined region. Surface water accounts for 90% of the water resources on the area's eastern side. As a result, surface water contamination caused by amount of metals has an impact on people's health (Said, 1981). The second source of water, particularly in the western section of the region, is groundwater. The locals rely on groundwater for their water source (Sabet et al., 2017; El-Gohary et al., 2017; Asmoay, 2017; Salman et al., 2019).
The concentrations of pH, EC, TDS, Ca2+, and Mg2+ are within WHO (WHO, 2022) and EMH (EMH, 2007) drinking water standard limits (2007; 8.5, 1500 ppm, 1000 ppm, 200 ppm, and 150 ppm, respectively; Table 1 and Fig. 3). Total hardness readings (TH) in 20 percent of groundwater tests exceed the standard limits for drinking water (500 ppm) to be termed very hard water (Table 1 and Fig. 3), (Boyd, 2000). This is due to carbonate mineral dissolution, as well as an excess of calcium and magnesium in groundwater tests (Sabet et al., 2017; El-Gohary et al., 2017; Hem, 1992). In 6% of the groundwater samples, Na+ values surpass the allowed threshold for drinking water (250 ppm) (Table 1 and Fig. 3). Recharging the groundwater with drainage water from drains or sewage stations, or possibly weathering of feldspar, results in high sodium content (Wenk and Bulakh, 2004; Sabet et al., 2017; El-Gohary et al., 2017; Asmoay, 2017). Due to mixing it with wastewater containing fertilizers, K+ content exceeds the EMH (12 ppm) allowed limit for drinking water in 25% of the investigated water samples (Table 1 and Fig. 3). (Sabet et al., 2017; El-Gohary et al., 2017; Ahmed and Ali, 2011). In 3% of the groundwater samples, Cl- levels exceed the allowed threshold for drinking water (250 ppm) (Table 1 and Fig. 3). This is due to the use of wastewater for irrigation, which leaked into the groundwater, or the dissolution of the halite mineral, which originated in the aquifer under marine circumstances (Sabet et al., 2017; El-Gohary et al., 2017; Asmoay, 2017; Gibbs, 1970; Mashburn and Sughru, 2004). In 15% of the groundwater samples (Table 1 and Fig. 3), the SO42- level was above the standard limits for drinking water (250 ppm). This resulted in agricultural drainage water infiltration, which is contaminated with fertilizers and insecticides. In addition to dissolving salts from the soil or dissolving salts from the water (Mashburn and Sughru, 2004; El-Minshawy and Kamel, 2006; Sabet et al., 2017; El-Gohary et al., 2017; Asmoay, 2017).
Element
Surface water
Groundwater
(WHO, 2022)
(EMH, 2007)
Min.
Max.
Aver.
Min.
Max.
Aver.
pH
6.4
7.5
7.1
6.4
7.0
6.7
6.5–8.5
6.5–8.5
EC (µs/cm)
264
1060
375
207
1452
713
1500
1500
TDS (ppm)
204
854
291
156
1069
548
1000
1000
T(oC)
23
26
24
23
33
26
–
–
TH (ppm)
120
400
181
120
1120
381
500
500
Ca2+ (ppm)
18
60
35
30
240
86
75
200
Mg2+ (ppm)
22
90
33
21
170
61
100
150
Na+ (ppm)
21
195
53
23
575
128
250
200
K+ (ppm)
7
74
16
5
23
11
12
–
CO32– (ppm)
0
0
0
0
0
0
–
–
HCO3– (ppm)
176
488
267
189
915
431
–
–
Cl- (ppm)
39
248
67
50
886
149
250
250
SO42- (ppm)
1
110
30
7
912
152
250
250
Cd (µg/L)
0
25
12
0
29
20
3
3
Pb (µg/L)
0
100
23
0
90
19
10
10

Values of the physicochemical parameters in the investigated water samples.
According to WHO (WHO, 2022) and EMH (EMH, 2007), Cd is a very hazardous metal and carcinogen that causes a variety of ailments in humans at high concentrations of more than 3 g/L in drinking water. In 13% of the water samples tested, the Cd concentration does not exceed the allowed threshold for drinking water (Table 1 and Fig. 3). According to Salman et al., it decreases the results of Cd content (ranging from 0 to 49 g/L) in water from Egypt's El-Minya Governorate (2019). Cd levels are high in most water samples analyzed, posing a significant risk to residents' health, including cancer, renal failure, skeletal damage, bone lesions, pulmonary insufficiency, and hypertension (Salman et al., 2019; Hoang et al., 2020; ATSDR, 1997; Bruce et al., 2012).
Pb is a highly hazardous metal that can cause cancer, especially at levels over the WHO and EMH permitted limit of 10 g/L for drinking water. Headaches, Irritability, gastrointestinal, discomfort, nerve damage, blood pressure, renal damage, stomach cancer, gliomas and lung cancer can all be caused by excessive amounts of Pb in water (Salman et al., 2019; Hoang et al., 2020; ATSDR, 1997; Bruce et al., 2012). In 36% of the water samples tested, Pb contents were higher above the allowed threshold (10 g/L) for drinking water (Table 1 and Fig. 3). It fluctuates between 54 and 410 g/L in water from Egypt's El-Minya Governorate, which resulted in a 4-fold increase in its amount in the water samples analyzed (Said, 1981). As a result, the heightened Pb concentrations in the water samples tested can have a negative influence on the health of inhabitants who live in high-risk areas (Salman et al., 2019; Hoang et al., 2020; ATSDR, 1997). Both Cd and Pb contents in water does not exceed the safe limit in water resources of Pakistan and China (USEPA, 2011; Dong et al., 2020).
3.2 WQI
WQI is a process that uses 12 parameters to convert water physicochemical characteristics into a simple expression that indicates water quality (CCME, 2001; Haseen et al., 2005; Sabet et al., 2017; El-Gohary et al., 2017; Asmoay, 2017). According to the WQI values, 17% of surface water samples are of outstanding quality, 39% are of high quality, 39% are of fair quality, and 5% are of marginal quality (Table 2 and Fig. 4). While WQI values in groundwater samples refer to 23% good quality, 47% fair quality, 20% marginal quality, and 10% poor quality, WQI values in surface water samples refer to 23% good quality, 47% fair quality, 20% marginal quality, and 10% poor quality (Table 2 and Fig. 4).
WQI Class
Surface water samples
Groundwater samples
Poor quality (0–45)
–
G6, G10 & G22
Marginal quality (45–65)
S14
G3, G25, G26, G28, G29 & G30
Fair quality (65–80)
S1, S2, S5, S9, S10, S17 & S18
G1, G4, G5, G7, G9, G11, G12, G14, G15, G18, G21, G23, G24 & G27
Good quality (80–95)
S3, S4, S6, S11, S12, S13 & S16
G2, G8, G13, G16, G17, G19 & G20
Excellent quality (95–100)
S7, S8 & S15
–
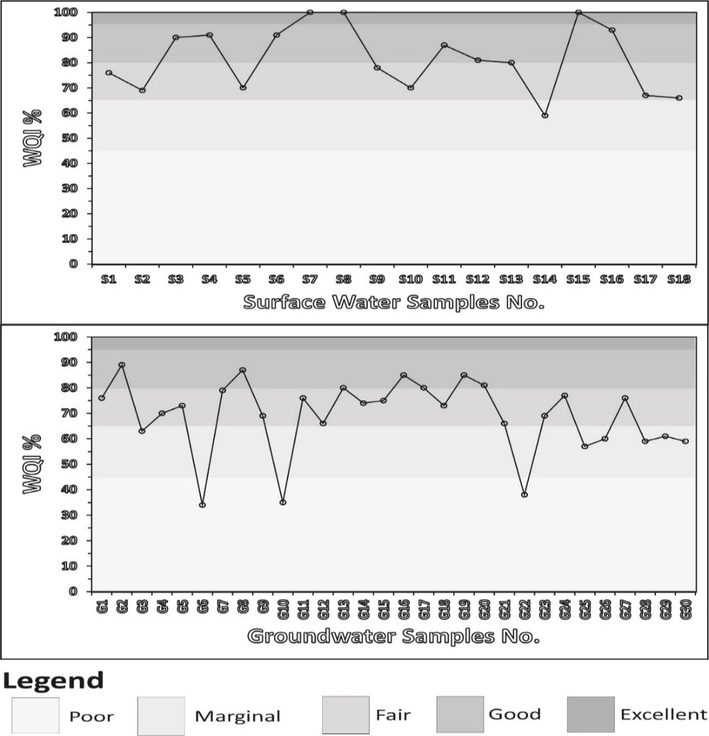
The values of water quality according to WQI for the studied water samples.
As a result, WQI values show that 95% of surface water samples and more than two-thirds of groundwater samples are of fair to good quality for human consumption, wildlife, and drinking. As a result, the lowest WQI values of the water samples studied point to the role of geogenic (dissolution and leaching processes) and anthropogenic activities in contaminating both surface water and groundwater resources with wastewater (CCME, 2001; Haseen et al., 2005; Gibbs, 1970; Sabet et al., 2017; El-Gohary et al., 2017; Asmoay, 2017).
3.3 Health risk assessment for the studied water samples
Water is essential for life, hence high-quality water for drinking and domestic usage is required. Treatment procedures such as flocculation and alum coagulation are used in water stations to remove hazardous metals linked with suspended contaminants (Salman et al., 2019; Fatoki and Ogunfowokan, 2002; Donia, 2007). In the researched area, desert and rural communities lack access to tap water, resulting in disease outbreaks in these locations (Salman et al., 2019). As a result, in the research area, health risk assessments of the studied water samples were used. Adults and children were subjected to a health risk evaluation that included non-carcinogenic and carcinogenic effects from oral exposure.
3.3.1 Oral non-carcinogenic effects of Cd and Pb on adults and children
According to the US Environmental Protection Agency's (USEPA) standard limits, HQ values for non-carcinogenic effects of oral ingestion exposure for Cd and Pb on adults and children must be less than 1 to be considered safe. However, 40% of the water samples exceeded the safe limit (1), except for HQCd values increasing in 85% of the groundwater samples (USEPA, 2011). HQ Cd and HQ Pb readings in water from El-Minya Governorate are above the USEPA's acceptable limit (1);(Salman et al., 2019). Also, in drinking water in Pakistan and China, HQ Cd and HQ Pb readings in water resources were under the standard limits (USEPA, 2011; Dong et al., 2020). Furthermore, as shown in Table 3 and Figs. 5 and 6, Cd has a higher influence than Pb.
Statistical parameter
Surface water
Groundwater
Min.
Max.
Mean
Min
Max.
Mean
Oral Non-Carcinogeic Effects
For Adults
CDI Cd
0.000000
0.000685
0.000338
0.000000
0.001781
0.000628
CDI Pb
0.000000
0.00274
0.000699
0.000000
0.002466
0.000576
HQ Cd
0.000000
1.369863
0.676712
0.000000
3.561644
1.256059
HQ Pb
0.000000
6.849315
1.746575
0.000000
6.164384
1.440112
HI Adults
0.000000
7.342466
2.379452
0.000000
7.589041
2.641377
For Children
CDI Cd
0.000000
0.000765
0.000378
0.000000
0.001988
0.000701
CDI Pb
0.000000
0.003058
0.00078
0.000000
0.002752
0.000643
HQ Cd
0.000000
1.529052
0.755352
0.000000
3.975535
1.402023
HQ Pb
0.000000
7.64526
1.949541
0.000000
6.880734
1.607465
HI Children
0.000000
8.195719
2.655963
0.000000
8.470948
2.948326
Oral Carcinogeic Effects
For Adults
HQ Cd
0.000000
0.004315
0.002132
0.000000
0.011219
0.003957
HQ Pb
0.000000
0.023288
0.005938
0.000000
0.020959
0.004896
TCR Adults
0.000000
0.024841
0.007932
0.000000
0.025447
0.00868
For Children
HQ Cd
0.000000
0.004817
0.002379
0.000000
0.012523
0.004416
HQ Pb
0.000000
0.025994
0.006628
0.000000
0.023394
0.005465
TCR Children
0.000000
0.027728
0.008854
0.000000
0.028404
0.009689
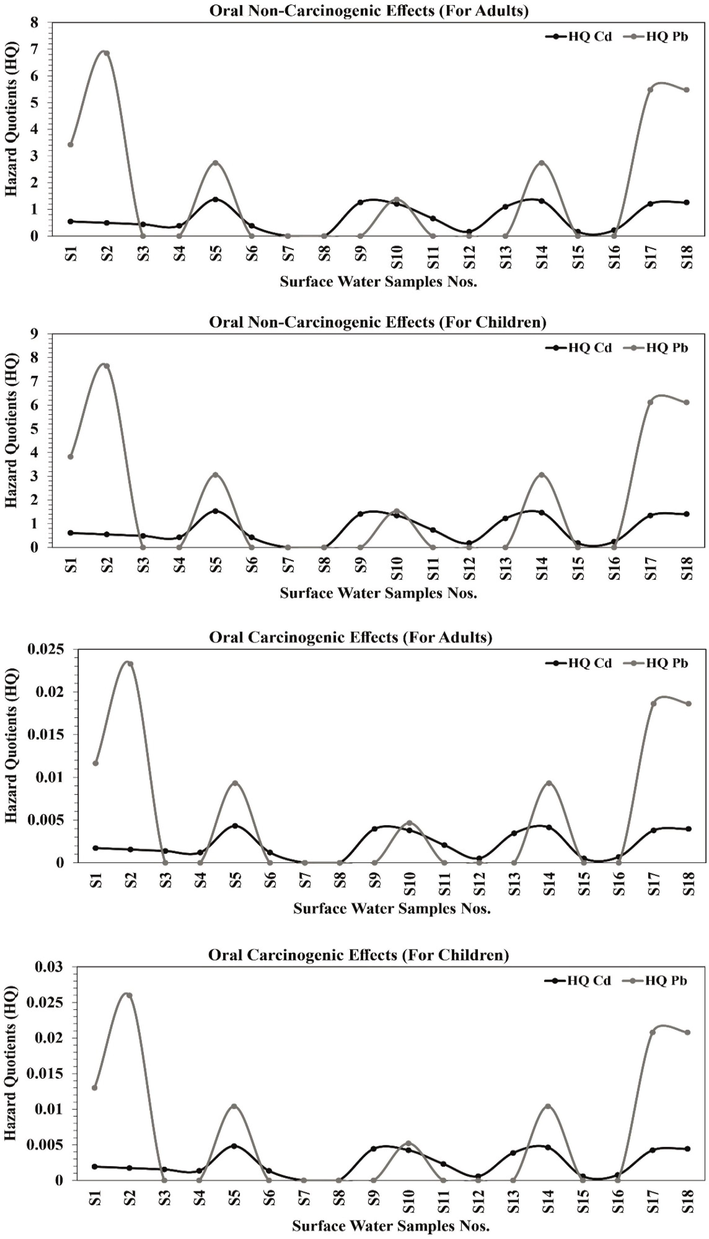
HQ Cd and HQ Pb values of the investigated surface water samples (Non-Carcinogenic and Carcinogenic).
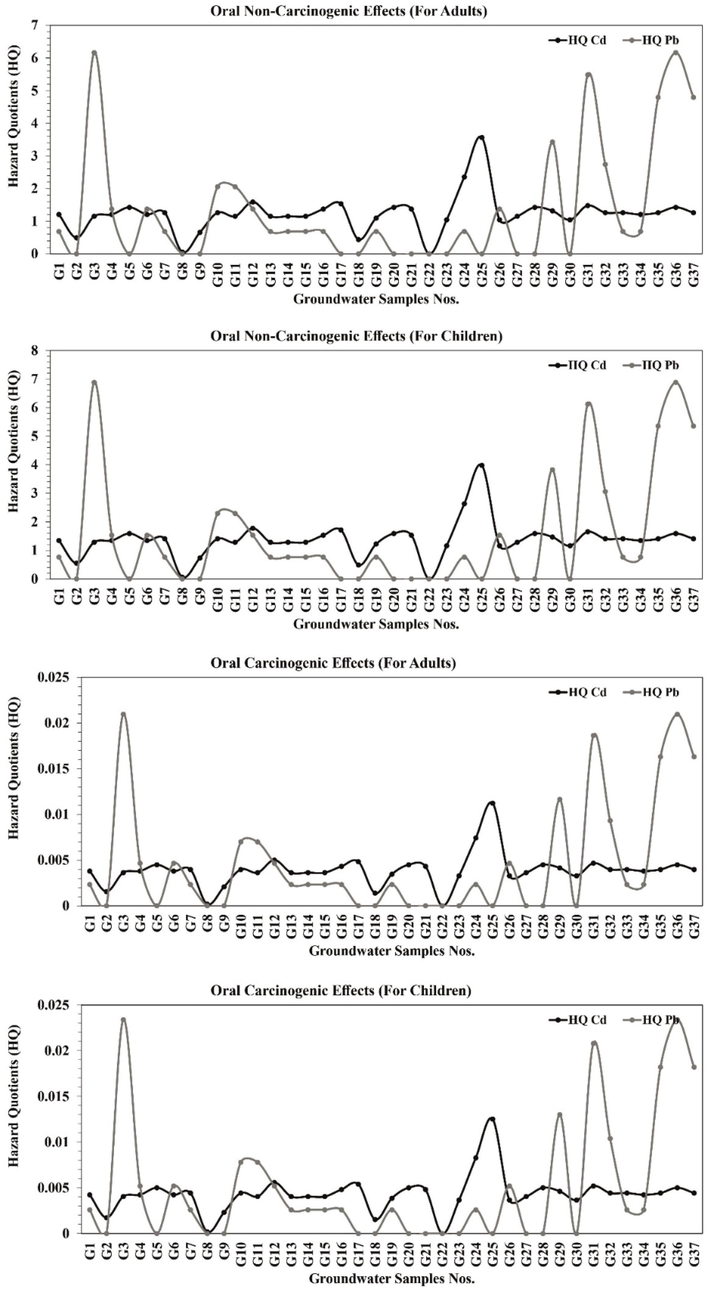
HQ Cd and HQ Pb values of the studied groundwater samples (Non-Carcinogenic and Carcinogenic).
In half the water samples tested, HI readings for non-carcinogenic consequences on adults and children exceed the USEPA (USEPA, 2011) regulatory limit (Table 3 and Fig. 7). Children's HI levels are higher than adults', indicating that the water poses a greater risk to children than to adults (Table 3 and Fig. 7).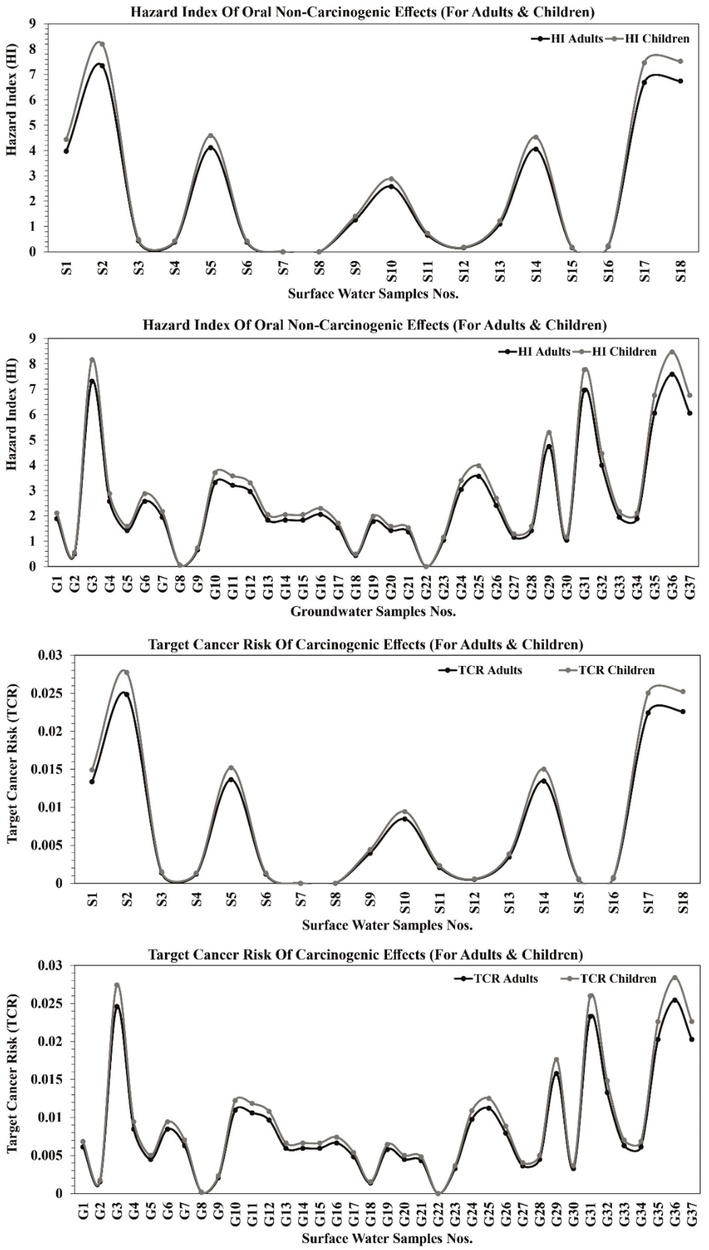
HI and TCR values in the investigated water samples.
3.3.2 Oral carcinogenic impacts of Cd and Pb on adults and children
In the majority of the investigated water samples, HQ Cd values for oral exposure to carcinogenic effects on adults and children above the USEPA (USEPA, 2011) standard limit (10−4) to be classified as high risk for residents (Table 3,Figs. 5 & 6). While HQ Pb values levels exceeded the safe limit (10−4) in 40% of surface water samples and 65% of groundwater samples (Table 3; Figs. 5 & 6) (USEPA, 2011). However, as seen in Table 3 and Figs. 5 & 6, Cd has a greater impact than Pb.
Furthermore, in the water of El-Minya Governorate, HQ Cd and Pb concentrations for oral carcinogenic consequences on adults and children are above the USEPA (USEPA, 2011) recommended limit (10−4), (Salman et al., 2019). Also, HQ Cd in water resources of China were under the safe limit (Dong et al., 2020).
In most of the water samples investigated, TCR values for oral carcinogenic consequences on adults and children are higher than the USEPA (USEPA, 2011) guideline value (10−4) to become dangerous (Table 3 and Fig. 7). Water has a much higher carcinogenic effect on Children than on adults, according to the study (especially for Cd metal).
4 Conclusion
The study samples' pH readings ranged from slightly acid to slightly basic, their EC contents ranged from slightly to severely mineralized, their water hardness ranged from hard to very hard, and their salinity ranged from extremely fresh to slightly saline. All physico-chemical parameters, with the exception of TH, Na+, K+, Cl-, and SO42-, fall within the acceptable ranges set by the WHO and EMH. The levels of the abovementioned ions in the tested groundwater samples were 20 percent, 6 percent, 25 percent, 3 percent, and 15 percent higher than allowed. Additionally, the Cd and Pb concentrations in the tested water samples were 87% and 64%, respectively, above acceptable limits. 21% of the water samples examined by WQI were deemed unsuitable for human consumption. This reflects the importance of geogenic and anthropogenic activity in the contamination of water. According to the results of the health risk assessment, Cd metals rather than Pb metals in the research region are the primary control in oral influences. Children are more impacted than adults by both noncarcinogenic and carcinogenic effects because of the HI values. Additionally, TRC collected information proving that youngsters were more susceptible to the carcinogenic consequences of drinking the tested water than adults were (especially for the element Cd). To safeguard inhabitants' health, Cd and Pb should be removed from the water in the research area. More hydrochemical research and monitoring are required in order to remove more Cd and Pb from the drinking water.
CRediT authorship contribution statement
Ahmed Asmoay: Supervision, Writing – review & editing, Writing – original draft, Formal analysis, Validation, Conceptualization, Methodology. Ahmed Mohamed: Supervision, Writing – review & editing, Formal analysis, Writing – original draft, Conceptualization, Methodology, Validation. Fahad Alshehri: Funding acquisition, Project administration, Visualization, Data curation, Resources, Validation. Nguyen Thi Thuy Linh: Funding acquisition, Project administration, Visualization, Resources, Investigation, Validation. Nadhir Al-Ansari: Funding acquisition, Project administration, Visualization, Resources, Investigation. Abdullah Othman: Project administration, Visualization, Resources, Investigation, Validation, Data curation.
Acknowledgment
The authors extend their appreciation to Abdullah Alrushaid Chair for Earth Science Remote Sensing Research for the funding.
Declaration of Competing Interest
The authors declare that they have no known competing financial interests or personal relationships that could have appeared to influence the work reported in this paper.
References
- Hydrochemical evolution and variation of groundwater and its environmental impact at Sohag, Egypt. Arab J. Geosci.. 2011;4(3–4):339-352.
- [Google Scholar]
- APHA., 2012. Standard Methods for the Examination of Water and Waste Water, 22nd ed. American Public Health Association, American Water Works Association, Water Environment Federation.
- Asmoay, A. 2017. Hydrogeochemical Studies on the Water Resources and Soil Characteristics in the western bank of the River Nile between Abu Qurqas and Dayr Mawas, El Minya Governorate, Egypt, Ph.D. thesis, Fac. Sci., Al-Azhar University, Egypt, 2017.
- ATSDR. 1997. Toxicological Profile for Cadmium. Agency for Toxic Substances and Disease Registry. 430p.
- Water quality: An introduction. USA: Kluwer Acad. Publisher; 2000. p. :330p.
- CCME, 2001. Water Quality, Canadian Council of Ministers of the Environment, Index 1.0, User’s Manual, Winnipeg (2001).
- Chrowtoski, P.C.1994. Exposure assessment principles. In: Patrick, D. R. (ED), Toxic Air Pollution Handbook. Van Nostrand Reinhold, New York, NY, P154.
- Health risk assessment of heavy metals and pesticides: A case study in the main drinking water source in Dalian. China. Chemosphere. 2020;242(2020):125113
- [CrossRef] [Google Scholar]
- Donia, N., 2007. Survey of Potable Water Quality Problems in Egypt, Eleventh International Water Tech. Conf., IWTC11 Sharm El-Sheikh, Egypt, 1049–1058.
- hydrogeochemistry of groundwater quality in the area between Abu Qurqas - Dayer Mawas districts, El Minya Governorate, Upper Egypt. International Journal of Recent Advances in Multidisciplinary Research.. 2017;04(04):2493-2497.
- [Google Scholar]
- Renal replacement therapy and increased risk of cardiovascular. Egypt. J. Hosp. Med.. 2006;22:29-38.
- [Google Scholar]
- EMH. 2007. Standards and specifications of water quality for drinking and domestic uses. (Egyptian Ministry of Health), Internal Report, No. 8.
- Fakhri, Y., Saha, N., Ghanbari, S., Rasouli, M., Miri, A., vapor, M., Rahimizadeh, A., Riahi, S. Ghaderpoori, M., Keramati, H., Moradi, B., Amanidaz, N., Khaneghah, A., 2018. Carcinogenic and non-carcinogenic health risks of metal(oid)s in tap water from Ilam city, Iran. Food and Chemical Toxicology 118, 204–211. https://doi.org/10.1016/j.fct.2018.04.039.
- Effect of coagulant treatment on the metal composition of raw water. Water SA. 2002;28:293-297.
- [Google Scholar]
- Haseen, K., Amir, A.K., Sarah, H. 2005. “The Canadian Water Quality Index: A Tool for Water Resource Management”. Mterm International Conference, 06 - 10 June, Ait, Thailand.
- Hem, J.D. 1992. Study and interpretation of chemical characteristics of natural water (3d ed.): U.S. Geological Survey Water-Supply Paper 2254, 263p.
- Heavy metal contamination trends in surface water and sediments of a river in a highly-industrialized region. Environmental Technology & Innovation. 2020;20(2020):101043
- [CrossRef] [Google Scholar]
- Influence of different land use types on hydrochemistry and heavy metals in surface water in the lakeshore zone of the Caohai wetland, China. Environmental Pollution. 2020;267(2020):115454
- [CrossRef] [Google Scholar]
- Processes of water–rock interactions and their impacts upon the groundwater composition in Assiut area, Egypt: Applications of hydrogeochemical and multivariate analysis. Journal of African Earth Sciences. 2019;149:72-83.
- [Google Scholar]
- A health risk assessment for exposure to trace metals via drinking water ingestion pathway. Inter. J. Hyg. Environ. Health. 2009;212:216-227.
- [Google Scholar]
- Chloride in groundwater and surface water in the vicinity of selected surface-water sampling sites of the beneficial use monitoring program of Oklahoma, 2003. USGS /SIR 2004:2004-5060.
- [Google Scholar]
- Simulation of Surface and Subsurface Water Quality in Hyper-Arid Environments. Hydrology. 2023;10:86.
- [CrossRef] [Google Scholar]
- Hydro-Geochemical Applications and Multivariate Analysis to Assess theWater–Rock Interaction in Arid Environments. Appl. Sci.. 2022;12:6340. app12136340
- [CrossRef] [Google Scholar]
- Carcinogenic and non-carcinogenic health risk assessment of heavy metals in drinking water of Khorramabad, Iran. MethodsX. 2020;6(2019):1642-1651.
- [CrossRef] [Google Scholar]
- Investigation of Geochemical Characterization and Groundwater Quality with Special Emphasis on Health Risk Assessment in Alluvial Aquifers, South Africa. International Journal of Environmental Science and Technology. 2021
- [CrossRef] [Google Scholar]
- Health risk assessment of heavy metals and their source apportionment in drinking water of Kohistan region, northern Pakistan. Microchemical Journal. 2011;98:334-343.
- [Google Scholar]
- Evaluation of surface water for different uses in the area between Abu Qurqas - Dyer Mawas Districts, El Minya Governorate, Egypt. IJISET - International Journal of Innovative Science, Engineering & Technology. 2017;4(1):120-128.
- [Google Scholar]
- Sadek, M.A., 2001. Isotopic criteria for upward leakage in the alluvial aquifer in north El Minia district, Egypt. Ann. Geol. Surv. Egypt, XXIV, 585-596.
- The geological evolution of the River Nile. New York: Springer; 1981. p. :151p.
- Said, R. 1990. The geology of Egypt. Balkema Publ. Comp., Rotterdam, Brookfield, Netherlands, 734p.
- Evaluation of human risks of surface water and groundwater contaminated with Cd and Pb in the southern El-Minya Governorate, Egypt. Drink. Water Eng. Sci.. 2019;12:23-30.
- [CrossRef] [Google Scholar]
- USEPA, 1992. Guidelines for Exposure Assessment. EPA/600/Z-92/001. US Environmental Protection Agency, Risk Assessment Forum, Washington, DC.
- USEPA, 2011. Exposure Factors Handbook, United States Environmental Protection Agency, Washington, D. C., EPA/600/R-09/052F.
- Minerals: Their Constitution and Origin. New York: Cambridge University Press; 2004.
- WHO. 2022. Guidelines for drinking-water quality: fourth edition incorporating the first and second addenda. ISBN 978-92-4-004506-4.
- Assessment of health risk of heavy metals and water quality indices for irrigation and drinking suitability of waters: a case study of Jamalpur Sadar area, Bangladesh. Environmental Advances. 2020;2(2020):100005
- [CrossRef] [Google Scholar]


