

Translate this page into:
Vulnerability of rice production to temperature extremes during rice reproductive stage in Yangtze River Valley, China
⁎Corresponding authors at: College of Agronomy, Nanjing Agricultural University, Nanjing, China. mrehmani@gudgk.edu.pk (Muhammad Ishaq Asif Rehmani), dingyf@njau.edu.cn (Yanfeng Ding)
-
Received: ,
Accepted: ,
This article was originally published by Elsevier and was migrated to Scientific Scholar after the change of Publisher.
Peer review under responsibility of King Saud University.
Abstract
The increasing trend of extreme heat events poses serious implications for rice production in China, especially when it coincides with the heat-sensitive reproductive growth period (RGP) leading to high temperature-induced spikelet sterility. (2) Methods: This study analyzed the long-term meteorological data of Jiangsu province, located at lower reaches of Yangtze River Valley, to ascertain changing trends in temperature extremes. Moreover, stress days and nights were derived from temperature extremes, during RGP as a proxy of rice sterility in the province. The stress days were defined in three ways, with higher daily maximum (≥35 °C, hot day, HD), and minimum temperature (≥28 °C, hot night, HN) and days with both critical limits (severe hot day, SHD). (3) Results: The analysis of data revealed that a definite warming hiatus period in the 1970s and a transitional phase in 1980s were evident for daily maximum temperatures (TMX) in the province. Warm phases since 1990s were evident for both day and night temperature extremes. Asymmetric warming of TMX and daily minimum (TMN) temperatures reduced diurnal temperature range (DTR) over time. The slight negative trend for TMX and HD were observed, while trends for TMN, HN and SHD were strongly positive in the province with regional variations. (4) Conclusion: Observed increasing trends of TMN, HNs, and SHDs, as well as the decreasing DTR during rice RGP can be a threat to rice production in the province. Rice crop in the Southern Jiangsu is more vulnerable to higher temperature extremes while in the northern Jiangsu, decreasing DTR can be crucial. These findings could have useful implications for improving rice yield under changing climate.
Keywords
Climate change
Diurnal temperature range
Hot days
Hot nights
Global warming
Temperature extremes

- DTR
-
diurnal temperature range (TMX-TMN)
- GHG
-
greenhouse gases
- HD
-
Hot Day (TMX≥35°C)
- HN
-
Hot Night (TMN≥28°C)
- RGP
-
Reproductive growth phase
- RH
-
relative humidity
- SHD
-
Severe hot day (A HD (TMX≥35°C) accompanied with HN)
- TMN
-
daily minimum temperature
- TMX
-
daily maximum temperature
Abbreviations
1 Introduction
Human-induced elevation in greenhouse gases (GHG) has contributed to a significant increase in mean global surface temperature, as well as more frequent and intense climate extremes (extreme weather and climate events) during recent decades (Dosio et al., 2018; Hoegh-Guldberg et al., 2019). Intensity and frequency of these extremes and mean temperature are likely to increase in future as well, with a high degree of unpredictability) as well as profound agricultural, economic, environmental and societal impacts Wang et al., 2020). The effect of extreme climate events on plants exclusively depends on duration, intensity and frequency of these events, crop growth stage and management practices (Piao et al., 2019).
Temperature increase during the last half of the 20th century was mainly driven by an increase in daily minimum temperature (TMN), or a decrease in daily maximum temperature (TMX). Asymmetric behavior of TMX and TMN resulted in a decrease in the diurnal temperature range (DTR) (Yang et al., 2020). Increasing aerosol amounts due to a consistent increase in aerosol precursor emission contributed to negative radiating forcing, and a subsequent lower TMX. Moreover, clouds and haze frequently perturb incident solar radiation (Pyrgou et al., 2019). Increasing nighttime temperature can be attributed to rising GHGs and suspended particles, which reflect longwave radiations emitted by the earth’s surface (Xiong et al., 2020).
Rice (Oryza sativa L.) is the staple food for about half of the world population with Asian countries like China and India as its top producers and consumers (Zhang et al., 2017). Yangtze River Valley of China is one of the oldest regions for rice production (Huang et al., 1998; Schneider and Asch, 2020). Rice plant growth and development is under strict environmental control (Wang et al., 2019). The optimum temperature for photosynthesis varies between 14 and 32 °C; beyond this range, it has a decreasing effect on photosynthesis (Parent et al., 2010). Rice crop growth cycle divided into three distinct phases; vegetative, reproductive and grain filling. Each of these phases has its critical temperature requirements and responses to temperature anomalies (Deng et al., 2015; Rehmani et al., 2014). The temperature above the critical range significantly harms plant development and functioning, by alteration of metabolism, photosynthesis and respiration rates, which in turn results in crop growth and yield losses (Khan et al., 2019).
Plants are considered more tolerant to temperature stress during the vegetative phase. The activity and amounts of enzymes essential in rice plants are optimized to cover a broad range of temperature (5–40 °C). Therefore, temperature anomalies within this range may not produce a significant harmful impact on vegetative aspects of plant growth (Rashid et al., 2020; Wassmann et al., 2009). Pollen development and photosynthesis are primarily considered the most sensitive physiological processes to heat stress (Hussain et al., 2019; Xiong et al., 2017). Asymmetric changes in temperature (higher TMN) can enhance respiration, while other plant processes appear to be less sensitive (Satake and Yoshida, 1978).
Rice reproductive growth phase (RGP) is more sensitive to heat stress than the vegetative phase (Sánchez et al., 2014). Events during RGP differ in their responses also, as temperature >30 °C can affect panicle differentiation, while 33–35 °C at anthesis can result in floret sterility (Bheemanahalli et al., 2016; Matsui and Hasegawa, 2019). Increasing relative humidity (RH) (>60%) along with high temperature caused a reduction in the rate of respiration. Consequently, less ameliorating cooling of spikelets and ultimately aggravate the effect of high temperature (Tian et al., 2009Tian et al., 2009). High temperature (35 °C) and low RH (50%) showed a significant temperature difference between air and organ temperature. However, high temperature (35 °C) accompanied by high humidity (80%) significantly increased the panicle temperature, which ultimately resulted in lower seed setting in rice (Laza et al., 2015). Under humid condition (RH of ≥80%) spikelet sterility reported to be initiated at 30 °C, which gradually increased and causing almost 100% spikelet sterility at 36 °C (Ishimaru et al., 2016).
In Jiangsu province, TMX and RH during RGP are approaching their threshold limit. Further increase in temperature will adversely hamper the crop reproductive processes, which is expected to create significant food security crisis. Yangtze River Valley experienced severe temperature anomalies during summer 2003, resulting in massive losses in rice yield, hitting the 20–years lowest record. Yield losses were mainly due to increased span and intensity of temperature extreme during RGP, resulted in drastically low seed setting. This added urgency for better understanding the characteristics and changing the behavior of temperature extremes, relationships between changing characteristics during heat stress period and its potential effects on rice reproduction growth processes.
Little attention has been devoted to the unearthing role of extreme heat events and their impacts at critical growth stages of crops. Improvement in climate simulation at a regional scale needs a comprehensive understanding of regional climatic problems and their threshold. This can be understood via the impact of past trends to gauge the importance of near-term climate change for future food availability (He and Wang, 2020). An updated appraisal of climatic and weather extremes will help us to decipher unpredictable risk during the sensitive crop growth stages.
This study was conducted to assess variability in temperature extremes and stress days during RGP using weather records from various weather stations in Jiangsu province, China and explore the heat stress vulnerability of rice production in Yangtze River Valley over the period 1951–2009. Results of this study will be helpful in device suitable adaptation planning for climate-resilient rice production.
2 Data and methodology
2.1 Study area, data collection, and analysis
Jiangsu province is located at Lower Reaches of Yangtze River Valley (116°18′ and 121°57′ east longitude and between 30°45′ and 35°20′ north latitude), contributing 7.7% (2.4 million hectares) to the total paddy area of China. Climatic conditions, cropping pattern and genotypes define optimum sowing and heading times in cereals, including rice (Collins and Chenu, 2021). In Yangtze River Valley, optimum sowing dates for rice cultivars were simulated between mid-April to mid-May and subsequently, heading dates were modelled from the end of July to the end of August (Huang et al., 1998). Rice reproductive growth phase (RGP) extends from pollen mother cell formation to fertilization. In Yangtze River Valley RGP ranges from 30 to 40 days, depending on varietal characteristics and degree of temperature exposure (Huang et al., 1998). Rice varieties (120-days life cycle) start their RGP after ∼60 days of germination and their RGP may last around ∼30 days (Wassmann et al., 2009). Consequently, we defined rice RGP extended from 15th July to 5th September (53 days) for the present study.
2.2 Climate datasets
Climate datasets (1951–2009) were obtained from different weather stations in Jiangsu province of China (China Meteorology Department) (Fig. 1) and verified from National Oceanic and Atmospheric Administration (NOAA) database. Weather stations sub-grouped into three rice production regions in the province, including northern (i.e. north of the Yangtze River Valley), central (i.e., along the Yangtze River Valley) and Southern Jiangsu (i.e., south of the Yangtze River Valley) (Fig. 1). Daily maximum temperature (TMX), daily minimum temperature (TMN), and mean relative humidity (RH) of weather stations in Jiangsu province is presented in this study.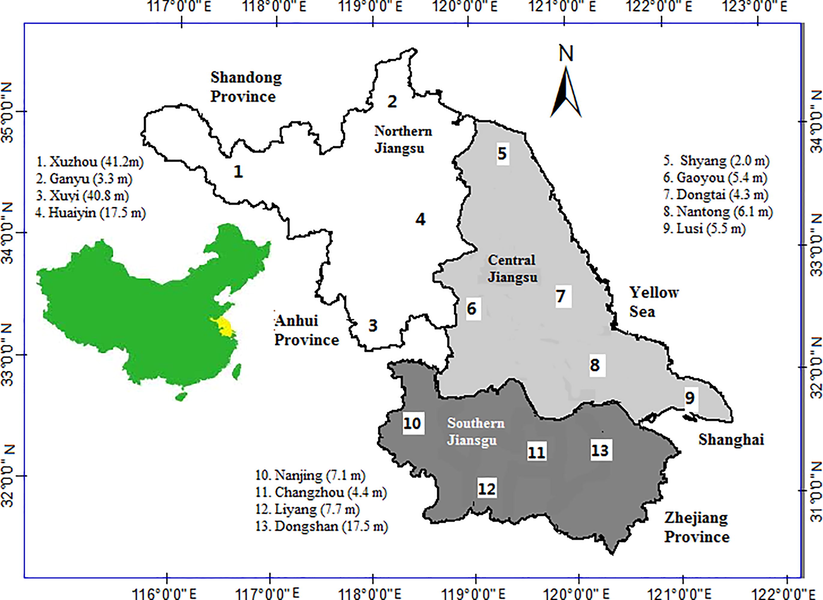
Location and regional distribution of weather stations in Jiangsu province (altitude m asl).
2.3 Stress days
The datasets acquired from different weather stations of Jiangsu province were used to determine stress days, including hot days (HD), hot nights (HN), and severely hot days (SHD). Daily maximum temperature ≥35 °C (TMX35) is the upper-temperature threshold for rice growth at RGP (Coast et al., 2016). The number of days with TMX ≥ 35 °C (HD), and nights with TMN ≥ 28 °C (HN) were computed for every season during the studied period (Table 1). An HD accompanied by an HN was considered a severe hot day (SHD).
Station
MX TMX since 1951
MX TMX 2003
MX TMN since 1951
MX TMN 2003
Temp (°C)
Date
Temp (°C)
Date
Temp (°C)
Date
Temp (°C)
Date
Northern Jiangsu
Xuzhou
39.9
15.07.2002
38.1
31-Aug
30.2
01.08.2003
30.2
1-Aug
Ganyu
39.5
15.07.2002
36.8
1-Aug
28.6
23.08.2004
28.4
3-Aug
Xu yi
39.6
18.7.1966
38.6
1-Aug
29.0
02.08.2003
29
2-Aug
Huaiyin
39.5
08.08.1966
38.6
1-Aug
29.7
25.07.2004
29.6
28-Aug
Central Jiangsu
Sheyang
39.0
08.08.1966
37.5
2-Aug
28.8
21.08.1959
27.6
25-Jul
Gaoyou
39.8
02.08.2003
39.8
2-Aug
31.5
02.08.2003
31.5
2-Aug
Dong Tai
38.8
02.08.2003
38.8
2-Aug
29.9
02.08.2003
29.9
2-Aug
Nantong
39.5
02.08.2003
39.5
2-Aug
29.9
01.08.2007
29.1
2-Aug
Lusi
38.2
06.08.1966
36.8
2-Aug
28.4
13.08.1998
27.1
2, 27- Aug
Southern Jiangsu
Nanjing
40.7
22.08.1957
40.0
2-Aug
30.0
16.07.2002
29.8
2-Aug
Changzhou
39.0
02.08.2003
39.0
2-Aug
30.6
19.07.1988
30.2
25-Jul
LiYang
39.5
01.08.2003
39.5
1-Aug
30.9
20.07.2009
30.1
3-Aug
Dongshan
38.5
28.07.2007
38.3
1, 2-Aug
30.9
29.07.2003
30.9
29-Jul
Jiangsu
40.7
22.08.1957
40.0
2-Aug
31.5
02.08.2003
31.5
2-Aug
2.4 Analytical approach
Baseline climate period (1961–90) was used to observe anomalies concerning contemporary climatic conditions. Inter-annual and inter-decadal anomalies and percent changes from the baseline climate period were computed. Averages and percent for TMX, TMN, diurnal temperature range (DTR), RH, HDs, HNs, and SHDs were also calculated for each season of the rice RGP.
2.5 Time period
The climatic observations over 59-years were arbitrarily divided into two almost equal-sized sub-periods, 1951–1980 as the first half, and 1981–2009 as the second half. To assess the differential characteristics of seasonal temperature extremes, DTR, RH and frequency of stress days of recent years (second-half) were compared to past years (first half). Absolute differences and percent changes in studied parameters were calculated between the first and second halves. Stress days during rice RGP were computed as a proxy for high temperature-induced floret sterility based on three different criteria, i.e., HD, HN, and SHD. Moreover, RH data was also included, because of high atmospheric RH along with high temperature intensifies heat stress. In this paper we have computed provincial and regional averages, long-term and decadal trends and anomalies of temperature extremes, DTR, stress days and RH, as well as discuss their possible significance for rice cultivation, improving basic understanding and focusing on the hot spot of seasonal vulnerability.
3 Results
3.1 Spatiotemporal trends and anomalies in temperature extremes and DTR
Temporal trends in TMX and TMN during rice RGP in Jiangsu province over 1951–2009 are presented in Fig. 2. Overall, TMX showed decreasing trends, while TMN exhibited an increasing trend. Time series of TMX and TMN from 1951 to 2009 appears to fall in three distinct regimes, consisting of an initial period of reduction (1950s–1980s), in the middle plateau (1980s) and ended rapidly with the increasing trend (1990s–2000s).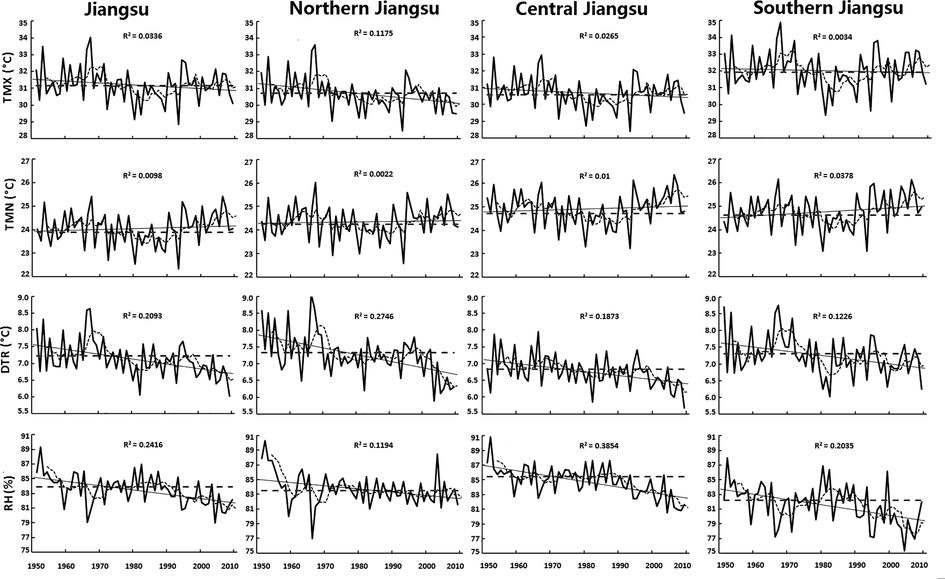
Time series of seasonal averages of daily maximum (TMX) and minimum (TMN) temperature, diurnal temperature range (DTR) and relative humidity during rice reproductive growth phase (RGP) for Jiangsu and its northern, central, and southern regions. The dotted line indicates five years running average and the horizontal broken straight line indicates average for the baseline period (1961–90).
The highest seasonal averages for TMX (31.42 °C) and TMN (25.49 °C) during rice RGP in Jiangsu province were observed in 1967 and 2006). Historically maximum values of TMX and TMN for each station are presented in Table 1. Since 1951, the highest TMX (40.7 °C) was recorded in Nanjing (22nd August 1957), whereas the highest TMN (31.5 °C) was observed in Gaoyou on (2nd August 2003). In 2003 severe heatwave damaged rice production in the province and maximum values of temperature extremes were recorded (either for TMX and/or TMN) of all the stations which were very close to the record high values observed since 1951. For all the locations, the extreme temperature values were concentrated during the first two days of August. Most of the stations recorded their maximum seasonal values of TMX (62% station) and TMN (77% stations) during the 2000s.
Decadal trends of averages, anomalies and percent difference from the baseline period (1961–90) for TMX and TMN are presented in Fig. 3. Both TMX and TMN showed decreasing trends during the 1970s and early 1980s, however, started to increase during the late 1980s. The decadal trends for TMX were heterogeneous among three regions, northern Jiangsu, central Jiangsu and whole Jiangsu province followed decreasing trend with an order of the 1960s > 1950s > 1990s > 2000s > 1970s > 1980s. Whereas, Southern Jiangsu followed the order (1960s > 2000s > 1990s > 1950s > 1970s > 1980s), which was slightly different from the rest of the province. The decadal trend for TMN was quite homogeneous among the regions with increasing order of the 1980s < 1970s < 1950s < 1990s < 1960s < 2000s. The increased anomaly (deviation from baseline period 1961–1990) of Jiangsu for TMN was dominated by central (+0.68 °C) and Southern Region (+0.62 °C) for the 2000s while Northern Region lagged with an anomaly of +0.31 °C for 2000s which was lower than its anomaly of 1960s (+0.38 °C).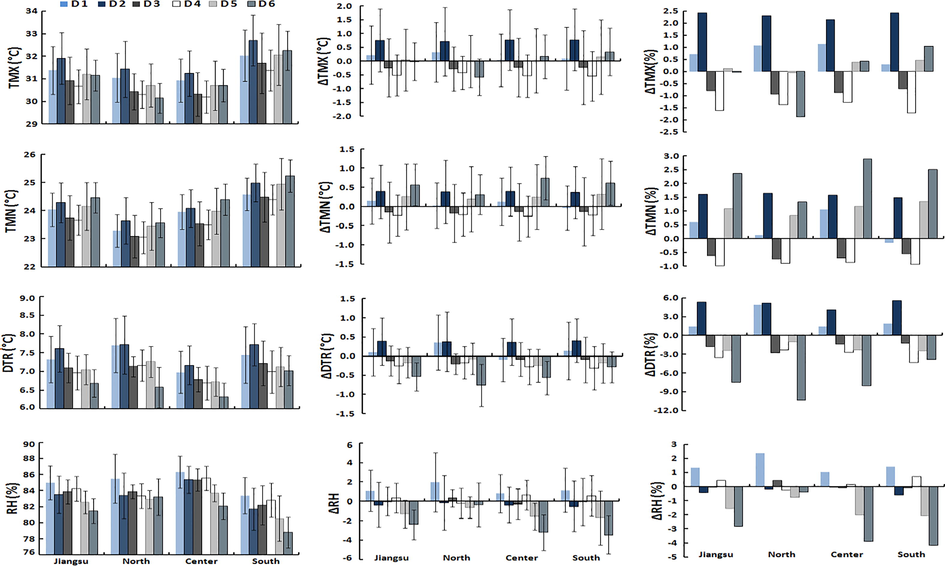
Decadal averages and anomalies from the baseline period (1961–90) of daily maximum (TMX) and minimum (TMN) temperature, diurnal temperature range (DTR) and relative humidity during rice reproductive growth phase (RGP) for the Jiangsu province and its three regions. D1,1951–60; D2,1961–70;D3,1971–80;D4,1981–90;D5,1991–2000;D6,2000–09.
Averages for seasonal ΔTMX and ΔTMN (deviation from the averages during the baseline period) were 0.04 and 0.15 °C. The faster increase in TMN and slow increase of TMX, particularly during the 2000s resulted in the narrower DTR. Distinct regional anomalies from the baseline (1961–1990) were observed in Southern Jiangsu for TMX, in northern, central, and Southern Jiangsu for TMN resulting in regional variations in DTR. The widening DTR, during the 1950s to the late 1960s, subsequent decreasing trends were recorded from the mid-1980s and onward. The rapid rise in TMN (+0.61 °C) as compared to a slow rise in TMX (+0.02 °C) during the 2000s caused reduction in DTR (−0.56 °C).
For long-term averages of temperature extremes highlighted an asymmetric trend in TMX and TMN (Fig. 4). Averages of TMX showed a strong negative trend, and TMN averages showed a weak positive trend, which resulted in a narrower DTR over time (Fig. 5). TMX in first-half (31.40 ± 1.13 °C) were insignificantly higher than in the second-half (31.0 ± 0.89 °C), while TMN showed a slight increase in the second-half (24.08 ± 0.72 °C), as compared to the first-half (24.06 ± 0.71 °C). Comparatively higher values of TMX, TMN, and average temperature were observed for the Southern Jiangsu as compared to other regions. Decrease in TMX was maximum (-1.9%, ΔTMX = −0.58 °C) for the Northern Region, while minimum (−0.78%, ΔTMX = −0.25 °C) for Southern Region with overall provincial decrease (−1.3%, ΔTMX = −0.41 °C). Change in TMN was weakly positive with a provincial average of +0.24% (ΔTMN = +0.06 °C) with a maximum increase of +0.65% for Southern Region (ΔTMN = +0.16 °C) and minimum increase of +0.05% (ΔTMN = +0.01 °C) for Northern Region.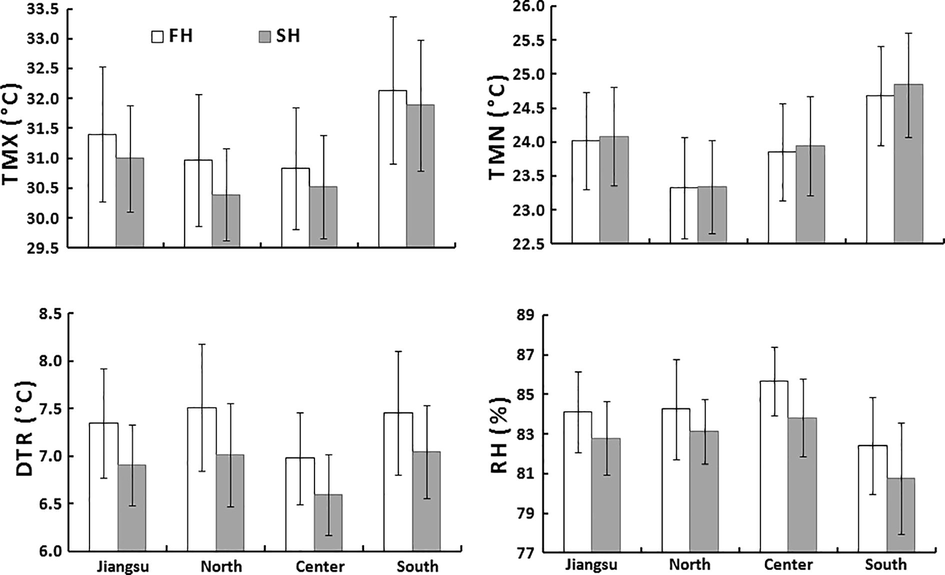
Thirty-year averages of daily maximum temperature (TMX), daily minimum temperature (TMN), diurnal temperature range (DTR) and relative humidity (RH) during rice reproductive growth phase (RGP) from first-half (FH, 1951–80) and second-half (SH, 1981–2009) of the data. The absolute difference and percentage change between FH and SH for the Jiangsu province and its three regions.
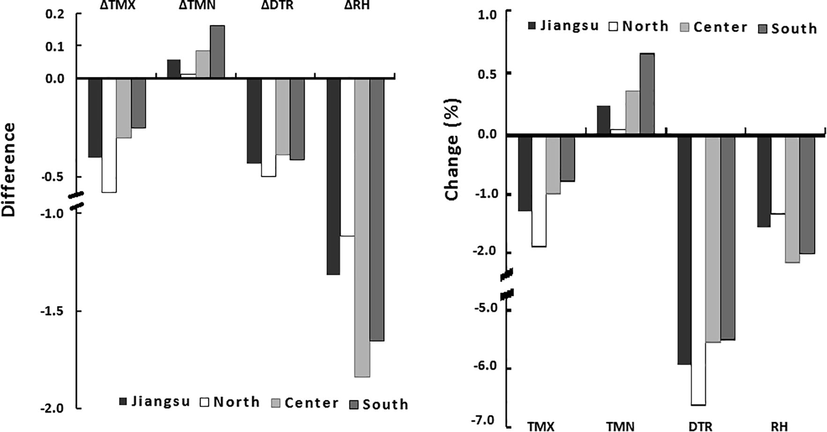
Thirty-year averages of temperature extremes, diurnal temperature range, and relative humidity.
The asymmetric trends of TMN and TMX resulted in −5.9% (ΔDTR = −0.44 °C) decrease DTR. The percent decrease in DTR was maximum of −6.6% (ΔDTR = −0.50 °C) for the Northern Region. In comparison, the other two regions shared a similar decrease of −5.5% with ΔDTR = −0.39 °C and −0.41 °C for the central and Southern Region, respectively. Asymmetry leads to the narrowing temperature distribution and can be mainly attributed to the fact that the warming trend in TMX lagged.
3.2 Spatiotemporal trends and anomalies in RH
Seasonal averages of RH decreased slightly over time for the Jiangsu province, though regional variation exists (Fig. 2). The maximum decrease in RH was recorded for the Southern (R2 = 0.2035) and Central Region (R2 = 0.1226) while the increasing trend for the Northern Region (R2 = 0.0378). Decadal trends of averages, anomalies and percent difference from the baseline period (1961–90) for RH are presented in Fig. 3. RH was highest during the 1950s and gradually decreased till the early 1970s, followed by an increase till 1990s, and then reduced until 2000s. Overall, the Southern Region experienced drier seasons while the Central Region experienced wet seasons as compared to the Northern Region of the province. During the 1950s, rice RGP in the area experienced the humid seasons (85% RH), while the driest seasons were experienced during 2000s (81.5% RH). Anomalies in RH were maximum for the Southern (−4.18%) and central (−3.9%) regions during the 2000s. Averages of RH during sub-periods varied from 85.7 ± 1.7% (First-half, Central Region) and 80.8 ± 2.8% RH (second-half, Southern Region). Second-half of the dataset was prominent with lower averages of RH.
3.3 Spatiotemporal trends and anomalies in stress days
Generally, the frequencies of stress days during rice RGP show different trends at spatiotemporal scales throughout Jiangsu province (Fig. 6). Seasonal incidence of stress days was higher in the Southern Region (Table 2). Out of a total 4000 HDs occurred during the study period in Jiangsu, about 54% occurred in the four stations of Southern Jiangsu, followed by Central (25%) and Northern Regions (22%) (Fig. 7). On the other hand, out of a total 996 HNs (885 SHDs) detected in the province, 64% (61%) prevailed in Southern Jiangsu, followed by 22% (24%) in Central and 14% (15%) in Northern Jiangsu. The highest number of consecutive HDs (35), HNs (14) and SHD (13) were recorded in Nanjing (1966), Changzhou (1998) and Dongshan (2003), respectively.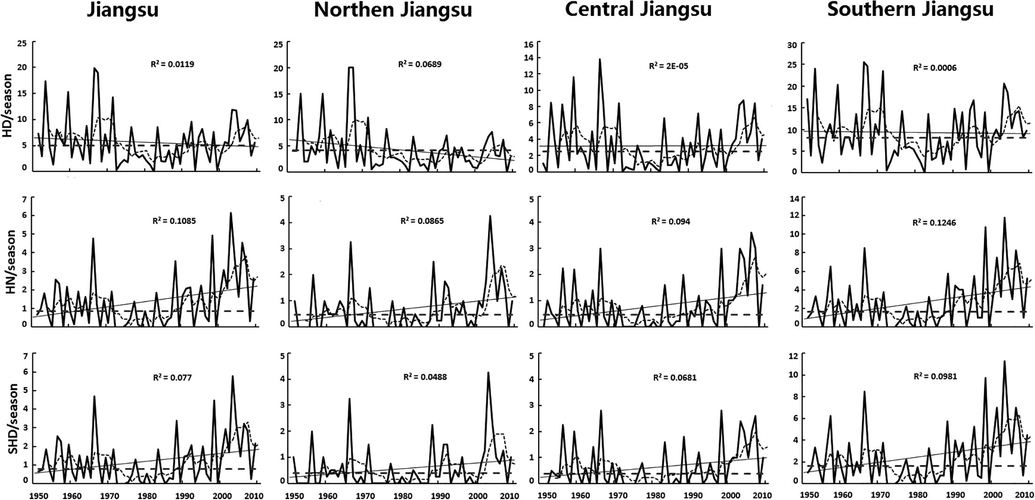
Seasonal averages of stress days during the reproductive growth stage of rice in Jiangsu and its northern, central, and southern regions. Hot days (HDs), hot nights (HNs) and severe hot days (SHDs) The dotted line indicate five years running average and the horizontal broken straight line indicates average for the baseline period (1961–90).
Station
Maximum HDs
Year
Maximum HNs
Year
Maximum SHDs
Year
2003
HDs
HNs
SHDs
Northern Jiangsu
Xuzhou
25
1967
6
2003
6
2003
8
6
6
Ganyu
13
1966
5
2004
4
1966, 2004
2
1
1
Xuyi
24
1966
8
2003
8
2003
10
8
8
Huaiyin
23
1967
5
5
1966
7
2
2
Central Jiangsu
Sheyang
17
1967
2
1959, 1964
2
1959, 1964
8
0
0
Gaoyou
22
1966
7
2006
5
1956, 2004, 2006
10
6
5
Dong Tai
21
1966
5
1998
4
1966, 1998. 2004
6
2
2
Nantong
16
2003, 2007
11
2007
10
2007
16
8
6
Lusi
10
1966
4
1998
4
1998
5
0
0
Southern Jiangsu
Nanjing
35
1966
11
2003
11
2003
20
11
11
Changzhou
24
1966
14
1998
13
1998
16
11
10
LiYang
25
1966, 1971
11
2003
11
2003
24
11
11
Dongshan
28
1971
14
2003
13
2003
22
14
13
Jiangsu
35
1966
14
1998, 2003
13
1998, 2003
24
14
13
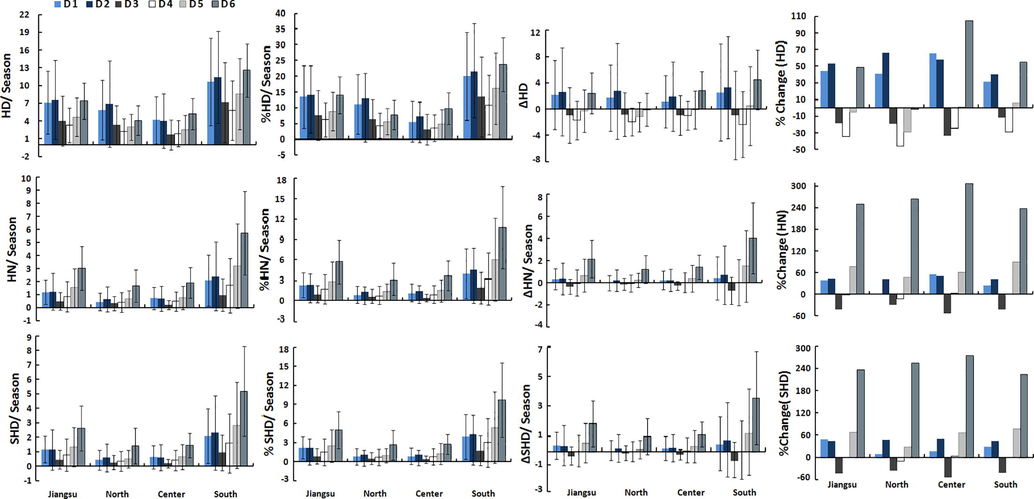
Decadal averages, anomalies, and percent difference from the base line period (1961–90) of hot days (HDs), hot nights (HNs) and severe hot days (SHDs) during rice reproductive growth phase (RGP) in Jiangsu province and its three regions.
During the year 2003, a maximum number of consecutive HDs (24) were observed at Liyang, followed by Dongshan (22). HNs and SHD, during 2003 season were also intense in a sense that they were consecutive, severe and centered in the 12 days of the vulnerable period (22 July – 2 August) and appeared to be sensitive to yield change. During rice RGP of 2003, days with higher temperature extremes possibly hit the vulnerable processes during reproduction (male meiosis or microsporogenesis) resulting in 20 years lowest yield record.
The slightly decreasing trend of HDs per season and anomalies in Jiangsu province were mainly contributed by a substantial decrease in the Northern Region as the other two regions showed almost a static pattern of HDs. The maximum frequency of HDs was recorded during the 1960s (7.6 HDs per season) and was concentrated during 1966 and 1967 when most of the stations faced prolonged heat events (Fig. 7). Considering regional averages, the intensity of HDs was higher (10.4 HDs per season) for the Southern Region while it was minimum for the Central Region (4.2 HDs per season). During the 1970s and 1980s, HDs remained relatively dormant and increased in 1990s and continued an increasing trend during 2000s. At the provincial level, decreased frequency of HDs during the 1990s was mainly contributed by a significant reduction in the Northern Region, which shifted to other regions as Central (105% increase) and Southern (55% increase) regions experienced their record high frequency of HDs during 2000s.
Generally, the frequencies of HNs and SHDs during rice RGP have increased throughout Jiangsu province with a positive trend (R2 = 0.1085 and 0.077), dominated by Southern Region (R2 = 0.1246 and 0.0981) (Fig. 6). Since the 1970s activity of HNs and SHD consistently increase and their maximum frequency was during the 2000s (3.02 HNs and 2.62 SHDs per season).
On average, the numbers of HNs (SHDs) at Jiangsu stations has increased from 0.9 HNs (0.78 SHDs) per season during the baseline period (1961–1990) to 3.02 HNs (2.62 SHDs) per season in the 2000s (Fig. 7). Though HNs were reasonably active during the 1950s and 1960s, their activity was concentrated during 1990s and 2000s when most of the stations experienced prolonged heat events. The incidence of SHDs was focused during the 1990s and 2000s (Table 2). Similar to the HDs, both HNs SHDs were also less frequent during the 1970s. Anomalies from the averages during the baseline period showed a strong positive trend for Southern Region compared to the other two regions. The HNs and SHDs remained less active in some coastal stations (Ganyu, Sheyang and Lusi) in northern and central Jiangsu.
Long-term averages of stress days showed different patterns, HDs reappeared after 30 years span with asymmetrical regional strength. Around 52.6% (6.25 HDs per season) of total HDs were found during first-half and rest during second-half (5.03 HDs per season). This decrease was prominent in the Northern Region with 42.9% decrease in the activity of HDs. Contrarily, HNs and SHDs were mainly recorded during the second-half (66.7 and 65.2%) than the first half (33.3 and 34.8%) (Fig. 8).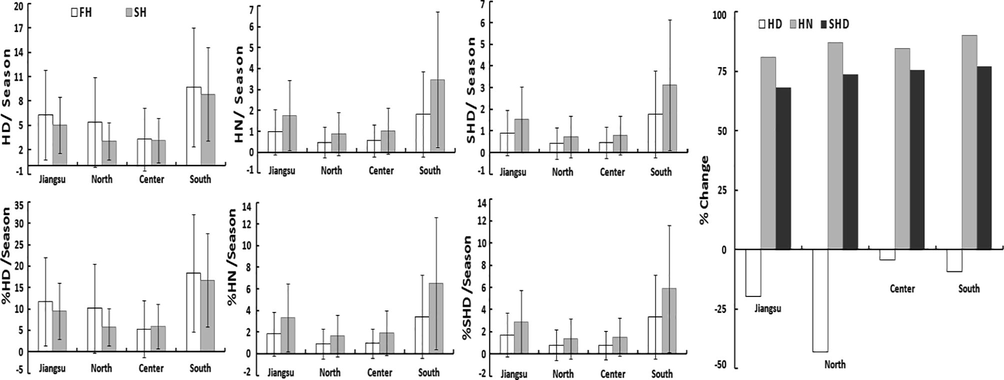
Thirty-year averages and percent stress days during the reproductive stage of rice in the Jiangsu province and its three regions. Hot days (HDs), hot nights (HNs) and severe hot days (SHDs), first half (FH, 1951–80), second half (SH, 1981–2009) of the data.
4 Discussion
4.1 Spatiotemporal trends and anomalies in temperature extremes
Changes in temperature variability are linked with anomalies in cloudiness, atmospheric water vapors, monsoon-driven climate, anthropogenic aerosols, topography and urbanization (Jin et al., 2020). A significant increasing trend in the frequency of extreme monthly and seasonal temperatures have been observed in the late 20th century and continued in the 21st century (Ren et al., 2017; Wen et al., 2019). This increase was mainly driven by a rapid rise in TMN or slow increase, slightly cooling of TMX in many regions across the world and China (Xie et al., 2019).
Negative anomalies in summertime maximum temperature, over eastern China during the 1980s, were attributed to a reduction in sunshine duration potentially as consequences of atmospheric anthropogenic aerosol loading (Zhu et al., 2020). Changes in cloud cover and soil evaporation could also influence the temperature variations (Wang et al., 2018). It is interesting to mention that the decreasing trend in cloud amount was observed during the same period. Increased aerosol loading due to fossil fuel combustion and the decrease in solar radiation was strongly correlated (He and Wang, 2020). Teixeira et al. (2013) using the climate model showed that one of the global hot spots of crop heat stress overlaps with critical agricultural regions of Eastern China (Teixeira et al., 2013). Previous reports also mentioned that agricultural production in this area might suffer significant economic losses due to climate change induced temperature anomalies (Luo and Lau, 2019).
Diurnal temperature range is one of the vital climate change indices. Asymmetric changes in TMX and TMN, driven mostly by changes in minimum temperatures occurred from 1951 to 2009. Narrowing trends in DTR is already reported at regional and global scales and projected to increase globally (Sun et al., 2019). However, the magnitude of asymmetry may significantly vary at regional and seasonal levels (Li et al., 2020). The above presented time trends in TMX and TMN observations suggested higher warming amplitude for TMN as compared to TMX and narrowing the DTR in the Jiangsu province is consistent with the observations for Yangtze River Delta (Yang et al., 2020), China (Jin et al., 2020) and global scale (Wang et al., 2018).
These changes were associated with the rapid pace of urbanization, increased aerosol loading and/or change in land use (He and Wang, 2020; Wen et al., 2019). In addition, non-climatic factors like population density, level of economic activity and energy utilization may also have a significant contribution. Rapid economic activity and urbanization of China in the past three decades made these factors more significant in the studied area (Li et al., 2020). The decreasing trend of RH was comparable with the weak positive or negative trend in the RH for Yangtze River Valley, reported earlier (Sun et al., 2019).
4.2 Spatiotemporal trends and anomalies in stress days
Stress days were derived from TMX and TMN, therefore consistent with the trends relevant to temperature extreme. The most robust frequency of stress days in Southern Jiangsu as compared to central Jiangsu as well as the weakest rate for the northern Jiangsu agreed with the earlier findings (Guan et al., 2015; Niu et al., 2018). Similarly, less frequent stress days at coastal stations were reported previously (Luo and Lau, 2019). High-intensity HDs, during the 1960s, has already been published earlier (Shi et al., 2019). Decreasing or stagnant activity of warm days as found in the present study support trend in the basins of the Yangtze (Guan et al., 2015; Shi et al., 2019). The warm day decreases in the mid-low Yangtze River are linked to increased summer rainfall (Wen et al., 2019). Khaliq et al. (2007) reported a similar trend for the HN, but an opposite trend for the HD with SHD in Southern Quebec, Canada (Khaliq et al., 2007). The observed differences might be attributed to spatial variations in climate change.
5 Conclusions
The primary purpose of this study was to highlight recent trends in the occurrence of stress days during rice RGP, as a proxy of heat-induced spikelet sterility. This study has presented evidence of more robust activity of daily minimum temperature, hot nights and severe hot days during rice RGP in the Jiangsu province. Nevertheless, different regions likely experience various degrees of high temperature-induced sterility. The varying results presented here indicate regional variations in the temperature extremes and stress days. Furthermore, these results suggest that the increasing trend of hot nights and severe hot days are likely much crucial for rice production in the province. The nights are getting warmer with time, which cannot be attributed to non-climatic factors, and may have a climatological signal. Crop duration and time of planting, for the single rice cropping pattern, prevailing in the province, need to be adjusted to avoid extreme heat events.
Funding
The authors acknowledge financial support for the Ph.D. of M.I.A. Rehmani by Higher Education Commission (HEC) of Pakistan. Financial support from Special fund for Agro-scientific Research in the Public Interest: Impact of climate change on agricultural production of China, (No. 200903003), The Fundamental Research Funds for Central Universities of China (No. KYT201005) and The National Key Technology Support Program of China (No. 2011BAD16B14) was helpful to conduct this study.
CRediT authorship contribution statement
Muhammad Ishaq Asif Rehmani: Conceptualization, Methodology, Software, Validation, Visualization, Data curation, Formal analysis, Writing - original draft preparation, Writing - review and editing, Project administration, Funding acquisition. Chengqiang Ding: Data curation. Ganghua Li: Data curation. Syed Tahir Ata-Ul-Karim: Data curation, Formal analysis. Adel Hadifa: Data curation. Muhammad Amjad Bashir: Data curation. Mohamed Hashem: Writing - review and editing. Saad Alamri: Writing - review and editing. Fahad Al-Zubair: Writing - review and editing. Yanfeng Ding: Conceptualization, Supervision, Project administration, Funding acquisition.
Acknowledgments
The authors extend their appreciation to the Deanship of Scientific Research, King Khalid University for publishing through research groups program under grant number R.G.P. 2/11/42.
Declaration of Competing Interest
The authors declare that they have no known competing financial interests or personal relationships that could have appeared to influence the work reported in this paper.
References
- Temperature thresholds for spikelet sterility and associated warming impacts for sub-tropical rice. Agric. For. Meteorol.. 2016;221:122-130.
- [Google Scholar]
- Resilience of rice (Oryza spp.) pollen germination and tube growth to temperature stress. Plant, Cell Environ.. 2016;39:26-37.
- [Google Scholar]
- Improving productivity of Australian wheat by adapting sowing date and genotype phenology to future climate. Clim. Risk Manage.. 2021;32:100300.
- [Google Scholar]
- Influence of temperature and solar radiation on grain yield and quality in irrigated rice system. Eur. J. Agron.. 2015;64:37-46.
- [Google Scholar]
- Extreme heat waves under 1.5 °C and 2 °C global warming. Environ. Res. Lett.. 2018;13(5):054006.
- [Google Scholar]
- Male Parent Plays More Important Role in Heat Tolerance in Three-Line Hybrid Rice. Rice Science. 2015;22:116-122.
- [CrossRef] [Google Scholar]
- He, Y., Wang, K., 2020. Variability in direct and diffuse solar radiation across China from 1958 to 2017. Geophysical Res. Lett., 47: e2019GL084570.
- The human imperative of stabilizing global climate change at 1.5°C. Science. 2019;365(6459):eaaw6974.
- [Google Scholar]
- Simulating the optimal growing season of rice in the Yangtze River Valley and its adjacent area, China. Agric. Forest Meteorol.. 1998;91(3-4):251-262.
- [Google Scholar]
- Breeding efforts to mitigate damage by heat stress to spikelet sterility and grain quality. Plant Prod. Sci.. 2016;19(1):12-21.
- [Google Scholar]
- Impact of variations in vegetation on surface air temperature change over the Chinese Loess Plateau. Sci. Total Environ.. 2020;716:136967.
- [Google Scholar]
- Southern Quebec (Canada) summer-season heat spells over the 1941–2000 period: an assessment of observed changes. Theor. Appl. Climatol.. 2007;88(1-2):83-101.
- [Google Scholar]
- Mechanisms and adaptation strategies to improve heat tolerance in rice. A review. Plants. 2019;8(11):508.
- [Google Scholar]
- Differential response of rice plants to high night temperatures imposed at varying developmental phases. Agric. For. Meteorol.. 2015;209-210:69-77.
- [Google Scholar]
- Continental scale surface air temperature variations: experience derived from the Chinese region. Earth Sci. Rev.. 2020;200:102998.
- [Google Scholar]
- Characteristics of summer heat stress in China during 1979–2014: climatology and long-term trends. Clim. Dyn.. 2019;53(9-10):5375-5388.
- [Google Scholar]
- Effect of long anther dehiscence on seed set at high temperatures during flowering in rice (Oryza sativa L.) Sci. Rep.. 2019;9:20363.
- [Google Scholar]
- Ensemble evaluation and projection of climate extremes in China using RMIP models. Int. J. Climatol.. 2018;38(4):2039-2055.
- [Google Scholar]
- Modelling temperature-compensated physiological rates, based on the co-ordination of responses to temperature of developmental processes. J. Exp. Bot.. 2010;61:2057-2069.
- [Google Scholar]
- Plant phenology and global climate change: current progresses and challenges. Glob. Change Biol.. 2019;25(6):1922-1940.
- [Google Scholar]
- Spatiotemporal analysis of diurnal temperature range: effect of urbanization, cloud cover, solar radiation, and precipitation. Climate. 2019;7(7):89.
- [Google Scholar]
- Diel- and temperature-driven variation of leaf dark respiration rates and metabolite levels in rice. New Phytol.. 2020;228(1):56-69.
- [Google Scholar]
- Yield and quality responses of two indica rice hybrids to post-anthesis asymmetric day and night open-field warming in lower reaches of Yangtze River delta. Field Crops Research. 2014;156:231-241.
- [CrossRef] [Google Scholar]
- An overview of mainland China temperature change research. J. Meteorolog. Res.. 2017;31(1):3-16.
- [Google Scholar]
- Satake, T., Yoshida, S., 1978. High temperature-induced sterility in indica rices at flowering. Japanese J. Crop Sci., 47: 6–17.
- Rice production and food security in Asian Mega deltas—A review on characteristics, vulnerabilities and agricultural adaptation options to cope with climate change. J. Agron. Crop Sci.. 2020;206:491-503.
- [Google Scholar]
- Changes in the temperature and precipitation extremes in China during 1961–2015. Quat. Int.. 2019;527:64-78.
- [Google Scholar]
- Interdecadal variation in the synoptic features of Mei-Yu in the Yangtze River Valley Region and relationship with the pacific decadal oscillation. J. Clim.. 2019;32:6251-6270.
- [Google Scholar]
- Global hot-spots of heat stress on agricultural crops due to climate change. Agric. For. Meteorol.. 2013;170:206-215.
- [Google Scholar]
- Allelic diversities in rice starch biosynthesis lead to a diverse array of rice eating and cooking qualities. Proceedings of the National Academy of Sciences.. 2009;106:21760-21765.
- [Google Scholar]
- Wang, J., Feng, J., Yan, Z., Chen, Y., 2020. Future Risks of Unprecedented Compound Heat Waves Over Three Vast Urban Agglomerations in China. Earth's Future. 8: e2020EF001716.
- Maximum and minimum soil surface temperature trends over China, 1965–2014. J. Geophys. Res.: Atmospheres. 2018;123:2004-2016.
- [Google Scholar]
- Global spatial distributions of and trends in rice exposure to high temperature. Sustainability.. 2019;11:6271.
- [Google Scholar]
- Wassmann, R., Jagadish, S.V.K., Heuer, S., Ismail, A., Redona, E., Serraj, R., Singh, R.K., Howell, G., Pathak, H., Sumfleth, K., 2009. Chapter 2 Climate change affecting rice production: the physiological and agronomic basis for possible adaptation strategies. In Advances in Agronomy, ed. D. L. Sparks, 59-122. Academic Press.
- Recent surface air temperature change over mainland china based on an urbanization-bias adjusted dataset. J. Clim.. 2019;32:2691-2705.
- [Google Scholar]
- Differential temporal asymmetry among different temperature variables’ daily fluctuations. Clim. Dyn.. 2019;53(1-2):585-600.
- [Google Scholar]
- Spatiotemporal variability of sunshine duration and influential climatic factors in mainland China during 1959–2017. Int. J. Climatol.. 2020;40(15):6282-6300.
- [Google Scholar]
- Modulations of surface thermal environment and agricultural activity on intraseasonal variations of summer diurnal temperature range in the Yangtze River Delta of China. Sci. Total Environ.. 2020;736:139445.
- [Google Scholar]
- Spatiotemporal patterns of paddy rice croplands in China and India from 2000 to 2015. Sci. Total Environ.. 2017;579:82-92.
- [Google Scholar]
- Dominant modes of interannual variability of extreme high-temperature events in eastern China during summer and associated mechanisms. Int. J. Climatol.. 2020;40(2):841-857.
- [Google Scholar]


