

Translate this page into:
Vitamin D and its influence in circulating trace minerals among Arab adults with or without adequate vitamin D levels
⁎Corresponding author at: at: Biochemistry Department, College of Science, King Saud University, Riyadh 11451, Saudi Arabia. aldaghri2011@gmail.com (Nasser M. Al-Daghri) ndaghri@ksu.edu.sa (Nasser M. Al-Daghri)
-
Received: ,
Accepted: ,
This article was originally published by Elsevier and was migrated to Scientific Scholar after the change of Publisher.
Peer review under responsibility of King Saud University.
Abstract
Objective
To compare and define the associations of circulating trace minerals with vitamin D among Arab adults with either vitamin D deficiency or optimum vitamin D levels.
Methods
This cross-sectional study involved 199 (101 males and 98 females) adult Saudi participants aged 47.7 ± 15.6 years divided into two groups [N = 120 with vitamin D deficiency (25(OH)D < 50 nmol/L), and N = 79 with adequate vitamin D (≥75 nmol/L). Anthropometrics was measured and biochemical parameters, such as glucose, lipid profile, trace elements (calcium, phosphate and magnesium) were measured using an automated biochemical analyzer. Serum copper, iron and total iron binding capacity (TIBC) were measured using a colorimetric ferrozine-based assay. Serum 25(OH)D and 1,25(OH)2D3 were measured using standardized immunoassays.
Results
There is a significant difference in TIBC (p = 0.02) and transferrin saturation (p = 0.004) and no significant difference in copper and iron concentration between the two groups. High level of 25-hydroxy vitamin D in the vitamin D deficient group was found to be significantly associated with low levels of copper. in the vitamin D deficient group, 25-hydroxyvitamin D was inversely associated with serum glucose levels (R = −0.22, P = 0.046), and positively associated with age (r = 0.23, p = 0.03) and in the vitamin D sufficient group, 25-hydroxyvitamin D was positively associated with serum HDL cholesterol levels (R = 0.23, p = 0.02). The data showed that vitamin D deficient group had a higher prevalence of low HDL-cholesterol levels than the vitamin D sufficient group. (78.2% versus 66.1%, respectively; p = 0.04).
Conclusion
Circulating trace minerals are influenced by vitamin D status and are altered among individuals who are vitamin D deficient, reaffirming the need to correct vitamin D status to prevent other micronutrient imbalances in adults. Whether these associations are compensatory needs to be investigated prospectively.
Keywords
Vitamin D
Iron
Trace minerals
Arab adults
Diet

1 Introduction
Vitamin D has achieved enormous attention in the last decade in the areas of medical research and human health, given its essential extra-skeletal functions and high prevalence of vitamin D deficiency globally, including Saudi Arabia (Al-Daghri, 2021). Vitamin D deficiency has been consistently linked to major chronic and non-communicable diseases such as diabetes and cardiovascular disease to name a few and as such, correction of vitamin D status has been encouraged as a preventive and adjuvant management in various disorders (Al-Daghri, 2021; Al-Daghri, 2019; Al-Musharaf, 2018; Al-Shahwan, 2015; Ansari, 2020; Nasser et al., 2010; Sabico, 2021). There is also clear evidence that vitamin D doesn’t function in isolation, as reduced vitamin D function and inadequate minerals concentration can have synergistic and collectively opposing functions on biological actions with major health effects (Schwalfenberg and Genuis, 2015). In fact, enhanced intestinal uptake and proper absorption of essential minerals like iron, calcium, phosphate, magnesium, zinc and copper have also been observed to be influenced by circulating vitamin D (25(OH)D) and/or its metabolites (Anderson, 2017). Under normal circumstances, these trace elements are metabolized in the liver and kidney, similar to vitamin D, where the liver (main source for 25-hydroxylation) converts vitamin D to 25(OH)D, while the kidney (main source for 1α-hydroxylation) converts 25(OH)2D to 1, 25(OH)D3 and 24, 25(OH)2D (Bikle and Vitamin, 2000).
For iron, there are numerous likely mechanisms that may justify its direct association with 25(OH)D concentrations. One of these mechanisms involve hepcidin which controls iron absorption, which in turn, increases vitamin D, which then decreases hepcidin, forming a complex feedback system (Azizi-Soleiman, 2016). Many cross-sectional studies have suggested a relationship between low 25(OH)D concentrations and reduced iron status. In a study done on 219 healthy Caucasian female athletes, 32% of the vitamin D deficient group had iron deficiency compared to 11% of vitamin D sufficient group. Conversely, in the iron deficient group, 75% of them had vitamin D deficiency compared to only 48% in the vitamin D sufficient group (Malczewska-Lenczowska, 2018).
For other trace minerals, vitamin D appears to support serum copper, phosphate and magnesium homeostasis since its closely interconnected with calcium and skeletal regulation (Rausch and Foller, 2022; Watts, 1989; Zittermann, 2013). Given the high prevalence of micronutrient deficiencies in the Middle East and Saudi Arabia in particular that is parallel to vitamin D deficiency (Hwalla, 2017); this present cross-sectional analysis targets to explore the associations of these trace minerals with 25(OH)D and 1,25-dihydroxyvitamin D3 (1,25(OH)2D3) in an adult Arab population whose vitamin D status are either optimum or deficient. To the best of our knowledge, there are no Arab population-based studies that have assessed the association between serum iron and copper with levels of 25(OH)D and 1,25(OH)2D3.
2 Materials and methods
2.1 Study subjects
In the present case-control study, demographic and clinical information of 199 Saudi adults aged 18 and above were taken from the database of the Chair for Biomarkers of Chronic Diseases (CBCD) in Saudi Arabia. In brief, these individuals were part of a capital-wide survey in cooperation with the Ministry of Health and the Ministry of Education (Al-Daghri, 2011; Al-Daghri, 2015). For the purpose of this study, participants were randomly chosen, age- and sex-matched based on their vitamin D status as defined locally [vitamin D deficient (25(OH) D below 50 nmol/l as group 1), and optimum vitamin D (25(OH)D ≥ 75 nmol/l as group 2)] (Al-Saleh, 2020). Exclusion criteria included those who were pregnant at the time of data collection, those taking vitamin D supplements, active history of chronic diseases such as diabetes, hypertension, chronic kidney or liver disease and heart disease. Consent was provided prior to inclusion. Approval was obtained from the Ethics Committee of the College of Science Research Center, King Saud University, Riyadh, Saudi Arabia (Ref No. 15/0502/IRB; Project No. E-15-1667). All participants completed a questionnaire on previous medical records and overall health status. All experiments and methods were performed in accordance with relevant guidelines and regulations.
2.2 Anthropometry, blood collection and biochemical assessment
Anthropometric and clinical information were retrieved from the CBCD database. All participants had their anthropometric measurements and fasting blood extraction at a designated primary care center. Anthropometrics included weight (kg) and height (cm) using a standard scale (Digital Pearson Scale, ADAM Equipment Inc., Oxford, CT, USA). Waist (cm) and hip circumferences (cm) were measured using a non-stretchable tape. Mean systolic and diastolic blood pressure were assessed using a standardized mercurial sphygmomanometer. Body mass index (BMI) was estimated by dividing weight (kg) by height (m2). Around 10 ml intravenous fasting blood samples were extracted from each participant. Biochemical parameters, such as glucose and lipid profile (triglycerides, total cholesterol and HDL-cholesterol) were measured using an automated biochemical analyzer (Konelab, Espoo Finland) as assessed previously (Al-Daghri, 2014). Trace minerals including calcium, phosphate and magnesium were also assessed using the biochemical analyzer (Konelab, Espoo Finland). LDL-cholesterol was determined using Friedwald equation (Friedewald et al., 1972). Iron and total iron binding capacity (TIBC) was determined using a Colorimetric ferrozine-based assay in serum samples using a Spectra Max M5 Multi-Detection Reader as measured previously (Masoud, 2018; Masoud, 2020). Transferrin saturation (%) was calculated as serum iron (µg/L)/total iron-binding capacity (TIBC) (µg/L) × 100. Serum copper was measured using an atomic absorption spectroscopy ASC-7000 autosampler. Serum 25(OH) D and 1,25(OH)2D3 were determined using Liaison XL-immunoassay (DiaSorin, Italy) in a DEQAS-certified laboratory (CBCD, KSU).
2.3 Statistical analysis
Data analysis was done using the SPSS 22.0 (SPSS Inc., Chicago, Illinois, USA). Data was presented as a mean ± standard deviation for continuous normal variables, while median and interquartile range were used to present continuous non-normal variables. Frequencies and percentages were used to present categorical variables. Independent student’s T-test was used to compare means between groups for normally distributed data, while Mann-Whitney U Test was used for non-normal data. A partial correlation and analysis of covariance were used to control for the possible effects of age, BMI, and triglycerides. All non-normal variables were transformed prior to parametric testing. Lastly, stepwise linear regression analysis was done to determine significant predictors for the different trace elements measured. A p-value of ≤0.05 was considered significant.
Post-hoc analysis was done using G*power Calculator for trace element effect size (copper) between deficient vs adequate vitamin D group = 0.378, n1 = 120 and n2 = 79 α err probability = 0.05 and the actually power achieved = 0.829.
3 Results
A total of 199 Saudi adults (101 males and 98 females, mean age 47.7 ± 15.6 years, mean BMI 29.1 ± 6.1 kg/m2) were included in the present study. Table 1 shows the clinical characteristics of age-, sex- and BMI-matched participants who either had vitamin D deficiency (N = 120) or optimum vitamin D levels (N = 79). Participants with optimum vitamin D levels had significantly higher fasting glucose levels than the deficient group (p = 0.003). Among the trace minerals, both serum Mg and Cu were significantly lower in the optimum group than the deficient group (p-values 0.047 and 0.025, respectively). In contrast, TIBC was significantly higher in the deficient group as compared to the optimum group (p = 0.021). Transferrin saturation was higher in the optimum group than the deficient but this was borderline significant (p = 0.078). The rest of the anthropometrics, lipids and trace minerals, including 1,25(OH)2D3 were not significantly different (Table 1). Note: Data presented as Mean ± SD for normal variables while Median (25st – 75th) percentile for non-normal variables; p-values <0.05 considered significant.
Parameters
All
Vitamin D Status
Deficient < 50 nmol/L
Adequate ≥ 75 nmol/L
P-Value
N
199
120
79
M/F
101/98
55/65
46/33
Age (years)
47.7 ± 15.6
46.0 ± 15.7
50.2 ± 15.2
0.06
BMI (kg/m2)
29.1 ± 6.1
29.0 ± 6.4
29.2 ± 5.7
0.83
Waist-Hip Ratio
0.91 ± 0.10
0.91 ± 0.09
0.92 ± 0.09
0.17
Systolic BP (mmHg)
124.4 ± 15.1
123.2 ± 15.3
126.3 ± 14.8
0.19
Diastolic BP (mmHg)
77.9 ± 9.9
78.0 ± 9.4
77.9 ± 10.9
0.94
Glucose (mmol/l)
6.04 ± 1.7
5.8 ± 1.5
6.5 ± 1.8
0.003
T. Cholesterol (mmol/l)
5.11 ± 1.2
5.10 ± 1.2
5.20 ± 1.2
0.55
HDL-Chol (mmol/l)
1.01 ± 0.3
1.00 ± 0.3
1.03 ± 0.3
0.40
LDL-Chol (mmol/l)
3.28 ± 1.06
3.27 ± 1.1
3.30 ± 1.05
0.84
Triglycerides (mmol/l)#
1.59 (1.2–2.2)
1.49 (1.0–2.1)
1.63 (1.2–2.4)
0.89
Phosphate (mmol/l)
1.17 ± 0.3
1.17 ± 0.3
1.20 ± 0.2
0.94
Corrected Calcium (mmol/l)
2.82 ± 0.8
2.86 ± 0.8
2.72 ± 0.8
0.39
Magnesium (mmol/l)
0.69 ± 0.14
0.71 ± 0.13
0.65 ± 0.20
0.047
Copper (mmol/l)
13.4 ± 5.0
13.8 ± 5.3
11.9 ± 3.5
0.025
Iron (mg/l)
0.97 (0.5–2.1)
1.71 (0.5–2.5)
0.84 (0.7–1.4)
0.32
TIBC (mg/l)#
4.6 (4.1–5.1)
4.6 ± 0.7
3.9 ± 0.9
0.02
TSAT (%)
12.2 ± 7.9
11.0 ± 6.2
19.6 ± 12.8
0.08
25(OH) D (nmol/l)
57.5 ± 43.7
24.0 ± 9.4
108.3 ± 19.8
<0.001
1, 25 (OH)2D3 (pg/ml)
52.4 ± 21.9
52.6 ± 22.6
51.8 ± 20.4
0.84
Table 2 shows the bivariate associations of 25(OH)D and the metabolic parameters assesses, including trace minerals and iron indices according to vitamin D status. In the vitamin D deficient group 25(OH) D was positively associated with age (r = 0.23, p < 0.05) and inversely associated with serum glucose levels (r = −0.22, p < 0.05). A significant inverse association was also observed between 25(OH)D and circulating Mg (r = −0.26; p < 0.05) and Cu (r = -0.21; p < 0.05). Among participants with optimum 25(OH)D levels, 25(OH) D was positively associated with serum HDL cholesterol levels (r = 0.23, p = 0.015). All other parameters recorded no significant association with 25(OH)D in both groups (Table 2). Note: Data presented as coefficient (R); * denotes significance at 0.05 level; ** denotes significance at 0.01 level.
Parameters
Vitamin D Status
Deficient
<50 nmol/lAdequate
≥75 nmol/l
N
120
79
Age (years)
0.23*
0.01
Body Mass Index (kg/m2)
−0.15
0.04
Waist-Hip Ratio
0.07
0.13
Systolic BP (mmHg)
0.06
−0.02
Diastolic BP (mmHg)
−0.04
0.07
Glucose (mmol/l)
−0.22*
0.13
Total Cholesterol (mmol/l)
0.16
−0.07
HDL Cholesterol (mmol/l)
−0.10
0.23*
LDL Cholesterol (mmol/l)
0.10
−0.10
Triglycerides (mmol/l)
0.10
−0.17
Iron (mg/l)
0.08
−0.09
Total Iron Binding Capacity (mg/l)
0.14
−0.34
Transferrin Saturation (%)
−0.10
0.38
Phosphate (mmol/l)
0.13
0.03
Corrected Calcium (mmol/l)
−0.46*
−0.21
Magnesium (mmol/l)
−0.35*
−0.18
Copper (mmol/l)
−0.21*
−0.10
The association of 25(OH)D with the different trace minerals are shown in Fig. 1. Serum Mg was inversely associated with 25(OH)D among vitamin D deficient subjects (r = −0.35; p = 0.02, Fig. 1A) as well as with 1,25(OH)2D3 (r = −0.37; p = 0.016, Fig. 1C). There was also a modest inverse association between circulating copper and 25(OH)D among vitamin D deficient subjects (r = −0.21; p = 0.04, Fig. 1C) as well as corrected calcium in vitamin D sufficient subjects (r = −0.46; p < 0.001, Fig. 1D). No significant associations were elicited when stratified according to sex.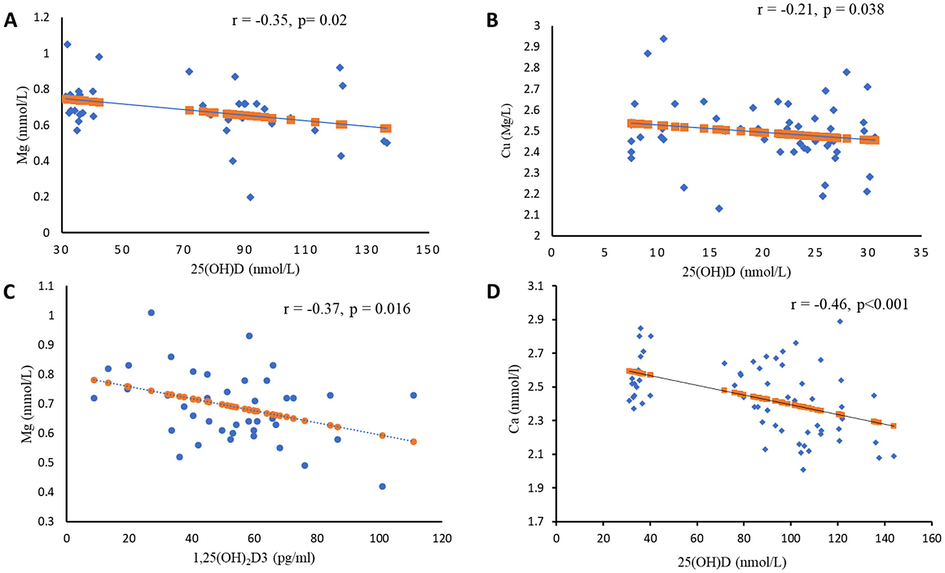
Stepwise linear regression was done to determine the significant predictors of the different trace minerals studied. Using the different trace mineral as dependent variable and anthropometrics, lipids, glucose, albumin and iron indices as independent variables, it was found out that for Mg, glucose was the most significant predictor, explaining 12.2% of the variance perceived (p = 0.038). Serum 25(OH)D was the most significant predictor for circulating Cu levels, explaining 16.7% of the variance (p = 0.018). For serum iron, WHR predicted 17.1% of the variance (p = 0.016).
4 Discussion
This present cross-sectional analysis assessed the differences and associations of the different trace minerals, including iron and its indices with circulating vitamin D among Arab adults with vitamin D deficiency versus vitamin D adequacy. The results showed that, at least among Arab adults, most of the significant associations are affected only once vitamin D status has reached the deficiency level, highlighting that vitamin D deficiency may alter trace mineral circulation in the body. Among these associations include the inverse association with Mg, Cu and Ca. Furthermore, no associations were found between iron and its indices with 25(OH)D regardless of vitamin D status. While these findings do not directly contradict our initial observations in adolescents where 25(OH)D supplementation modestly reduces iron indices and 25(OH)D is inversely associated with TIBC in particular (Masoud, 2018, 2020), it shows that that the association between iron and vitamin D are influenced by age, since no association were elicited in adults.
The affirmative significant difference in the TIBC concentration and the percentage of transferrin saturation between the vitamin D deficient and vitamin D adequate group shown in this present study, goes parallel with a study done in New Delhi, India where the vitamin D deficient group had lower percentage of transferrin saturation and elevated levels of total iron binding capacity as compared to the non-deficient group (Sharma et al., 2015). While this may be true, another studies major outcome was that vitamin D supplementation had no effect on blood iron, hemoglobin, and transferrin saturation (Madar, 2016). Considering the undesirable outcomes of this clinical trial, it seems that the capacity of vitamin D supplementation in raising stores of iron in the body is reduced in people with metabolic disorders (Masoud, 2018).
The likely explanation for the association between transferrin saturation and TIBC with vitamin D could be that red blood cells that express the receptor for vitamin D, can stimulate the growth and production of erythroid progenitor cells. Hence, vitamin D deficiency could disturb erythropoiesis and cause anemia. Likewise, it has been recognized that hepcidin, a peptide hormone produced by the liver, controls the intestinal uptake and circulation levels of iron by inhibiting the release of cellular iron that’s mediated by the ferroportin transporters. A strong regulator of the hepcidin-ferroportin axis is vitamin D. Thus, deficiency of vitamin D could distress the homeostasis of hepcidin, which might result in a reduction in hemoglobin synthesis and upsurge the occurrence of anemia (Sharma et al., 2015).
Vitamin D is one of the synergistic vitamins, in which copper deficiency vitamin D need is enhanced. When supplemented, it can help in maintaining copper homeostasis. For instance, enhanced adrenal corticosteroid synthesis declines copper retention in the body and interferes with vitamin D metabolism. On the other hand, vitamin D can hinder the effect of enhanced corticosteroid synthesis, thus bettering copper retention in the body (Azizi-Soleiman, 2016). It has been established that adequate vitamin D is associated not only with improved absorption of trace minerals (calcium, magnesium, iron, phosphate, zinc, and copper), but higher levels also enhance absorption of toxic elements (aluminum, cadmium, cobalt, lead and radioactive isotopes such as cesium and strontium) (Schwalfenberg and Genuis, 2015).
One study was conducted on 51 postmenopausal women who had either osteopenia or osteoporosis. Serum copper levels were significantly lower than the normal range in all woman included in the study (Mahdavi-Roshan et al., 2015). Deficiency of copper results suppressed bone growth and ultimately leads to osteoporosis (Razmandeh, 2014). While this may be true, circulatory levels of copper was assessed in postmenopausal women with normal BMD, osteopenia and osteoporosis. Results recorded similar copper levels in all three groups (Mutlu, 2007).
This current study recorded no association between vitamin D status and iron levels and this goes in accordance with another study that aimed to assess the relationship between serum vitamin D, iron indices and cardio-metabolic parameters in a cohort of Saudi youths (Masoud, 2020). However, it was contradicting to a systematic review that analyzed three cross sectional studies done in Korea, in which results showed a positive association between vitamin D status iron levels. This contradiction is maybe due to the difference in ethnicity (Lee, 2015).
The precise mechanism that links vitamin D deficiency with iron deficiency is not fully understood. One mechanism suggests inhibition of specific inflammatory pathways through vitamin D. Both 25(OH)D and 1,25(OH)2D3 decrease synthesis of inflammatory cytokine by human periodontal ligament cells. In chronic renal disorders; inflammation and anemia have a potent association with vitamin D deficiency. However, the requirement for erythropoietin was reduced after supplementation of vitamin D (Friedewald et al., 1972). Likewise, anemia can sequentially lead to vitamin D deficiency. Intestinal absorption of vitamin A and fat is disturbed in iron deficiency. Similar to vitamin A, vitamin D is a fat-soluble vitamin its absorption may also be disturbed. Iron is also a cofactor for 25(OH)D 1-alpha-hydroxylase, (CYP27B1) which is an important enzyme in the conversion of 25(OH)D to 1,25(OH)2D3 (Bikle and Vitamin, 2000). Therefore, deficiency of iron may suppress vitamin D activation triggering its deficiency (Schwalfenberg and Genuis, 2015).
Finally, serum levels of 25(OH) D has been linked to obesity, high blood pressure, heart complications, diabetes and mortality. It has also been linked to poor lipid profile, perhaps clarifying the association with heart complications and mortality. Many studies show that low 25(OH)D is linked to low high-density lipoprotein cholesterol (HDL-C) and elevated triglycerides (Schwetz, 2018).
The present cross-sectional study showed a significant positive association between vitamin D status and HDL-cholesterol, but only in the vitamin D adequate group. These outcomes add to the suggestion that serum lipid profiles associate with levels of 25(OH) D, an outcome that has been described in previous studies (Al-Daghri, 2021; Nasser et al., 2010; Wang, 2016; Al-Daghri, 2016).
The authors acknowledge some limitations. First is the cross-sectional design which limits causality. Second, important variables such as dietary intake and physical activity which can substantially affect circulating trace minerals were not taken into consideration. Caution is needed in the interpretation of the results given the potential biases that can arise from the design and covariates that were not included in the model due to sample size limitations.
5 Conclusion
In conclusion, circulating trace minerals are affected by vitamin D status among Arab adults, with most associations observed only among vitamin D deficient participants. The study adds to the growing evidence that these trace minerals, including iron indices, are modestly affected by vitamin D status. Management of vitamin D deficiency should take into consideration these micronutrients to achieve balance and overall wellbeing.
Acknowledgement
The authors are grateful to the Deanship of Scientific Research, King Saud University for funding this research project through Vice Deanship of Scientific Research Chairs. The authors also thank the volunteers and the research team from different primary care centers for the recruitment of subjects.
Authors’ contributions
All authors contributed to the study conception and design. Method implementation and optimization, analysis, and data evaluation were performed by HA. The first draft of the manuscript was written by SY. NA and MNKK commented on previous versions of the manuscript. All authors read and approved the final submitted manuscript.
Data availability
The data used to support the findings of this study are included within the article.
Conflict of interest
All authors have NO conflicts of interests to declare.
References
- Diabetes mellitus type 2 and other chronic non-communicable diseases in the central region, Saudi Arabia (Riyadh cohort 2): a decade of an epidemic. BMC Med.. 2011;9:76.
- [Google Scholar]
- Does visceral adiposity index signify early metabolic risk in children and adolescents?: Association with insulin resistance, adipokines, and subclinical inflammation. Pediatr. Res.. 2014;75(3):459-463.
- [Google Scholar]
- Vitamin D deficiency and cardiometabolic risks: A juxtaposition of Arab adolescents and adults. PLoS ONE. 2015;10(7):e0131315
- [Google Scholar]
- Calculated adiposity and lipid indices in healthy Arab children as influenced by vitamin D status. J. Clin. Lipidol.. 2016;10(4):775-781.
- [Google Scholar]
- Efficacy of vitamin D supplementation according to vitamin D-binding protein polymorphisms. Nutrition. 2019;63–64:148-154.
- [Google Scholar]
- Decreasing prevalence of vitamin D deficiency in the central region of Saudi Arabia (2008–2017) J. Steroid Biochem. Mol. Biol.. 2021;212:105920
- [Google Scholar]
- Vitamin D deficiency prevalence and predictors in early pregnancy among Arab women. Nutrients. 2018;10(4)
- [Google Scholar]
- Diagnosis and management of osteoporosis in postmenopausal women in Gulf Cooperation Council (GCC) countries: consensus statement of the GCC countries' osteoporosis societies under the auspices of the European Society for Clinical and Economic Aspects of Osteoporosis and Osteoarthritis (ESCEO) Arch Osteoporos. 2020;15(1):109.
- [Google Scholar]
- Effects of 12-month, 2000IU/day vitamin D supplementation on treatment naive and vitamin D deficient Saudi type 2 diabetic patients. Saudi Med. J.. 2015;36(12):1432-1438.
- [Google Scholar]
- Vitamin D activity and metabolism in bone. Curr. Osteoporos. Rep.. 2017;15(5):443-449.
- [Google Scholar]
- Vitamin D supplementation is associated with increased glutathione peroxidase-1 levels in Arab adults with prediabetes. Antioxidants (Basel). 2020;9(2)
- [Google Scholar]
- Effects of iron on vitamin D metabolism: a systematic review. Int. J. Prev. Med.. 2016;7:126.
- [Google Scholar]
- Bikle, D.D., Vitamin D: Production, Metabolism and Mechanisms of Action, in Endotext, K.R. Feingold, et al., Editors. 2000: South Dartmouth (MA).
- Estimation of the concentration of low-density lipoprotein cholesterol in plasma, without use of the preparative ultracentrifuge. Clin. Chem.. 1972;18(6):499-502.
- [Google Scholar]
- The prevalence of micronutrient deficiencies and inadequacies in the middle east and approaches to interventions. Nutrients. 2017;9(3)
- [Google Scholar]
- Low vitamin D levels are associated with both iron deficiency and anemia in children and adolescents. Pediatr. Hematol. Oncol.. 2015;32(2):99-108.
- [Google Scholar]
- Effect of vitamin D3 supplementation on iron status: a randomized, double-blind, placebo-controlled trial among ethnic minorities living in Norway. Nutr. J.. 2016;15(1):74.
- [Google Scholar]
- Copper, magnesium, zinc and calcium status in osteopenic and osteoporotic post-menopausal women. Clin. Cases Miner Bone Metab.. 2015;12(1):18-21.
- [Google Scholar]
- The association between iron and Vitamin D status in female elite athletes. Nutrients. 2018;10(2)
- [Google Scholar]
- Vitamin D supplementation modestly reduces serum iron indices of healthy Arab adolescents. Nutrients. 2018;10(12)
- [Google Scholar]
- The association between iron and vitamin D status in Arab adolescents. Public Health Nutr.. 2020;23(7):1208-1213.
- [Google Scholar]
- Magnesium, zinc and copper status in osteoporotic, osteopenic and normal post-menopausal women. J. Int. Med. Res.. 2007;35(5):692-695.
- [Google Scholar]
- Nasser M. Al-Daghri, O.S.A.-A., Majed S. Alokail, Khalid M Alkharfy, Mansour Yousef, Hesham M. Nadhrah, Abdulaziz Al-Othman, Yousef Al-Saleh, Shaun Sabico, George P. Chrousos, 2010. Hypovitaminosis D and Cardiometabolic Risk Factors among Non-obese Youth. Central Eur. J. Med., 752–757.
- The regulation of FGF23 under physiological and pathophysiological conditions. Pflugers Arch.. 2022;474(3):281-292.
- [Google Scholar]
- Association of Zinc, Copper and Magnesium with bone mineral density in Iranian postmenopausal women - a case control study. J. Diabetes Metab. Disord.. 2014;13(1):43.
- [Google Scholar]
- Effects of a 2-week 5000 IU versus 1000 IU vitamin D3 supplementation on recovery of symptoms in patients with mild to moderate Covid-19: A randomized clinical trial. Nutrients. 2021;13(7)
- [Google Scholar]
- Vitamin D, essential minerals, and toxic elements: exploring interactions between nutrients and toxicants in clinical medicine. ScientificWorldJournal. 2015;2015:318595
- [Google Scholar]
- Vitamin D supplementation and lipoprotein metabolism: A randomized controlled trial. J. Clin. Lipidol.. 2018;12(3):588-596 e4.
- [Google Scholar]
- The role of 25-hydroxy vitamin D deficiency in iron deficient children of North India. Indian J. Clin. Biochem.. 2015;30(3):313-317.
- [Google Scholar]
- The associations of serum lipids with vitamin D Status. PLoS ONE. 2016;11(10):e0165157
- [Google Scholar]
- Magnesium deficit? Overlooked cause of low vitamin D status? BMC Med.. 2013;11:229.
- [Google Scholar]


