

Vitamin C encapsulation by a gelation method using deacetylated glucomannan as a matrix
⁎Corresponding author. dhwardhani@che.undip.ac.id (Dyah H. Wardhani),
-
Received: ,
Accepted: ,
This article was originally published by Elsevier and was migrated to Scientific Scholar after the change of Publisher.
Peer review under responsibility of King Saud University.
Abstract
Encapsulation is a promising method for preventing the interaction of an active agent with the environment. Efficacious encapsulation relies on the compatibility of the active compound and the encapsulant. As an active agent, vitamin C is easily degraded due to oxidation, high temperature, and other extreme environmental conditions, hence it requires protection. Glucomannan has the potential to provide vitamin C matrix encapsulation. However, the glucomannan needs to be modified to optimize its compatibility with vitamin C. In this research, glucomannan was modified using Na2CO3. This study aimed to determine the impact of the deacetylation process in encapsulating vitamin C using a gelation method. The loading capacity of vitamin C was in line with the degree of deacetylation. The highest degree of deacetylation (87.95%) allowed loading 84.9% of vitamin C. The functional groups, morphological surface, and particle distribution were modified due to the deacetylation and encapsulation processes. Release of vitamin C from deacetylated glucomannan was determined in two pH solutions, i.e., pH 1.2 and 6.8 solutions. The Korsmeyer–Peppas model was fitted to the release of vitamin C from deacetylated glucomannan at pH 1.2 (R2 > 0.892) and at pH 6.8 (R2 > 0.772). This study suggested the strong potential of deacetylated glucomannan as an encapsulating agent for vitamin C using a gelation method.
- ANOVA
analysis of variance
- DD
degree of deacetylation
- DGM
deacetylated glucomannan
- FTIR
Fourier-transform infrared spectroscopy
- IR
infrared
- LC
loading capacity
- M
molarity
- N
normality
- SEM
scanning electron microscope
- UV–Vis
ultraviolet visible
Abbreviations
1 Introduction
Vitamin C is an essential nutrient for the human body. It supports the immune system and plays a role as an antioxidant compound that neutralizes toxins and free radicals in the blood. Vitamin C is available in fruit and vegetables. According to Sherwood (2016), as much as 20–120 mg/day of vitamin C is actively absorbed in the small intestine. Vitamin C, like other vitamins, is sensitive and can be degraded in extreme environmental conditions such as high temperatures and extreme pH (Katouzian & Jafari, 2016). These conditions which applied in many food preparations decreased the antioxidant activity of vitamin C in processed foods. (Khalid et al., 2014). To deliver into an absorption site, this vitamin also needs protection and controlled release to optimize the absorption level in the human body its (Vranić & Uzunović, 2009). One of the proposed methods to minimize the degradation of vitamin C as well as to deliver it to the right site is encapsulation (Katouzian & Jafari, 2016).
Encapsulation is a process that entraps an active compound in other substances to increase the compound’s resistance to denaturation. Encapsulation protects the active compound from degradation by reducing its exposure to its environment (Ray et al., 2016). Moreover, encapsulation can deliver and control the release of the active compound at a specific site (Ankit et al., 2011). Several materials have been successfully applied as an encapsulant matrix, including glucomannan. Glucomannan is a water-soluble polysaccharide composed of d-mannose and d-glucose units linked by β-1–4 glycoside bonds. It has acetyl groups at C-6, which is responsible to glucomannan’s solubility in water (Chokboribal et al., 2015). This solubility hinders glucomannan’s use as an encapsulant using a gelation method, which requires high gelation compounds. Hydrogen bonds are considered as the main interactions responsible for gel formation (Solo-de-Zaldivar et al., 2014). Deacetylation using alkaline solutions such as NaOH, KOH, and Ca(OH)2 has been performed to improve gel formation (Pan et al., 2011). Du et al. (2012) conducted the deacetylation process using various Na2CO3 concentrations and obtained deacetylated glucomannan (DGM) with various degrees of deacetylation (DD). Ulya et al. (2019) reported a positive correlation between DD and the encapsulation efficiency of iron using glucomannan . The study of DGM as an encapsulant of vitamin C and its encapsulation performance has not yet been investigated. Therefore, this study was conducted to examine the effect of DD on the properties of encapsulated vitamin C including its release from the matrix.
2 Materials and methods
2.1 Materials
Glucomannan of Amorphophallus oncophillus flour was obtained from a local seller in Madiun (Indonesia), which was purified following Wardhani et al. (2016) and resulted in 91% purity. Ethanol (96%) was purchased from PT Brataco Chemika (Indonesia), while Na2CO3, ascorbic acid to represent vitamin C, KOH, HCl, phosphate buffer, CaCl2, and other chemicals were bought from Merck (Germany).
2.2 Glucomannan deacetylation
DGM was obtained heterogeneously following the previous study (Wardhani et al., 2018). Ten milliliters of ethanol (75%) were used to dissolve Na2CO3 to give 0.4 M under 100 rpm continuous magnetic stirring. After complete dissolution, 10 g of glucomannan was dispersed gently. The deacetylation was conducted to obtain various DD by varying deacetylation periods (2, 4, 8, 16, and 28 h) at room temperature and 60 °C. The DGM was collected using Whatman no. 42 filter paper and washed three times using 50 mL of 50, 70, and 96% ethanol, subsequently. The final DGM was put in a desiccator at room temperature for drying.
2.3 Degree of deacetylation
DD was determined following Zhang et al. (2015) with slight modification. Five grams of DGM were placed in a 250 mL Erlenmeyer flask together with 50 mL of ethanol (75%) under continuous stirring at 50 °C for 30 min, followed with adding KOH (5 mL, 0.5 M). This reaction was done for 48 h reaction. The excess alkali on the mixture was back titrated with 0.1 M HCl using phenolphthalein indicator. DD was determined as in Equation (1).
where ωo = acetyl content of the native glucomannan, ω = acetyl content of DGM, Vo = volume HCl for native glucomannan, V1 = volume HCl for DGM, V2 = volume HCl for the blank, NHCl is the normality of the HCl, Macetyl = 43 g/mol, and m (g) is the sample mass to be titrated.
2.4 Encapsulation of vitamin C
Encapsulation of vitamin C was conducted based on the method of Wang and He (2002). Vitamin C (200 mg) and 5% (w/v) DGM were placed in a 50 mL volumetric flask and topped up with distilled water. This solution was dropped into 200 mL CaCl2 solution (0.2 M, pH 5) using a 1 mL needled syringe from 10 cm above the liquid surface. After an hour, the formed beads were collected and vacuum-dried to obtain encapsulated vitamin C.
2.5 Functional groups, morphology, and particle size distribution
Identification of infrared (IR) spectra of the samples was performed using a Perkin Elmer Spotlight 200 (PerkinElmer Inc., US). Absorbance data of each sample were taken in the wavenumber range of 4000–400 cm−1. Samples of native glucomannan, DGM, and encapsulated vitamin C were captured using a Phenom ProX Desktop Scanning Electron Microscope (SEM) (Thermo Fisher ScientificTM, US) to reveal the morphological changes caused by the deacetylation and encapsulation processes. Diameter of 30 particles of each sample from the same SEM images magnification was determined using ImageJ image analysis software (Version 1.50i) (Barreto et al., 2019). The particle size distribution was presented as histograms which created using Sigmaplot 14.0 software.
2.6 Loading capacity
Loading capacity (LC) was determined based on the method of Corrêa-Filho et al. (2019). LC of encapsulation was expressed as the mass of entrapped vitamin C per mass of particles (Equation (4)).
Meanwhile, the mass of entrapped vitamin C was determined following the method of Desai et al. (2006) using a UV–Vis spectrophotometer. Encapsulated vitamin C (25 mg) was dissolved in 100 mL 0.1 N HCl. After 30 min, this solution was centrifuged at 2,300 g for 20 min (Hettich EBA 200, Germany) prior to absorbance reading at 244 nm (Shimadzu UV mini-1240, Japan). The mass of vitamin C was determined from the standard curve.
2.7 Vitamin C release and the models
The release of vitamin C was conducted in two solutions, i.e., HCl solution (pH 1.2) and phosphate buffer solution (pH 6.8). Encapsulated vitamin C (6 mg) was dissolved in 20 mL of each solution under stirring at 37 °C. This solution was centrifuged for vitamin C determination as explained in Section 2.6.
Two models were proposed to describe the release of vitamin C from DGM beads, i.e., Higuchi and Korsmeyer–Peppas. The Higuchi and Korsmeyer–Peppas equations are expressed as Equations (5) and (6), respectively:
where
2.8 Statistical analysis
The DD and release data were performed in triplicates and expressed as means ± standard deviation. One-way analysis of variance (ANOVA) was conducted to evaluates the significant differences between sample means, with significant level being considered at p < 0.05. Results obtained were analyzed using the Statistical Package for the Social Sciences (SPSS) software 16.0 for Windows (SPSS Inc. Chicago, USA).
3 Results and discussion
This work was conducted in two stages, i.e., deacetylation and encapsulation. The deacetylation of glucomannan was performed using Na2CO3 heterogeneously in ethanol which allowed to use higher glucomannan concentrations in the reaction. Performance of this DGM as an excipient of vitamin C using gelation method was examined using LC, functional groups, morphology, vitamin C release, and the release models.
3.1 Loading capacity of vitamin C
The LC is the ratio between the mass of vitamin C in the encapsulation product and the mass of the product (Equation (4)). The performance of DGM in encapsulating vitamin C was supported by DD. Extending DD led to a positive impact on vitamin C entrapment (Fig. 1).
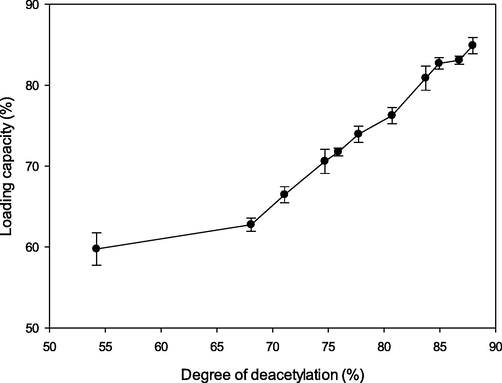
- Loading capacity of vitamin C at various degrees of deacetylation.
Deacetylation reduced the solubility of glucomannan due to the acetyl group replacements (Wardhani et al., 2017). More replacement produced higher DD of DGM. This condition promoted the gelation form of glucomannan by creating more hydrogen bonds, hence allowing it to entrap more active compound (Wardhani et al., 2019).
Ascorbic acid which represented vitamin C was mixed with DGM during preparation before encapsulation. It is commonly reported that acid hydrolyzes glucomannan into smaller molecules. However, hydrolysis could occur using strong acid in a long period of reaction (Tanaka et al., 2013). HCl and H2SO4 have been reported to successfully hydrolyze glucomannan (Cheng et al., 2010; Huang et al., 2010; Wang et al., 2015). Moreover, Barra et al. (2019) reported that polysaccharides, such as alginate, gum arabic, maltodextrin, and modified starches, are shown as unreacted materials in ascorbic acid encapsulation. Hence, the effect of hydrolysis on DGM could eliminated. This result suggested that vitamin C entrapment using DGM could occur physically.
The maximum loading (84.9%) was achieved by glucomannan with 87.95% DD. Better gelling ability of glucomannan was also obtained by Wen et al. (2009) with a higher DD. Less-soluble and better-gelled material creates more stable capsules and prevents loss of vitamin C. Similar correlation of the DD and LC was described by Gupta and Jabrail (2007), who found that increasing drug loading up to 49% was achieved after deacetylation of chitosan by as much as 75%.
3.2 Functional groups, morphology, and particle distribution
Functional groups, morphology, and particle size distribution of native glucomannan, DGM with the highest DD value, and encapsulated vitamin C using DGM with the highest LC. IR spectroscopy was used to investigate the interactions between different species and changes in chemical compositions of glucomannan after deacetylation and encapsulation. IR spectra of the samples are shown in Fig. 2. Briefly, all the samples had similar peaks of functional groups in the range of 4000–400 cm−1 but with different absorbance intensities. All the samples had a broad absorption due to the stretching vibration of the O–H group at ∼ 3400 cm−1. Absorbance of this band increased after deacetylation suggesting an increase of intermolecular hydrogen bonding between glucomannan molecules (Solo-de-Zaldivar et al., 2014). The addition of vitamin C increased the absorbance of the O–H peak further. The band at ∼ 1730 cm−1, which was attributed to stretching of C = O of the carbonyl of acetyl groups, was found in native glucomannan (Solo-de-Zaldivar et al., 2014). This band tended to decrease after deacetylation due to acetyl replacement. However, the addition of vitamin C boosted the absorbance of this carbonyl peak of the five-membered lactone ring. The C = C band at ∼ 1660 cm−1 and stretch of the C–O–C group at ∼ 1100 cm−1 increased in vitamin C encapsulation (Sreeja et al., 2015). Alteration of O–H and carbonyl groups suggested the replacements caused by the deacetylation process and the integration of vitamin C. Results of FTIR confirmed integration of vitamin C into DGM in the encapsulation sample.
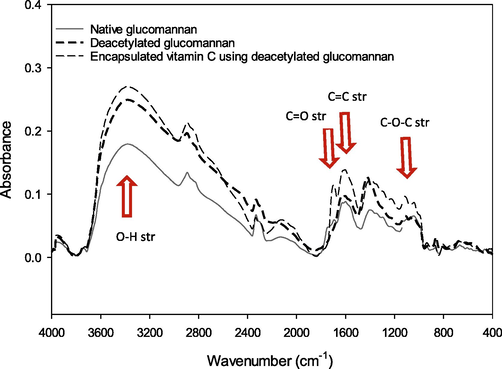
- IR spectra of native glucomannan, deacetylated glucomannan at the highest degree of deacetylation, and encapsulated vitamin C by the highest deacetylated glucomannan.
The morphology of glucomannan granules was observed using a scanning electron microscope at two different magnifications. Fig. 3a, 3c, and 3e displays 70 × magnification of samples in which their sizes were relatively similar. These figures suggested that the deacetylation process in a heterogeneous system did not change the particle size. A similar relation between deacetylation and particle size was previously found by Liu et al. (2010). Larger magnification (1,000 × ) of the particles revealed the surface appearance of the samples. A rougher surface was observed in DGM than in the native one. Encapsulated vitamin C in Fig. 3e tended to form crumbs possibly due to the drying process of the glucomannan–vitamin C beads. This drying process produced irregular particles of encapsulated vitamin C. Deacetylation could cause surface transformation, as described by Kurt and Kahyaoglu (2017). The deacetylating agent disrupted the particles’ surface, resulting in eroded surfaces. The addition of vitamin C produced brittle particles. Therefore, this fragility also impacted on the uneven particle surface as shown in Fig. 3f.
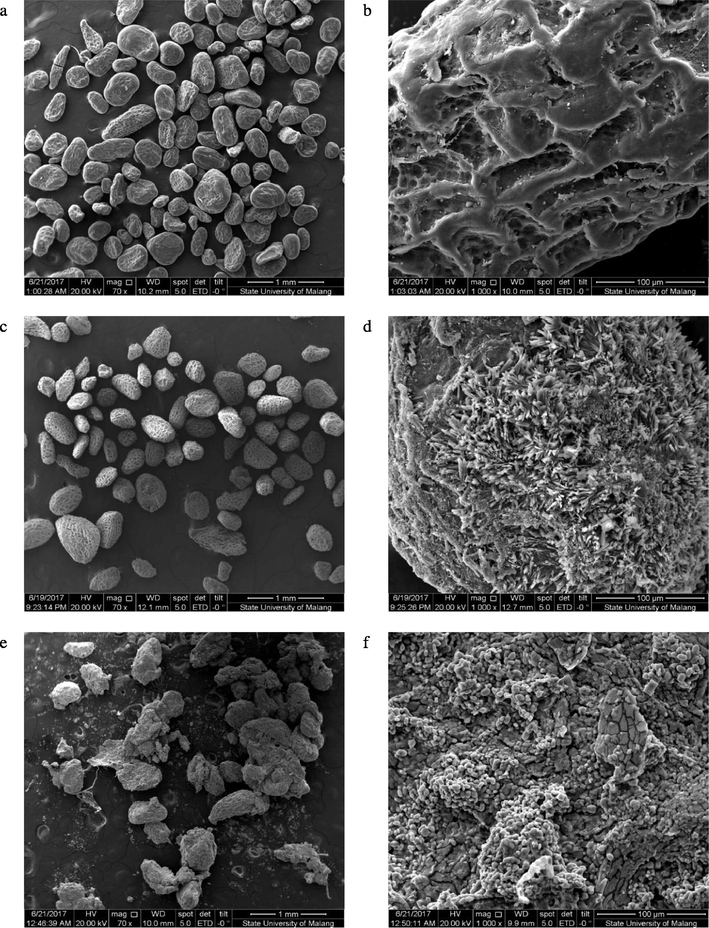
- Morphology of native glucomannan (a, b), deacetylated glucomannan at the highest degree of deacetylation (c, d), and encapsulated vitamin C using the highest deacetylated glucomannan (e, f) at 70× magnification (left) and 1,000× magnification (right).
Particle distribution of each samples is presented in Fig. 4. Particle size of native glucomannan was in the range of 0.2–0.6 mm and dominated by the diameter of ∼ 0.3 mm. Deacetylation reduced the particle into<0.3 mm. (Fig. 4b). This reduction could be due to erosion of the particle as shown on the Fig. 3d. Entrapment of vitamin C using gelation method increased the size of particle which dominated by the diameter of ∼ 0.3 mm (Fig. 4c).
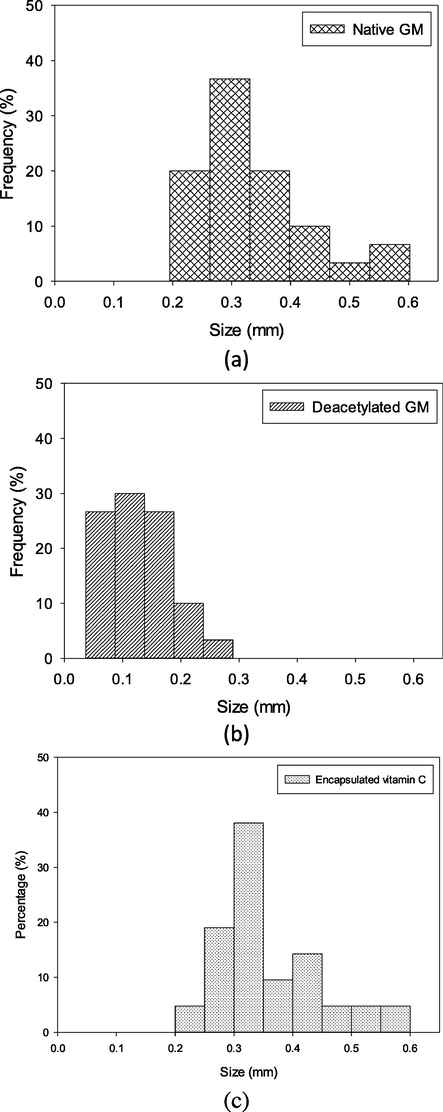
- Particle distribution of native glucomannan (a), deacetylated glucomannan at the highest degree of deacetylation (b) , and encapsulated vitamin C by the highest deacetylated glucomannan (c).
3.3 Release of vitamin C
Release of vitamin C from the lowest and highest LC encapsulants was evaluated in pH 1.2 and pH 6.8 solutions which simulated the stomach and small intestine fluid without enzyme, respectively (Ghaffarian et al., 2016). The release rate of vitamin C was lower in pH 1.2 solution than in pH 6.8 for both samples (Fig. 5). Both solutions showed two stages of release rate. In the first 30 min, vitamin C was released fast followed by a slower rate. This pattern could be due to the high driving force of dissolution in the initial release condition. Meanwhile, low burst release represented a slow decay of the matrix encapsulant, reducing the rate of release. The burst release was difficult to be prevented except other active substances were added (Yeo and Park, 2004).
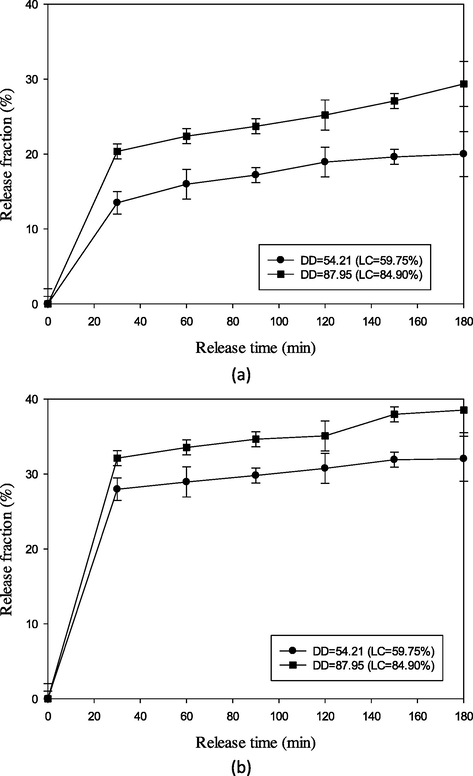
- Release of vitamin C from deacetylated glucomannan matrix of the lowest and the highest LC in two pH solutions, i.e., pH 1.2 (top) and pH 6.8 (bottom).
Encapsulated vitamin C in lower DD showed a lower rate than that of higher DD. Higher DD entrapped more vitamin C and disrupted the intermolecular binding of DGM. This condition facilitated more loss of vitamin C from the matrix, hence increased vitamin C concentration in the solution.
The release profiles of vitamin C were determined using the linearized forms of the two models: Higuchi and Korsmeyer–Peppas. The Higuchi model describes the release rate of solute from the matrix where loading of solute exceeds its solubility in the matrix into the surrounding fluid (Paul, 2011). In contrast, the Korsmeyer–Peppas model describes solute release from the matrix when more than one mechanism is involved (Bruschi, 2015). The model with the highest R2 value is the most suitable model to represent the release kinetics of vitamin C from DGM.
Plot of the release models of vitamin C from the DGM matrix are shown in Fig. 6, while the constants of the model are presented in Table 1. The Korsmeyer–Peppas model showed the highest R2 value for all samples (R2 > 0.772), which indicates that this model is fit to describe the release profile of vitamin C from the matrix bead. The n value of this model (n < 0.45) suggested that the Fickian diffusion mechanism occurred on vitamin C release (Dash et al., 2010) in which the drug release was governed by diffusion. In this case, the release due to diffusion was more dominant than that of the process of polymeric chain relaxation (Bruschi, 2015).
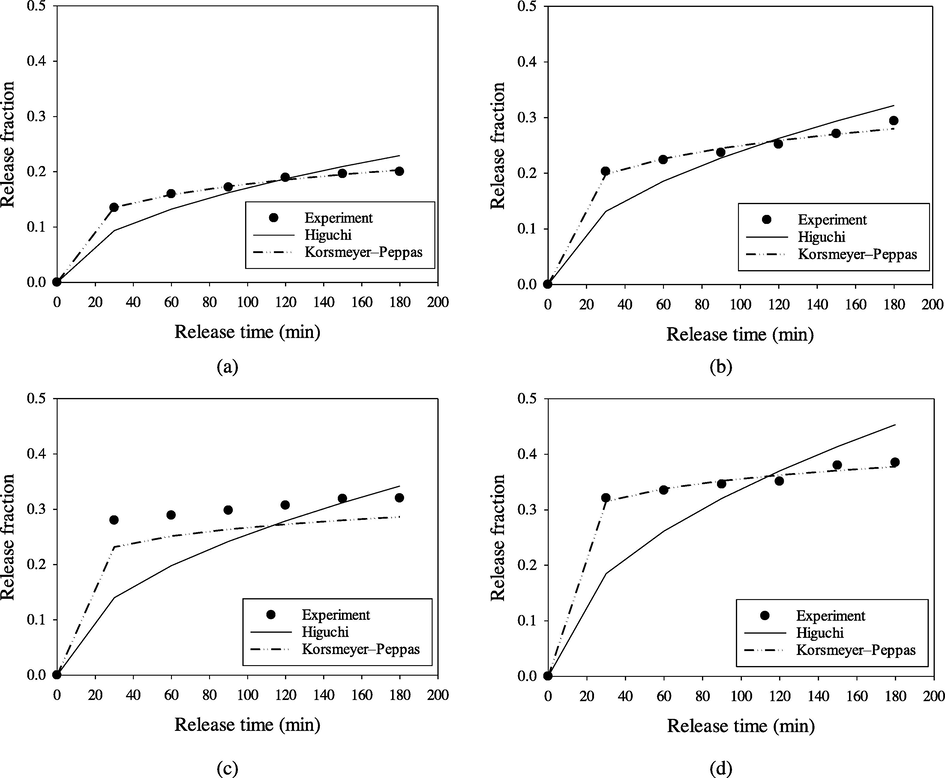
- Plotting models of vitamin C release from the lowest (left) and the highest (right) loading capacity matrix in pH 1.2 solution (a, b) and pH 6.8 solution (c, d).
| Samples | Solution pH | Higuchi | Korsmeyer–Peppas | |||
|---|---|---|---|---|---|---|
| KH | R2 | a | n | R2 | ||
| DD = 54.21 (LC = 59.75%) | pH 1.2 | 0.017 | 0.879 | 0.063 | 0.226 | 0.992 |
| pH 6.8 | 0.026 | 0.756 | 0.155 | 0.118 | 0.772 | |
| DD = 87.95 (LC = 84.90%) | pH 1.2 | 0.024 | 0.858 | 0.102 | 0.194 | 0.944 |
| pH 6.8 | 0.033 | 0.720 | 0.224 | 0.101 | 0.892 | |
4 Conclusions
Deacetylation increased loading capacity to entrap vitamin C. This process caused modification in the functional groups, morphology, and particle distribution of glucomannan as displayed by IR spectra and SEM images. The highest DD of glucomannan (87.9%) has 84.9% LC in encapsulating vitamin C. However, the highest DD allowed to release vitamin C faster than the lowest DD. Release rate of vitamin C from DGM was higher in a pH 6.8 buffer solution than that of pH 1.2 solution. The Korsmeyer–Peppas model was fit to represent the release of vitamin C from DGM at pH 1.2 (R2 > 0.892) and at pH 6.8 (R2 > 0.772). This study suggested the strong potential of DGM as an encapsulating agent for vitamin C using a gelation method.
Disclosure of funding
“This research was financially supported by the Faculty of Engineering, Universitas Diponegoro, Indonesia through Strategic Research Grant 2019”.
Declaration of Competing Interest
The authors declare that they have no known competing financial interests or personal relationships that could have appeared to influence the work reported in this paper.
References
- Microencapsulation as a novel drug delivery system. J. Pharm. Sci. Res.. 2011;1(1):1-7.
- [Google Scholar]
- Spray-drying performance and thermal stability of L-ascorbic acid microencapsulated with sodium alginate and gum arabic. Molecules. 2019;24(16):2872.
- [CrossRef] [Google Scholar]
- Development of an automated method to perform a quantitative study of particle size distribution and the effect of a conductive layer in scanning electron microscopy. Quim. Nova.. 2019;42(4):447-452.
- [Google Scholar]
- Strategies to modify the drug release from pharmaceutical systems. Cambridge: Woodhead Publishing; 2015.
- Deacetylation affects the physical properties and bioactivity of acemannan, an extracted polysaccharide from Aloe vera. Carbohydrate Poly.. 2015;133:556-566.
- [CrossRef] [Google Scholar]
- Ultrasound mediated acid hydrolysis of konjac glucomannan. Int. Food Res. J.. 2010;17:1043-1050.
- [Google Scholar]
- Microencapsulation of β-carotene by spray drying: effect of wall material concentration and drying inlet temperature. Int. J. Food Sci.. 2019;8914852
- [CrossRef] [Google Scholar]
- Kinetic modeling on drug release from controlled drug delivery systems. Acta Pol. Pharm.. 2010;67(3):217-223.
- [Google Scholar]
- Characteristics of vitamin C encapsulated tripolyphosphate-chitosan microspheres as affected by chitosan molecular weight. J. Microencapsul.. 2006;23(1):79-90.
- [CrossRef] [Google Scholar]
- Effect of degree of deacetylation on physicochemical and gelation properties of konjac glucomannan. Food Res. Int.. 2012;46(1):270-278.
- [CrossRef] [Google Scholar]
- Chitosan–alginate microcapsules provide gastric protection and intestinal release of ICAM-1-targeting nanocarriers, enabling GI targeting in vivo. Adv. Funct. Mater.. 2016;26(20):3382-3393.
- [CrossRef] [Google Scholar]
- Konjac glucomannan nanocrystals prepared by acid hydrolysis. e-Polymers. 2010;10(1)
- [CrossRef] [Google Scholar]
- Nano-encapsulation as a promising approach for targeted delivery and controlled release of vitamins. Trends Food Sci. Technol.. 2016;53:34-48.
- [CrossRef] [Google Scholar]
- Monodisperse W/O/W emulsions encapsulating l-ascorbic acid: insights on their formulation using microchannel emulsification and stability studies. Colloids Surf. A Physicochem. Eng. Aspects.. 2014;458:69-77.
- [CrossRef] [Google Scholar]
- Gelation and structural characteristics of deacetylated salep glucomannan. Food Hydrocolloids. 2017;69:255-263.
- [CrossRef] [Google Scholar]
- Adsorption of tannin from aqueous solution by deacetylated konjac glucomannan. J. Hazardous Mater.. 2010;178(1–3):844-850.
- [CrossRef] [Google Scholar]
- Effect of alkalis on deacetylation of konjac glucomannan in mechano-chemical treatment. Particuology.. 2011;9(3):265-269.
- [CrossRef] [Google Scholar]
- Elaborations on the Higuchi model for drug delivery. Int. J. Pharm.. 2011;418(1):13-17.
- [CrossRef] [Google Scholar]
- An overview of encapsulation of active compounds used in food products by drying technology. Food Biosci.. 2016;13:76-83.
- [CrossRef] [Google Scholar]
- Human physiology: from cells to systems (9th Ed.). Cengage learning, Boston; 2016.
- Effect of deacetylation on the glucomannan gelation process for making restructured seafood products. Food Hydrocolloids. 2014;35:59-68.
- [CrossRef] [Google Scholar]
- Water-dispersible ascorbic-acid-coated magnetite nanoparticles for contrast enhancement in MRI. Applied Nanoscience.. 2015;5:435-441.
- [CrossRef] [Google Scholar]
- Microwave-assisted acid hydrolysis of konjac products for determining the konjac powder content. Anal. Sci.. 2013;29(11):1049-1053.
- [CrossRef] [Google Scholar]
- Deacetylation of glucomannan of Amorphophallus oncophillus using NaOH and its properties as iron excipient by gelation in ethanol. AIP Conf. Proc.. 2019;2194:020132
- [CrossRef] [Google Scholar]
- Influence of splitting on dissolution properties of metoprolol tablets. Bosnian J. Basic Med.. 2009;Sciences,9(3):245.
- [Google Scholar]
- Alginate–konjac glucomannan–chitosan beads as controlled release matrix. Int. J. Pharm.. 2002;244(1–2):117-126.
- [CrossRef] [Google Scholar]
- Preparation and characterization of konjac glucomannan microcrystals through acid hydrolysis. Food Res. Int.. 2015;67:111-116.
- [CrossRef] [Google Scholar]
- Wardhani, D. H., Nugroho, F., Muslihudin, Aryanti, N., 2016. Application of response surface method on purification of glucomannan from Amorphophallus oncophyllus by using 2-propanol. Scientific Study Research Chemistry & Chemical Engineering, Biotechnology, Food Industry. 17(1), 063 – 074.
- Effect of deacetylation on functional properties of glucomannan. AIP Conf. Proc.. 2017;1855(1):030020
- [CrossRef] [Google Scholar]
- Simultaneous effect of temperature and time of deacetylation on physicochemical properties of glucomannan. Asean J. Chem. Eng.. 2018;18(1):1-8.
- [Google Scholar]
- Wardhani, D. H., Aryanti, N., Etnanta, F. N., Ulya, H. N., 2019. Modification of glucomannan of Amorphophallus oncophyllus as an excipient for iron encapsulation performed using the gelation method. Acta scientiarum polonorum. technologia alimentaria. 18(2), 173–184. http://dx.doi.org/10.17306/J.AFS.2019.0651
- Preparation and characterization of konjac glucomannan–poly (acrylic acid) IPN hydrogels for controlled release. Carbohydr. Polym.. 2009;78(2):193-198.
- [CrossRef] [Google Scholar]
- Control of encapsulation efficiency and initial Burst in polymeric microparticle systems. Arch. Pharmacal Res.. 2004;27(1), 1
- [CrossRef] [Google Scholar]
- Effects of deacetylation of konjac glucomannan on Alaska Pollock surimi gels subjected to high-temperature (120 °C) treatment. Food Hydrocolloids. 2015;43:125-131.
- [CrossRef] [Google Scholar]


