

Translate this page into:
Vibrational Spectroscopic Methods for the Identification and Distinction of Essential Oils in Genus Ocimum L.: A Chemometric Approach
⁎Corresponding author. gathwalajai@gmail.com (Vijai Malik)
-
Received: ,
Accepted: ,
This article was originally published by Elsevier and was migrated to Scientific Scholar after the change of Publisher.
Peer review under responsibility of King Saud University.
Abstract
Abstract
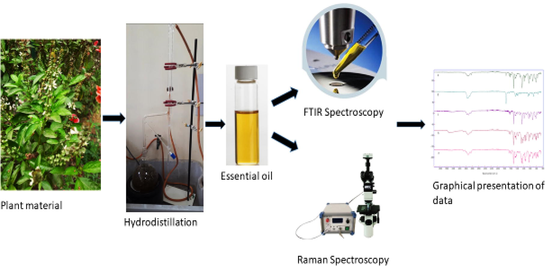
Essential oils are mainly analyzed by gas chromatography coupled with mass spectrometry (GC–MS). This is a time consuming technique which requires complex instrumentation assembly. Raman and FTIR spectroscopy are rapid and non-destructive techniques for qualitative characterization, differentiation of principal essential oil components, detection of adulteration in the oil, quality control of essential oil in industry as well as to distinguish different taxa. In the present study, five Ocimum spp. (Ocimum tenuiflorum L., Ocimum gratissimum L., Ocimum × africanum Lour., Ocimum basilicum L. and Ocimum americanum L) have been identified on the basis of essential oil by the Raman and FTIR spectroscopic techniques. It was found that methyl eugenol, eugenol, estragole, and camphor are major essential oils components present in Ocimum L. The results of PCA indicate that all five species of Ocimum L. form different clusters on the basis of principal essential oil components. The components of essential oil predicted by Raman spectroscopy correlate well with that of FTIR data. The present study demonstrates the use of Raman and FTIR spectroscopy techniques to distinguish taxa and characterization of essential oil components.
Keywords
Raman Spectroscopy
FTIR Spectroscopy
Essential oil
Ocimum L

1 Introduction
The essential oils of Ocimum L. (Lamiaceae) are commercially valuable due to their huge applications in cosmetics, perfumes, medicines, aromatherapy and flavor for delicious food. Due to these usages the production and demands of these oils have been increased day by day (Lawrence, 1998; Padalia et al., 2013; Raina and Misra, 2017). There are different commercial applications of basil essential oil in different industrial products (Preedy, 2016; Sharmeen et al., 2021). According to a market research, the demand and production of essential oil will be increased during the years 2021–2027 (6Wresearch). The essential oils are complex secondary compounds of plant origin which are the mixture of different chemicals like terpene, phenylpropanoids, hydrocarbons and other sulphur or nitrogenous compounds. The characteristic aromatic smell of different basils is due to the presence of different major chemical components of essential oil in different ratio (Vina and Murillo, 2003). These oils components provide unique aroma to the basils. Some popular compounds like estragole or methyl chavicol, linalool and eugenol give specific taste and flavors to essential oils. The amount and composition of these characteristic aromatic compounds depend on the chemodiversity (Satyal et al., 2016). The molecular structure of few essential oils components are given below (Fig. 1).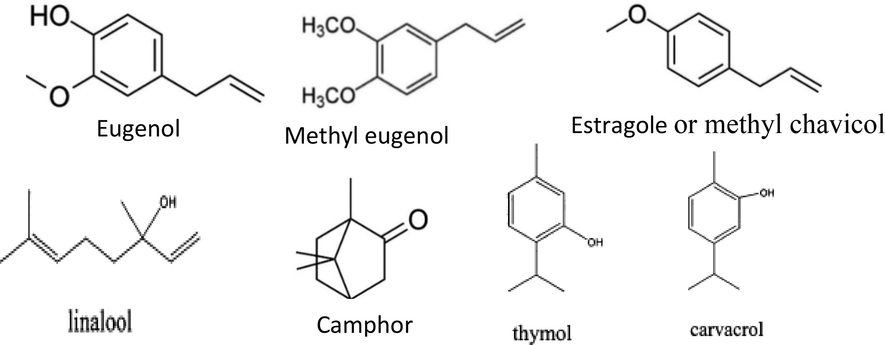
Molecular structure of some essential oil components.
The distribution of plant essential oils is species specific. Basil oils are extracted mainly from foliar or aerial parts of the plants (Silva et al., 2016) in concentrated form through hydro-distillation or steam-distillation (Dhifi et al., 2016; El-Shemy, 2017). The characterization of essential oil not only depends on composition but also on growing season, area and environmental condition (Zouari et al., 2012). Besides, harvesting time is also important for recovery of maximum percentage of essential oil (Khalid et al., 2009; Yesil and Ozcan, 2021). Although essential oils are mixture of more than hundreds of chemical compounds but few main components or their definite ratios are responsible to distinguish the chemotypes in a species. The different species of Ocimum L. can be recognized on the basis of particular chemotypes (Table 1). The main components of Ocimum L. growing in India are estragole or methyl chavicol, eugenol, methyl eugenol, linalool, 1, 8-cineole. One can notice from the Table 1 that two main essential oil components viz. estragole or methyl chavicol (Simon et al., 1990; Lewinsohn et al., 2000; Özcan and Chalchat, 2011) and linalool (El-Soud et al., 2015) are most common chemotypes in the Ocimum basilicum. The essential oil of sacred basil Ocimum tenuiflorum is characterized by presence of high percentage of methyl eugenol and eugenol (Simon et al., 1990; Bhattacharya et al., 1996; Awasthi and Dixit, 2007; Sims et al., 2014), whereas Ocimum americanum is recognized by presence of camphor and limonene (Mondello et al., 2002; Chagonda et al., 2000). The essential oil of clove basil, Ocimum gratissimum is characterized by eugenol (Raina and Misra, 2017, Bhattacharya et al., 1996; Oyen and Dung, 1999). The major components of essential oil of Ocimum × africanum are citral and estragole or methyl chavicol (Tangpao et al., 2018; Gurav et al. 2021).
Essential oil source
Chemotype
Reference
Ocimum tenuiflorum L.
methyl eugenol, eugenol
Raina and Misra, 2017; Gurav et al., 2021; Anand et al., 2016.
Ocimum gratissimum L.
eugenol, thymol, geraniol
Bhattacharya et al., 1996; Oyen and Dung, 1999; Charles and Simon, 1992; Rawat et al., 2017; Olugbade et al., 2017; Vieria et al., 2001.
Ocimum basilicum L.
estragole or methyl chavicol, linalool, ctral, citral/linalool
Simon et al., 1990; Lewinsohn et al., 2000; Özcan and Chalchat, 2011; El-Soud et al., 2015.
Ocimum × africanum Lour.
estragole or methyl chavicol, linalool, citral (neral and geranial)
Raina and Misra, 2017; Gurav et al., 2021; Janesha et al., 2018; Pisutthanan and Pisutthanan, 2009.
Ocimum americanum L.
Camphor, Citral, limonene, linalool, methyl cinnamate
Mondello et al., 2002; Selvi et al., 2012.
At present, essential oils are mainly analyzed by gas chromatography coupled with mass spectrometry (GC–MS) technique (Grayer et al., 1996; Joshi, 2017). This technique is time consuming and required complex instrumentation assembly, whereas Raman and FTIR based spectroscopic techniques are quick and non-destructive approach. These spectroscopic techniques work on the basis of interaction between light and molecules. Such interaction provide unique feature to molecules in form of spectrum that are utilized for recognition of these molecules in essential oils (Schulz et al., 2003; Agatonovic-Kustrin et al., 2020). Earlier, these technique has been utilized successfully for rapid determination of purity of essential oils used in industries. The closely related plant varieties can be differentiated with the help of Raman and FTIR spectroscopy (Wiwart et al., 2015; Chen, et al., 2019; Kolasinac, et al., 2022). These techniques need no pre-treatment of sample for the measurements. Here dried and fresh samples can be analyzed smoothly with very low interference of water content present in plant sample (Seidler-Lozykowska et al., 2010).
In this study, we have identified commercially important essential oils of 5 species of Ocimum viz. Ocimum tenuiflorum, Ocimum gratissimum, Ocimum americanum, Ocimum × africanum and Ocimum basilicum by Raman and FTIR spectroscopic technique. The spectra received from both spectroscopic techniques work as fingerprint to find its constituent molecules. Further, principle component analysis (PCA) and chemometric analysis have been employed to differentiate the closely related components of essential oils in these taxa.
2 Material and Methods
To get the essential oil, the plants of Ocimum tenuiflorum, Ocimum gratissimum, Ocimum basilicum and Ocimum × africanum were raised in the botanical garden of department of Botany, CCS University, Meerut (India). The naturally growing Ocimum americanum was collected from wild population. Aerial parts of flowering stage were collected during noon for maximum essential oil extraction. Collected plant material was cut in to small pieces and allowed to shade dry for removal of excess water.
Isolation of essential oil: The dried aerial parts of all five species were crushed separately into small sized pieces and it was followed by hydro-distillation in a Clevenger’s apparatus for 3 hours. The oil was collected and dried over anhydrous sodium sulfate and keep in amber bottle at 4 °C for further analysis.
Pure standard compounds: Pure standards compounds of eugenol, citral, estragole or methyl chavicol, linalool, thymol, eucalyptol were purchased from Sigma-Aldrich and CDH India.
Raman Spectroscopy: Raman measurements were performed using Raman spectrometer (RIAFMR-785-C RI Instruments & Innovation India) equipped with a 785 nm diode laser and scattered light was detected by a TEC cooled CCD Linear Array detector. Approximately 5 μl of essential oil was used for spectral analysis. Each Raman spectrum was collected with a total integration time of 10 s by using maximum laser power of 458mw.
FTIRSpectroscopy: The FTIR spectra were recorded on Agilent ATR-FTIR Spectrometer (ATR module of Cary 630 FTIR, Agilent Technologies) using bounce diamond crystal from 600 cm−1 to 4000 cm−1 and equipped with Agilent Resolutions Pro Software, version 5.2 (G9222-64000). About 10 µl drop of essential oil was placed on a diamond ATR crystal for spectral analysis.
Chemometric Analysis: The hierarchical cluster analysis (HCA) was performed on Raman spectral data using Ward’s algorithm to construct groups based on the spectral data ranging from 500 to 1800 cm−1. PCA was performed by R-Studio software on twenty spectral data of each species for complete discrimination and to reduce complexity of data.
3 Results
The yield of essential oil was recorded on dry weight basis. It was recorded 2.2 %, 1.8 %, 2 %, 2.1 % and 1 % for Ocimum basilicum, Ocimum americanum, Ocimum tenuiflorum, Ocimum × africanum and Ocimum gratissimum respectively. The color of essential oil in O. basilicum, O. americanum and O. × africanum was whitish. In O. tenuiflorum and O. gratissimum, the color was yellowish.
Raman spectrum of essential oils for all the species and references used in this study are given in Fig. 2. Raman spectrum of Ocimum tenuiflorum, Ocimum gratissimum, Ocimum basilicum, Ocimum × africanum and Ocimum americanum are given in Fig. 2a-e respectively. Raman spectrum of references viz. eugenol, estragole or methyl chavicol, linalool, citral, eucalyptol, hexane and thymol are given in Fig. 2f-l respectively. The characteristics bands ranging between 1449 and 1450 cm−1 are most common bands that appear for all extracted essential oil samples. These bands can be attributed to CH3/CH2 vibrations (Baranska et al., 2013; Jentzsch et al., 2015). The major Raman peaks of essential oil samples along with corresponding vibrations are given in Table 2.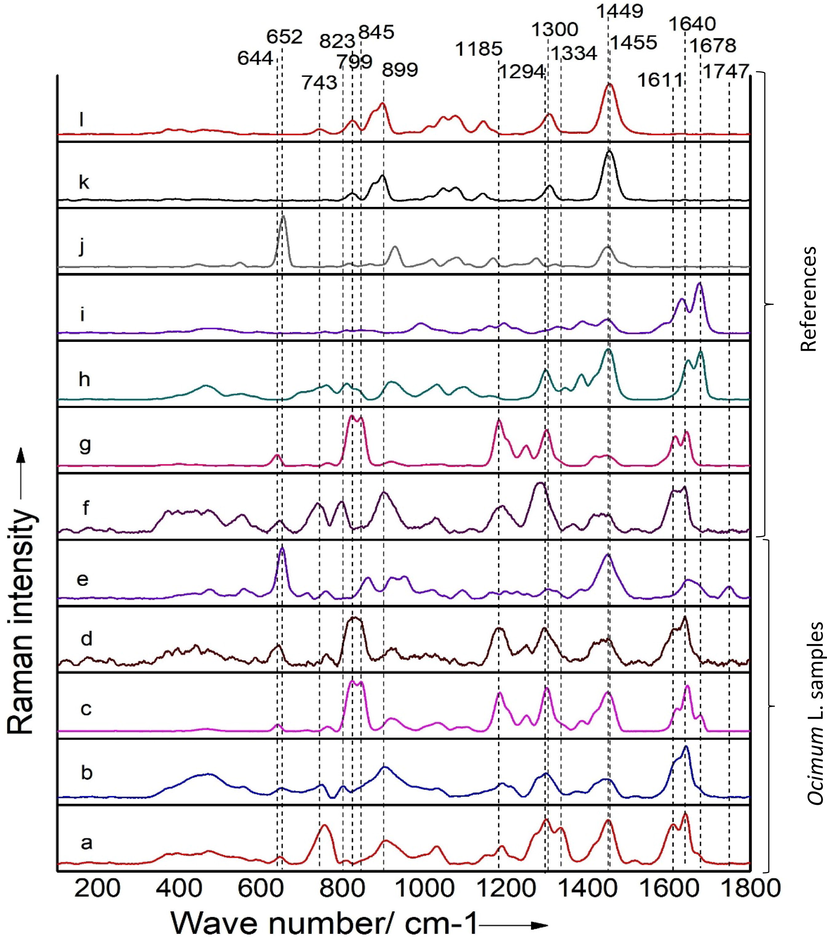
Raman spectra of: (a) Ocimum tenuiflorum, (b) Ocimum gratissimum, (c) Ocimum basilicum, (d) Ocimum × africanum, (e) Ocimum americanum, (f) eugenol, (g) estragole or methyl chavicol, (h) linalool, (i), citral,(j) eucalyptol, (k) Hexane, (l) Thymol.
Essential oil
Wave numbers of bands (cm−1)
Proposed assignment
Ocimum tenuiflorum L. (Holly basil)
1640
Exocyclic C⚌C
1611
Ring quadrant stretch
1450
CH3/CH2 bend
1299
=CH
755
Ring deformation
Ocimum gratissimum L. (Clove basil)
1641
Exocyclic C⚌C
1449
CH3/CH2 bend
1298
=CH
749
Ring deformation
649
Ring deformation
Ocimum americanum L. (American basil)
1747
C⚌O stretch
1645
C⚌C stretch
1449
CH3/CH2 bend
759
Ring deformation
652
Ring deformation
Ocimum × africanum Lour. (African basil)
1639
C⚌C stretch
1611
Ring quadrant stretch
1449
CH3/CH2 bending
1294
Rther Ar-O- stretch
1180
C—H bond
823
Aromatic H, CH wag
643
Ring deformation
Ocimum basilicum L. (Sweet basil)
1645
C⚌C stretch
1619
Ring quadrant stretch
1449
CH3/CH2 bend
1300
Ether Ar-O- stretch
1185
C—H bond
823
Aromatic H, CH wag
640
Ring deformation
The observed different Raman peaks can be correlated with the characteristic feature of different compounds present in the essential oil. Raman peak intensities would be stronger for the compounds whose quantity is more in the essential oil. Fig. 2(a) shows the Raman spectra of Ocimum tenuiflorum essential oil where strong peaks appear at the wavenumber 1640, 1611, 1450, 1335, 1299, 1190, 1031, 907, 755 and 469 cm−1. When these spectra of extracted oil are compared with reference sample spectra of eugenol, then it has been observed that most characteristics peaks match with the oil sample. The strongest band has been observed at frequency 1640 cm−1. This band corresponds to exocyclic C⚌C of eugenol, whereas peak at 1611 cm−1 is attributed to the benzene ring of eugenol and methyl eugenol (Chowdhry et al., 2015; Wang and Sung, 2011). Next strong band at 1299 cm−1 is attributed to = CH bond.
The eugenol intensity of reference was found to be stronger than intensity of essential oil at 1450 and 755 cm−1. The strong peak at 1281 cm−1 in the spectra of eugenol standard has been shifted to 1299 cm−1 along with shoulder peak of methyl eugenol at 1334 cm−1 (Chowdhry et al., 2015).
Fig. 2(b) shows Raman spectra in the sample of Ocimum gratissimum. The major Raman spectra of Ocimum gratissimum have been observed at 1641, 1449, 1298, 1211, 1191, 1034, 902, 799, 749, 649, 556 and 468 cm−1 wavenumber. The eugenol is main essential oil component of Ocimum gratissimum. This is also evident from similar Raman patterns of reference and extracted oil. The band at wavenumber 1641 cm−1 correspond to exocyclic C⚌C of eugenol, whereas 1298 cm−1 corresponds to = CH bond of eugenol. The strong peak of eugenol at 799 cm−1 has slightly been shifted to 801 cm−1 in spectra of Ocimum gratissimum.
Raman spectra of Ocimum basilicum essential oil where major peaks lie at 1645, 1619, 1449, 1302, 1185, 823 and 640 cm−1 wavenumber (Fig. 2c). The bands at 1645, 1619, 1449 cm−1 correspond to exocyclic C⚌C, ring quadrant stretch and CH3/CH2 respectively, whereas, band at 1300 cm−1 corresponds to ether Ar-O stretch. Two bands at 823 and 640 cm−1 of Ocimum basilicum essential oil match exactly with reference estragole or methyl chavicol reference that can be assigned to aromatic H, CH wag and Ring deformation (Jentzsch et al., 2015).
Fig. 2(d) represents Raman spectra in the sample of Ocimum × africanum. Major Raman peaks were found at 1639, 1611, 1449, 1294, 1180, 823 cm−1 wavenumbers. Here bands at 1639, 1611, 1294 cm−1 correspond to C⚌C stretch, ring quadrant stretch and to ether Ar-O- stretch, respectively (Schulz et al., 2003; Jentzsch et al., 2015). While bands at 1180, 823 and 643 cm−1 corresponds to plane ring C—H bond, aromatic H, CH wag and ring respectively (Jentzsch et al., 2015). The Ocimum × africanum is a natural hybrid of Ocimum americanum and Ocimum basilicum (Majdi, et al., 2020). Therefore, its major Raman peaks were found to be similar to Ocimum basilicum and reference extragole sample. It has also been observed that two peaks at 1639 and 1611 for Ocimum × aftricanum sample shift towards the higher wavenumber at 1645 and 1619 cm−1 in Ocimum basilicum sample. On the basis of previous studies, it has been found that citral, linalool and methyl chavicol are the three major essential oil components of Ocimum × africanum (Raina and Misra, 2017; Gurav et al., 2021; Janesha et al., 2018; Pisutthanan and Pisutthanan, 2009). When the extracted oil sample are compared with references then extragole reference matches with the sample, whereas linalool and citral peaks match partially. The presence of these components can also be sensed from its aroma, as these two taxa, Ocimum × africanum and Ocimum basilicum have quite similar smell. This indicate common aromatic substance in both the species.
According to Mondello et al., (2002) and Pandey et al., (2014) the two major components type of Ocimum americanum are citral and camphor type. The citral type is characterized by high amount of neral and geranial.
In Ocimum americanum, the major bands of Raman spectrum appear at wavenumber 476, 556, 652, 759, 861, 919, 951, 1019, 1094, 1305, 1449, 1645 and 1747 cm−1 (Fig. 2e). The two strongest bands appear at 652 and 1449 cm−1 wavenumber. These strong bands were associated with ring deformation of camphor (Jentzsch and Ciobota, 2014) and CH3/CH2 bending respectively. The weak band at 1747 appears a vibration mode of C⚌O stretch of camphor (Jentzsch and Ciobota, 2014). The thymol is also major essential oil component of Ocimum gratissimum. Similar Raman spectrum of thymol in hexane solution along with hexane spectrum can be seen in Fig. 3. The Raman peak that appears at 743 for thymol sample is found to be the characteristic peak for thymol (Khoshroo et al., 2015). However, thymol is not observed in Raman spectrum of all essential oils sample of Ocimum L.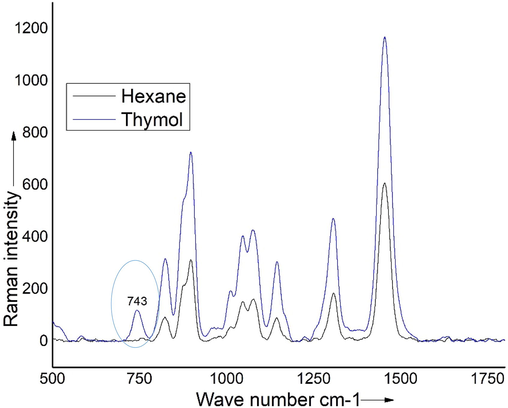
Raman spectra of Hexane and Thymol. Peak at 743 in the raman spectra of Thymol differenciate the thymol from hexane.
ATR-FTIR-Spectroscopy: The identity of all the above essential oil components were also confirmed with the help of FTIR Spectroscopy measurement.
The FTIR spectra of essential oil of five species of Ocimum L is given in Fig. 4a-e. The spectral data for Ocimum tenuiflorum and Ocimum gratissimum show clear identity and discrimination between methyl eugenol and eugenol types. Strong peaks at 2930 and 2933 cm−1 are due to CH and peak at 1638 corresponding to C⚌C aromatic moiety (Wang and Sung, 2011) were found similar in both the samples of Ocimum tenuiflorum and Ocimum gratissimum. The peaks at 1605 and 1591 cm−1 represent the vibrations of aromatic C⚌C (Nuchuchua et al., 2009). The pattern and position of peaks in Ocimum gratissimum oil were correlated well with previous work on eugenol by FTIR Spectroscopy (Pramod et al., 2015). The difference in pattern of peaks between both samples of Ocimum tenuiflorum and Ocimum gratissimum can be observed at 1418 and 1463 cm−1 for Ocimum tenuiflorum and 1431 and 1465 cm−1 for Ocimum gratissimum (Fig. 4 a, b). The peak at 1418 is weak and at 1463 is stronger in Ocimum tenuiflorum but in case of Ocimum gratissimum the peak at 1431 is stronger and 1465 is weaker for eugenol and methyl eugenol respectively.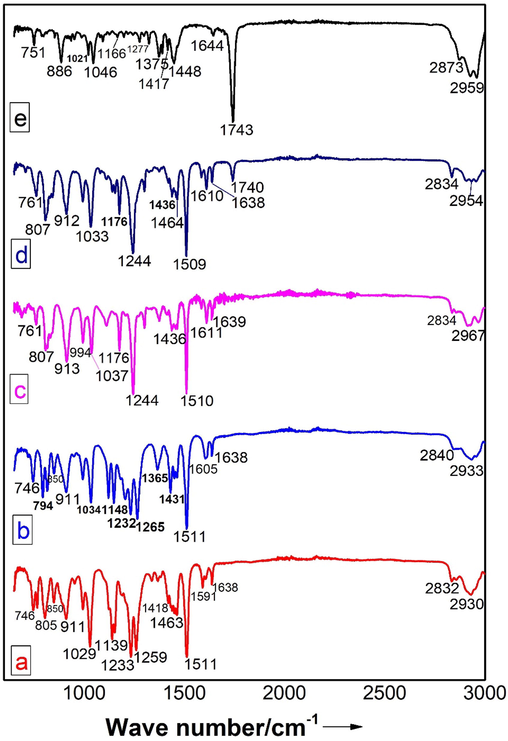
FTIR-spectra of (a) Ocimum tenuiflorum, (b) Ocimum gratissimum, (c) Ocimum basilicum, (d) Ocimum × africanum, (e) Ocimum americanum.
The strongest bands for Ocimum basilicum and Ocimum × africanum have been observed at 1511 cm−1 for Ocimum basilicum and 1510 cm−1 for Ocimum × africanum. The second strongest peak was observed at 1244 cm−1, whereas moderate bands at 1176 cm−1 and 807 cm−1 have been observed for both the species. The band at 913 cm−1 for Ocimum basilicum was shifted to 912 cm−1 for Ocimum × africanum.
In Ocimum americanum, the strongest band at 1743 cm−1 (Fig. 4, e) corresponds to carbonyl stretching (C⚌O) is of camphor (Michelina et al., 2018) and at 1375 cm−1 corresponds to methylene deformation (Gudi et al., 2015). The peaks at 2873, 2959, 1448, 1046 and 751 correspond to previous FTIR spectral data of camphor (Nunes et al., 2020). These results are in complete agreement with our FTIR Spectral data of camphor.
The fingerprinting zones of characteristic peaks for all samples are given in Table 3. Our spectral data agree completely with the results of Gas chromatography and vibrational spectroscopic work (Wang and Sung, 2011; Pramod et al., 2015) for characteristic components.
Frequency (cm-1)
Ot EO
Og EO
Ob EO
Oxa EO
Oa EO
3000–2700 cm−1
2930
2933
2834, 2967
2834, 2954,
2873, 2959
2700–1800 cm−1
–
–
–
–
–
1800–1550 cm−1
1591, 1638
1608, 1638
1611, 1639
1610, 1638
1644, 1743
1550–1050 cm−1
1233, 1259, 1511, 1418, 1463,
1148, 1232, 1266, 1431, 1465, 1511
1176, 1244, 1301, 1436, 1510
1176, 1244, 1301, 1436, 1509
1166, 1277, 1323, 1375, 1417, 1448
Below 1050 cm−1
746, 805, 850, 911, 993, 1029
745, 794, 816, 850, 911, 993, 1034,
761, 807, 913, 994, 1037
761, 807, 912, 993, 1033
751, 886, 1021, 1046
Principal Component Analysis (PCA): This analysis is based on dimensionality-reduction method in which dimension information of large data sets are transferred to less dimensional data sets. PCA analysis performed on the 20 data set points for each sample i.e. a total of 100 Raman essential oils data set (Fig. 5). First two PCA components (PC1, PC2) show major variance from others which is plotted in Fig. 5. Two principal component describes the 31 % of total variation and PC1 describes 23 % and PC2 describes 8 %. Here, essential oil PCs for five species are clustered into five distinct groups on the basis of Raman bands and each point represent a spectrum. Each species is clearly separated on the basis of their components. However, Ocimum × africanum and Ocimum basilicum are closely related species and contain estragole or methyl chavicol chemotype, yet PCA analysis clearly differentiate both types.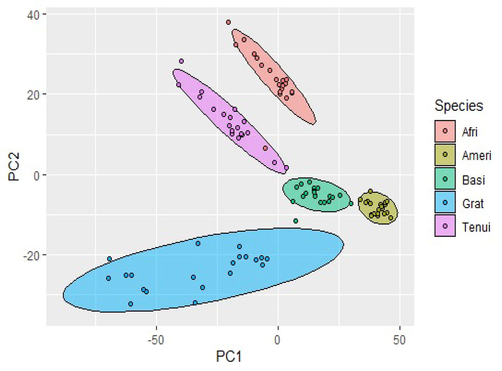
Principal Component Analysis (PCA) of Ocimum tenuiflorum (Tenui), Ocimum gratissimum (Grat), Ocimum × africanum (Afri), Ocimum basilicum (Basi), Ocimum americanum (Ameri).
Hierarchical Cluster Analysis (HCA): The hierarchical cluster analysis was performed on spectral data of Raman spectroscopy from 500 cm−1 to 1800 cm−1. This analysis clearly grouped samples according to their essential oil relationship among the investigated species (Fig. 6). The reference eugenol is clustered with Ocimum gratissimum (1 and 6 in Fig. 6), whereas estragole or methyl chavicol is clustered with Ocimum × africanum and Ocimum basilicum (4, 5 and 8 in Fig. 6). Ocimum americanum (2), Ocimum tenuiflorum (3), eucalyptol (7), linalool (9), citral (10), thymol (11) were segregated separately into individual cluster (Fig. 6).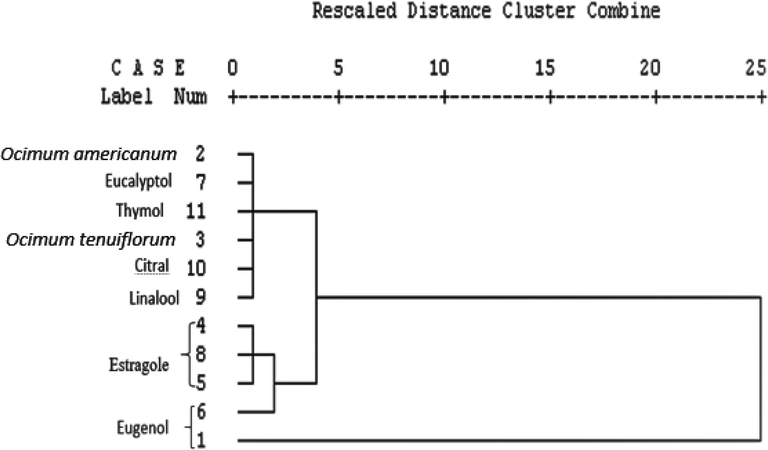
Dendrogram (Ward’s method) showing differentiation of essential oil based on the spectral data of Raman spectroscopy obtained from extracted oil and used standards. 1. Eugenol reference, 6. Ocimum gratissimum, 4. Estragole or methyl chavicol reference, 5. Ocimum × africanum, 8. Ocimum basilicum, 3. Ocimum tenuiflorum, 2. Ocimum americanum 7. Eucalyptol reference, 9. Linalool reference, 10. Citral reference, 11 Thymol reference.
4 Discussion
The essential oil components of five different species of Ocimum L. were investigated. In this study, Raman spectroscopy and FTIR spectroscopy have been utilized successfully for qualitative characterization and differentiation of principal essential oil components and to distinguish different species of Ocimum. The investigations of principal essential oil components by these method are in complete agreement with the previous studies and published literature (Schulz et al., 2003; Wang and Sung, 2011; Baranska et al., 2013; Jentzsch and Ciobota, 2014; Chowdhry et al., 2015; Jentzsch et al., 2015). The spectra from both techniques were used as fingerprint. The hierarchical cluster analysis of essential oils were found into four groups according to their chemical similarity. The results of PCA also indicate that all five species of Ocimum form different clusters on the basis of principal essential oil components. The principal components of Ocimum tenuiflorum, Ocimum gratissimum, Ocimum × africanum, Ocimum basilicum, Ocimum americanum are methyl eugenol, eugenol, estragole, estragole and camphor respectively. The characteristic aroma of each species is due to these principal components. The species of Ocimum do not contain thymol, eucalyptol, citral and linalool.
In the Raman spectrum of Ocimum tenuiflorum strongest band has been observed at frequency 1640 cm−1 (Fig. 2a). This band corresponds to exocyclic C⚌C of eugenol, whereas peak at 1611 cm−1 attributed to benzene ring of eugenol and methyl eugenol (Chowdhry et al., 2015; Wang and Sung, 2011). Eugenol is main essential oil component of Ocimum gratissimum (Charles and Simon, 1992; Rawat et al., 2017). Raman spectrum band at wavenumber 1641 cm−1 corresponds to exocyclic C⚌C of eugenol (Fig. 2b), whereas 1298 cm−1 corresponds to = CH bond of eugenol (Chowdhry et al., 2015). Raman spectra of Ocimum basilicum (Fig. 2c) match exactly with reference of estragole or methyl chavicol and is in complete agreement with previous findings on estragole (Jentzsch et al., 2015).
Ocimum × africanum essential oil is characterized by estragole or methyl chavicol, linalool, citral (neral and geranial) rich chemotypes (Raina and Misra, 2017; Gurav et al., 2021; Janesha et al., 2018; Pisutthanan and Pisutthanan, 2009). Raman peaks (Fig. 2d) matched with spectra of estragole standard reference and previous work (Schulz et al., 2003; Jentzsch et al., 2015). Ocimum × africanum is a natural hybrid of Ocimum americanum and Ocimum basilicum, so the component of these species should be in the hybrid species (Majdi, et al., 2020). The presence of estragole in the hybrid indicates that Ocimum × africanum has acquired the estragole from Ocimum basilicum. It was observed that the hybrid Ocimum × africanum is chemically close to Ocimum basilicum in context of estragole parental component. Here, it can be concluded that the dominant gene of Ocimum basilicum for estragole has been acquired by the hybrid and this hybrid may be used for bioprospecting studies. This will help in reduction of exploitation of Ocimum basilicum utilized to extract this component. The smell of Ocimum × africanum and Ocimum basilicum are exactly similar. It could be due to similar aromatic constituent in both the taxa. The chemotypes in Ocimum americanum essential oil have been reported to be rich in Camphor, Citral, limonene, linalool, methyl cinnamate (Mondello et al., 2002; Selvi et al., 2012). In our study the bands at wavenumber 652 and 1449 cm−1 in Ocimum americanum essential oil associated with ring deformation of camphor (Jentzsch and Ciobota, 2014) and band at 1747 appears a vibration mode of C⚌O stretch of camphor (Jentzsch and Ciobota, 2014). Thus, these findings suggests that these techniques can be utilized for quick identification, discrimination and classification of different taxa (Kolasinac, et al., 2022).
5 Conclusion
The data of Raman spectroscopy and FTIR techniques provide clear identification and discrimination between principal components of investigated Ocimum species. The results of both techniques show complete reconciliation with earlier spectral data on individual principle components present in each of the essential oil samples. Our finding based on principal essential oil components and their aroma indicate that the different species of Ocimum can be encouraged for cultivation for different purposes. Ocimum basilicum and Ocimum × africanum have estragole. These have sweet smell and thus these species can be used for value addition and for perfumery. Similarly Ocimum tenuiflorum and Ocimum gratissimum have spicy smell. These species can be cultivated for value addition. Ocimum americanum is camphor rich and can be used for antiseptic and antimicrobial spray. Thus, both these techniques can be efficiently used for plant identification, chemical profiling and to distinguish taxa as well as characterization of essential oil component. Similar methodology and findings can be utilized to distinguish other closely related taxa at varietal and form ranks.
Acknowledgement
Raman measurements were performed in department of physics, Chaudhary Charan Singh, University, Meerut, Uttar Pradesh (India), a facility credited by a Grant-in-Aid scheme of DHR (Project: R-112012/04/2019-HR) granted by ICMR, New Delhi, India. This research is also supported by Universiti Teknologi Malaysia using Industrial grant No. R.J130000.7609.4C468 and R.J13000.7609.4C465. This project was supported by Researchers Supporting Project number (RSP-2022/315) King Saud University, Riyadh, Saudi Arabia.
Declaration of Competing Interest
The authors declare that they have no known competing financial interests or personal relationships that could have appeared to influence the work reported in this paper.
References
- Essential oil quality and purity evaluation via FT-IR Spectroscopy and pattern recognition techniques. Appl. Sci.. 2020;10(20):7294.
- [CrossRef] [Google Scholar]
- Comparative functional characterization of eugenol synthase from four different Ocimum species: implications on eugenol accumulation. Biochim. Biophys. Acta. 2016;1864(11):1539-1547.
- [Google Scholar]
- Chemical composition of Ocimum sanctum Shyama and Ocimum sanctum Rama oils from the plains of Northern India. J. Essent. Oil-Bear. Plants.. 2007;10(4):292-296.
- [Google Scholar]
- Recent advance in Raman analysis of Plants: alkaloids, carotenoids and polyacetylenes. Curr. Anal. Chem.. 2013;9:108-127.
- [Google Scholar]
- Essential oil of Ocimum gratissimum L. and Ocimum tenuiflorum L. (syn. Ocimum sanctum L.) growing in Andhra Pradesh. Indian Perfum.. 1996;40(3):73-75.
- [Google Scholar]
- The essential oil of Ocimum canum Sims. (basilic camphor) and Ocimum urticifolia Roth. from Zimbabwe. Flavour Fragr. J.. 2000;15(1):23-26.
- [Google Scholar]
- A new geraniol chemotype of Ocimum gratissimum L. J. Essent. Oil Res.. 1992;4(3):231-234.
- [Google Scholar]
- Variety identification of Orchids using Fourier Transform Infrared spectroscopy combined with stacked spares auto-encoder. Molecules. 2019;24(13):2506.
- [CrossRef] [Google Scholar]
- Infrared and Raman spectroscopy of eugenol, isoeugenol and methyl eugenol: conformational analysis and vibrational assignments from DFT calculations of the anharmonic fundamentals. J. Phys. Chem. A. 2015;119(46):11280-11292.
- [Google Scholar]
- Essential oils’ chemical characterization and investigation of some biological activities: a critical review. Medicines.. 2016;3:25.
- [CrossRef] [Google Scholar]
- El-Shemy, H., 2017. Active ingredients from Aromatic and Medicinal Plants. 176-183. doi: 10.5772/67161.
- Chemical composition and antifungal activity of Ocimum basilicum L. essential oil. Open Access Maced. J. Med. Sci.. 2015;3(3):374-379.
- [Google Scholar]
- Infraspecific taxonomy and essential oil chemotypes in sweet basil, Ocimum basilicum. Phytochemistry. 1996;43(5):1033-1039.
- [Google Scholar]
- Attenuated Total Reflectance-Fourier Transform Infrared Spectroscopy on intact dried leaves of Sage (Salvia officinalis L.) – accelerated chemotaxonomic discrimination and analysis of essential oil composition. J. Agric. Food Chem.. 2015;69(39):8743-8750.
- [CrossRef] [Google Scholar]
- A glance at the chemodiversity of Ocimum species: trends, implications, and strategies for the quality and yield improvement of essential oil. Phytochem Rev.. 2021;21(3):879-913.
- [CrossRef] [Google Scholar]
- Effect of seasonal variation on growth and oil yield in Ocimum africanum Lour. J. Pharmacogn. Phytochem.. 2018;7(3):73-77.
- [Google Scholar]
- Raman spectroscopy as an analytical tool for analysis of vegetable and essential oils. Flavour Fragr. J.. 2014;29(5):287-295.
- [Google Scholar]
- Handled Raman spectroscopy for the distinction of essential oils used in the cosmetics industry. Cosmetics. 2015;2(2):162-176.
- [Google Scholar]
- GC-MS analysis of essential oil of Ocimum gratissimum L. growing desolately in South India. Acta Chromatogr.. 2017;29(1):111-119.
- [Google Scholar]
- Influence of cutting and harvest day time on the essential oil of lemon balm (Melissa officinalis L.) J. Essent. Oil-Bear. Plants. 2009;12(3):348-357.
- [Google Scholar]
- Quantitative analysis of essential oil of Thymus daenensis using laser-induced fluorescence and Raman spectroscopy. Appl. Opt.. 2015;54(32):9533-9539.
- [Google Scholar]
- Raman spectroscopy coupled with chemometric modelling approaches for authenticathin of different paprika varieties at physiological maturity. LWT- Food Sci. Technol.. 2022;162
- [CrossRef] [Google Scholar]
- Developments in food sciences. In: Lawrence B.M., Mookherjee B.D., Willis B.T., eds. Flavour and Fragrance: A World Perspective. Amsterdam: Elsevier Publication; 1998. p. :22-26.
- [Google Scholar]
- Biosynthesis of estragole and methyl – eugenol in sweet basil (Ocimum basilicum L.). Developmental and chemotypic association of allylphenol o-methyltransferase activities. Plant Sci.. 2000;160(1):27-35.
- [Google Scholar]
- Phytochemical characterization and bioactive properties of Cinnamon Basil (Ocimum basilicum cv. ‘cinnamon’) and lemon basil (Ocimum x citriodorum) Antioxidants.. 2020;9(5):369.
- [CrossRef] [Google Scholar]
- FT-IR and GC-MS analysis of an oxidant leaf essential oil from sage plants cultivated as an alternative to tobacco production. J. Essent. Oil Res.. 2018;31(9):1-7.
- [Google Scholar]
- Studies on the essential oil-bearing plants of Bangladesh. Part VIII. Composition of someOcimum oilsO. basilicum L. var.purpurascens;O. sanctum L. green;O. sanctum L. purple;O. americanum L., citral type;O. americanum L., camphor type. Flavour Fragr. J.. 2002;17(5):335-340.
- [Google Scholar]
- Wresearch, 2021. North America Basil Essential Oil Market (2021-2027). https://www.wresearch.com/industry-report/north-america-basil-essential-oil-market-2021-2027.
- Physiochemical investigation and molecular modeling of cyclodextrin complexation mechanism with eugenol. Food Res. Int.. 2009;42(8):1178-1185.
- [CrossRef] [Google Scholar]
- A diagnostic tool for assessing the conservation condition of cellulose nitrate and acetate in heritage collections: quantifying the degree of substitution by infrared spectroscopy. Herit. Sci.. 2020;8:1.
- [CrossRef] [Google Scholar]
- Essential oil chemotypes of three Ocimum species found in Sierra Leone and Nigeria. Med. Aromatic Plants. 2017;6(2)
- [CrossRef] [Google Scholar]
- Plant Resources of Southeast Asia. Leiden: Backhuys Publishers; 1999.
- Essential oil composition of Ocimum basilicum L. and Ocimum minimum L. in Turkey. Czech J. Food Sci.. 2011;20(No. 6):223-228.
- [Google Scholar]
- Changes in aroma profiles of 11 Indian Ocimum taxa during plant ontogeny. Acta Physiol. Plant.. 2013;35(8):2567-2587.
- [Google Scholar]
- Chemistry and bioactivities of essential oils of some Ocimum species: an overview. Asian Pac. J. Trop. Biomed.. 2014;4(9):682-694.
- [Google Scholar]
- Variability of essential oil constituents of Ocimum africanum. Naresuan University J.. 2009;17(3):269-274.
- [Google Scholar]
- Unveiling the compatibility of eugenol with formulation excipients by systematic drug-excipient compatibility studies. J. Anal. Sci. Technol.. 2015;6:34.
- [CrossRef] [Google Scholar]
- Essential Oils in Food Preservation, Flavor and Safety. London: Elsevier, Academic Press; 2016. p. :231-237.
- Chemo-divergence in essential oil composition among germplasm collection of five Ocimum species from eastern coastal plains of India. J. Essent. Oil Res.. 2017;30(1):47-55.
- [Google Scholar]
- Assesment of the essential oil composition in Ocimum species of Uttarakhand. J. Essent. Oil-Bear. Plants. 2017;20(5):1331-1341.
- [Google Scholar]
- Chemotype characterization and biological activity of Rosmarinus officinalis. Foods. 2016;6(3):20.
- [CrossRef] [Google Scholar]
- Rapid classification of basil chemotypes by various vibrational spectroscopy methods. J. Agric. Food Chem.. 2003;51(9):2475-2481.
- [Google Scholar]
- Raman analysis of Caraway (Carum carvi L.) single fruits. Evaluation of essential oil content and its composition. J. Agric. Food Chem.. 2010;58(9):5271-5275.
- [Google Scholar]
- Antioxidant and cytotoxic activities of essential oil of Ocimum canum Sims. from India. J. Saudi Chem. Soc.. 2012;19(1):97-100.
- [Google Scholar]
- Essential oils as natural sources of fragrance compounds for cosmetics and cosmeceuticals. Molecules.. 2021;26(3):666.
- [CrossRef] [Google Scholar]
- Silva, M.K. do N., Carvalho, V.R.D.A., Matias, E.F.F., 2016. Chemical profile of essential oil of Ocimum gratissimum L. and evaluation of antibacterial and drug resistance-modifying activity by gaseous method. Pharmacogn. J. 8 (1), 4-9.
- Simon, J.E., Quinn, J., Murray, R.G., 1990. Basil. A source of essential oil. Janick and J. E. Simon (eds.), Advances in new crops. Timber press, Portland, O R. 484-489.
- Essential oil in Holy basil (Ocimum tenuiflorum L.) as influence by planting dates and harvest time in North Alabama. J. Med. Act. Plants.. 2014;2(3):33-41.
- [Google Scholar]
- Aromatic profiles of essential oils from five commonly used Thai Basils. Foods. 2018;7(11):175.
- [CrossRef] [Google Scholar]
- Genetic diversity of Ocimum gratissimum L. based on volatile oil constituents, flavonoids and RAPD markers. Biochem. Syst. Ecol.. 2001;29(3):287-304.
- [Google Scholar]
- Essential oil comosition from twelve varieties of Basil (Ocimum spp.) grown in Columbia. J. Braz. Chem. Soc.. 2003;14(5):744-749.
- [Google Scholar]
- Rapid evaluation and quantitative analysis of eugenol derivatives in essential oils and cosmetic formulations on human skin using attenuated total reflectance-infrared spectroscopy. Spectroscopy. 2011;26:43-52.
- [CrossRef] [Google Scholar]
- Discrimination between the grain of spelt and comm0on wheat hybrids and their potential forms using Fourier Transform Infrared-Attenuated Total Reflection. Int. J. Food Prop.. 2015;18(1):54-63.
- [CrossRef] [Google Scholar]
- Effect of harvest stage and diurnal variability on yield and essential oil content in Mentha x piperita L. Plant Soil Environ.. 2021;67(7):417-423.
- [Google Scholar]
- Variation of chemical composition of essential oils in wild populations of Thymus algeriensis Boiss. et Reut., a North African endemic species. Lipids Health Dis.. 2012;11(1):28.
- [Google Scholar]


