

Translate this page into:
Variations of heat exhaustion rate of pilgrims with environmental conditions during hajj seasons between 2002 and 2018 in Makkah, Saudi Arabia
-
Received: ,
Accepted: ,
This article was originally published by Elsevier and was migrated to Scientific Scholar after the change of Publisher.
Abstract
Heat exhaustion (HE) is one of the major concerns for medical service providers, especially in hot weather conditions. Every year pilgrims come to Makkah in Saudi Arabia to perform hajj rites which require a lot of physical effort. Makkah has a very hot climate, especially in the summer. Several cases of HE have been reported among pilgrims. The rate of heat exhaustion (HER) among pilgrims was studied using five climatic factors such as temperature (T), relative humidity (RH), heat index (HI), total solar radiation (TSR) and wind speed (WS) during the Hajj seasons between 2002 and 2018 in Makkah. These factors were measured using data collected by the weather stations owned by The Custodian of the Two Holy Mosques Institute for Hajj and Umrah Research at Umm Al-Qura University in Makkah. There is a roughly 11 days difference between solar and lunar years. Occurring in the 12th lunar month of the Islamic calendar, the Hajj is rotating by about 11 days each year. As a result, it will coincide with each month of the solar calendar in a period of about 32 years. Therefore, the HER values ranged between 0.18 per 105 in the winter of 2005 to 35.97 per 105 in the summer of 2018. Simple and multiple linear regression analysis revealed a very high linear relationship among most climate factors and HER (multiple R (MR) ≥ 79 %, R2 ≥ 63 % and P < 10−4). Seven different equation groups of climate factors were applied to predict HER values and showed a very high correlation (MR ≥ 91 %, R2 ≥ 83 % and P ≤ 0.001). Further studies of HER are needed, especially in terms of medical, environmental, demographic, and social sciences in Makkah.
Keywords
Heat exhaustion
Heat index
Hajj
Makkah
Relative humidity
Temperature

1 Introduction
Heat Exhaustion (HE) becomes one of the major concerns for medical services, especially in warm and hot weather conditions. HE is a condition resulting from the overheating of one’s body. Some of the symptoms of HE may include heavy sweating and a rapid pulse. HE is one of the three heat-related syndromes, with heat cramps being the mildest and heat stroke being the most severe of the three. Causes of heat exhaustion include exposure to high temperatures, particularly when combined with high humidity, and strenuous physical activity. Prompt treatment usually prevents heat cramps from progressing into heat exhaustion. It includes drinking fluids or sports drinks containing electrolytes, getting into cooler temperatures such as an air-conditioned or shaded place, and resting. Without prompt treatment, heat exhaustion can lead to heat stroke, a life-threatening condition. HE occurs when one's thermoregulatory capacity is overwhelmed due to imbalances between metabolic heat production and heat dissipation by means of evaporation, radiation, convection, or conduction (Armstrong et al., 2007; Grundstein et al., 2017). During an outdoor exercise in the hot weather conditions, the rate of the rise in internal body temperature is directly influenced by the absolute evaporative requirement needed to maintain heat balance, which is increased as the air temperature, and work output increase (Cramer and Jay, 2016). When the maximum possible evaporative heat loss exceeds the rate of evaporative heat loss required, a state of uncompensable heat stress ensues (Cramer and Jay, 2016). During uncompensable heat stress, the sustained rise in body temperature could lead to cell anoxia, gastrointestinal permeability, cardiovascular collapse, and inflammatory reactions (Epstein and Yanovich, 2019). Other studies have shown the relationship between exertional heat stroke (EHS) and environmental conditions such as high temperature and humidity. EHS is an emergent hyperthermic condition that occurs in individuals performing physical activity, typically in warm environments (Bouchama and Knochel, 2002; Casa et al., 2012), but can also occur with exertion or impaired heat dissipation in cool environments (Roberts, 2006). EHS is characterized by severe hyperthermia (>40.5 °C) and results in organ dysfunction, which typically manifests as central nervous system (CNS) dysfunction (Casa et al., 2000). The New Balance Falmouth Road Race held in Falmouth, Massachusetts, U.S.A. is a short distance race (11.26 km) that is well-known for high rates of EHS (Grundstein et al., 2019). Their results indicated that runners who experience an EHS do not appear to reduce their average pace with increasing wet bulb globe temperatures (WBGT) warning flag categories. They mentioned that runners who had suffered an EHS run at a faster average pace than others, even when controlling for age, gender, race performance, and starting time WBGT. Moreover, the association between exertional heat stroke (EHS) and sex, age, prior performance, and environmental conditions was reported on resources needed for EHS cases at the Boston Marathon (Breslow et al., 2021). They calculated the EHS occurrence for each race as the number of events divided by the number of starters; and reported them as EHS cases per 10,000 starters for each race year and cumulatively over the 5-years period. They also used Poisson regression to simultaneously assess the association between age, sex, and starting wave on EHS incidence. They showed significant associations between sex and age (P < 0.0001), sex and start wave (P < 0.0001), and age group and start wave (P < 0.0001). Although sex was not significantly associated with increased EHS incidences, they found that age younger than 30 years and assignment to the first two start waves were significant. In addition, the effect of environmental conditions on the occurrence of exertional heat illnesses (EHIs), especially exertional heat stroke (EHS), was studied by some studies (DeMartini et al., 2014; Divine et al., 2018; Games et al., 2020). They studied the incidence of EHI, specifically EHS, as related to ambient temperature (Tamb), relative humidity (RH), and heat index (HI). For example, they reported that in the Falmouth Road Race cases the number of EHS was 274 cases which accounted for 70 % of the total cases of EHI of 393 (DeMartini et al., 2014). They concluded that the occurrences of EHS (24.2 ± 15.5 cases versus 9.3 ± 4.3 cases) and EHI (32.3 ± 16.3 versus 13.0 ± 4.9 cases) were higher when Tamb and HI were high compared with when Tamb and HI were low (DeMartini et al., 2014). Other environmental conditions such as seasonal acclimatization, vegetation cover, cold surfaces, tree canopy cover, cloud cover, wind speed and shading were studied and found that these factors are inversely related to EHI and EHS (Heidari et al., 2020).
The Arabian Gulf region, such as Saudi Arabia, has been experiencing extremely hot and humid (EHH) weather, which directly affects construction workers’ health and safety (Moohialdin et al., 2022). They addressed the problem of EHH weather conditions and their impacts on construction workers’ physiological status. Their results provided empirical evidence that the recorded Heart Rate (HR) exceeded the acceptable physiological zones for construction workers exposed to extremely hot and humid weather conditions. They reported that physical body parameters, work activities, and worker status significantly influenced construction workers’ physiological responses. It was reported that high temperatures increase morbidity, mortality (Gasparrini et al., 2017; Vicedo-Cabrera et al., 2021), migration (Mueller et al., 2014), and can reduce educational outcomes (Garg et al., 2020; Park et al., 2021), cognitive performance (Masuda et al., 2020), and economic output (Burke et al., 2015; Carleton and Hsiang, 2016). Heat effects vary spatially, with outdoor workers in low- and middle-income countries in the low latitudes facing the greatest exposure to humid heat (Burke et al., 2015; Chavaillaz et al., 2019; de Lima et al., 2021; Kjellström et al., 2019). As a result, high temperature and humidity can effectively affect the people and workers outcomes especially in hot weather in the summer times.
Saudi Arabia is a country in Western Asia (1100 m altitude, 23.8859° N, 45.0792° E) and has an area of approximately 2,150,000 km2. Makkah (280 m altitude, 21°0.42 N, 39°0.82 E) is the holy capital of the Kingdom of Saudi Arabia and the holy city of Muslims in the world. A solar year (the time it takes Earth to orbit the sun) lasts around 365 days, while a lunar year, or 12 full cycles of the Moon, is roughly 354 days. Because of this discrepancy, a purely lunar calendar (the Islamic, or Hijri, calendar) doesn't stay aligned with the seasons. There is a roughly 11 days difference between solar and lunar years. Occurring in the 12th lunar month of the Islamic calendar, the Hajj is rotating by about 11 days each year. As a result, it will coincide with each month of the solar calendar in a period of about 32 years. During the hajj season every year, Muslims from all over the world begin to gather in Makkah from the beginning of the month of Dhul-Qa'dah (the eleventh month in the Islamic Hijri calendar that is based on the lunar year) to the beginning of month of Dhul-Hijjah (the last month, 12, of Islamic Hijri calendar). All pilgrims move on the 8th of Dhul-Hijjah to Mina valley (about 7 km to the east of the Grand Mosque known as al Haram) to stay for one night at the valley before they proceed to Arafat (about 12 km to the south) on the morning of 9th of Dhul-Hijjah. The ninth of Dhul-Hijjah is also known as the “Al-Wakffah Day“. Then in the early morning of the 10th of Dhul-Hijjah, most pilgrims go to the Grand Mosque (al Haram) to do Tawaf Al-Efadah (circumambulate 7 times around the Kaabah). They then return to Mina to stay the 11th, 12th and 13th of Dhul-Hijjah also known as al-Tashreeq days. They sleep in the tents at Mina to perform their hajj rites. During these days, pilgrims perform many of the rites of Hajj such as going to the Grand Mosque for prayer and circumambulation and going to the Jamarat Bridge to throw the Jamarat (small stones) at the symbolic Satan. Hence, the pilgrims make a lot of physical effort in the hot and humid climate, considering the severe crowding during most days of the Hajj.
This study aims to assess the heat exhaustion rate (HER) of pilgrims with different climate factors. These factors include temperature (T), relative humidity (RH), heat index (HI), total solar radiation (TSR) and wind speed (WS) during the Hajj seasons between 2002–2018 (1422–1439 AH as in the Islamic Hijri calendar) in Makkah. The other objective of the study is to study the relationship between climate factors and HER and to predict future HER values.
2 Materials and methods
The climate factors such a T (Celsius, oC), RH (%), HI (oC), TSR (W/m2) and WS (m/s) at the weather stations of The Custodian of the Tow Holy Mosques Institute for Hajj Research, Umm Al-Qura University in Makkah, Saudi Arabia were measured. These weather stations were installed in Makkah in 2001. The average measurements of climate factors were taken for the last two Hijri months from the beginning of Dhul-Qa'dah (1st/11/1422 AH) until the end of Dhul-Hijjah (30th/12/1439 AH) corresponding to between 2002 and 2018. The heat index (HI) was calculated from the measured air temperature (T) and the measured relative humidity (RH). The measured air temperature is given in Celsius (°C) and then converted to degrees Fahrenheit (°F). The measured RH was given as a percentage (%). Then HI can be calculated using complex formula (1) and then HI is re-converted to Celsius unit (°C):
In 2006 there were two Hajj seasons 1426 AH and 1427 AH. The annual total number of pilgrims and the number of annual HE cases of pilgrims were taken from the Statistical Yearbook of the Ministry of Health (Ministry of health, 2002–2018). Then HER of the pilgrims was calculated for each year from 2002 to 2018 in Makkah using the following formula in unit of (/105):
2.1 Statistical analysis
Linear regression statistical analysis was calculated to determine the fit of HER with different climate factors at environmental conditions. There are two types of linear regression, one is simple linear regression, and the other is multiple regression. Both were applied in the study to examine the relationship between the incidence of HER and other climate factors. Linear regression statistics included multiple R (MR), R square (R2) and a significant P value. Multiple R is the multiple correlation coefficient that explains the strength of the relationship between the independent variable and the dependent variable. Hence, if the multiple R of a model was 0.85, then the strength of the relationship between the independent variable and the dependent variable is very high and equals to approximately 85 %. Furthermore, R2 is a statistical measure of fitness indicating the amount of variance in the dependent variable(s) that is explained by the independent variable(s) in the regression mode. Therefore, if the R2 of a model is 0.50, approximately half of the observed variance of the dependent variable can be explained by the model's inputs. A p-value is a statistical measurement used to validate a hypothesis against observed data and to measure the probability of obtaining the observed results, assuming that the null hypothesis is true. P-value less than 0.05 (<0.05) is statistically significant and indicates strong evidence against the null hypothesis, while if the P-value is larger than 0.05 (>0.05) then it is not statistically significant and indicates strong evidence for the null hypothesis. The statistical analysis was performed using the Data Analysis function in Microsoft excel program version 365.
3 Results and discussion
3.1 Data trends of climate elements and HER
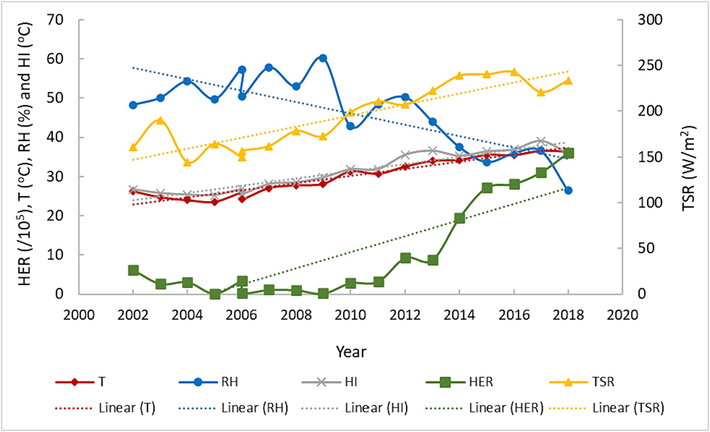
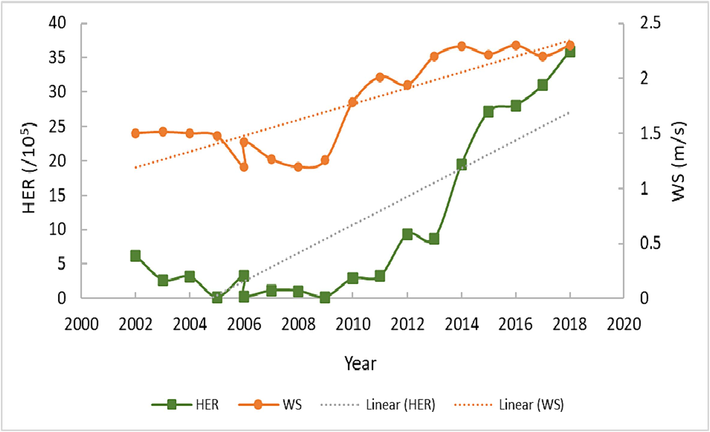
The average measurements of the climate elements of T, RH, HI, TSR and WS and HER values between 2002 and 2018 are listed in Table 1 and presented in Fig. 1 (for T, RH, HI and TSR) and in Fig. 2 for WS for greater clarity. Generally, the trend of HER values was increasing with T, HI and TSR values from 2002 to 2018. This is due to the decrease of the incident solar zenith angle over Makkah (Seroji, 2010) during the transition of the Hajj month from winter to summer according to the change of the Hijri calendar compared to the Gregorian calendar. Accordingly, between 2002 and 2006 the month of Hajj fell in the winter. It fell in the autumn between 2007 and 2014 and in the summer between 2015 and 2018. Hence, the values of T, HI and TSR increase with decreasing solar zenith angle (SZA) which leads to a higher rate of HER occurrence. It was also observed that the HER values increased with the increase in WS values (Fig. 2). As a result, there are direct relationships between the incidence of HER and the four climate elements of T, HI, TSR and WS. Nevertheless, RH showed an inverse relationship with HER as it decreased over the years, showing behavior opposite to the other four factors in the winter and summer seasons continuously. However, this inverse correlation decreased with the summer. This might be due to the increased rainfall during the winter season in general and thus higher levels of relative humidity compared to the summer season in Makkah. Therefore, each climatic factor has its own influence on the incidence of HER.
Year (Gregorian)
Year (Lunar)
HER
(/105)T
(oC)RH
(%)HI
(oC)TSR
(W/m2)WS
(m/s)
2002
1422
6.16
26.3
48
26.7
161.0
1.50
2003
1423
2.69
24.8
50
25.8
190.1
1.51
2004
1424
3.13
24.0
54
25.4
144.1
1.50
2005
1425
0.18
23.6
50
25.2
164.3
1.47
2006
1426
3.37
25.9
57
26.8
149.8
1.19
2006
1427
0.34
24.2
50
25.5
156.5
1.42
2007
1428
1.14
27.1
58
28.1
161.9
1.26
2008
1429
1.08
27.8
53
28.5
178.4
1.19
2009
1430
0.22
28.2
60
29.7
172.7
1.25
2010
1431
2.87
31.3
43
31.8
198.8
1.78
2011
1432
3.24
30.7
48
31.9
210.7
2.01
2012
1433
9.30
32.6
50
35.6
207.3
1.94
2013
1434
8.74
34.0
44
36.6
222.3
2.20
2014
1435
19.52
34.3
37
35.3
239.1
2.29
2015
1436
27.14
35.6
34
36.4
240.3
2.22
2016
1437
28.07
35.5
36
36.9
242.8
2.30
2017
1438
31.04
36.6
37
39.1
221.1
2.20
2018
1439
35.97
36.4
26
35.9
233.6
2.30
Mean ± SD
29.9 ± 4.7
46 ± 9
31.2 ± 4.9
194.1 ± 34.0
1.75 ± 0.43
The average measurements of T, RH, HI, TSR and HER between 2002 and 2018 in Makkah.
The average measurements of WS and HER between 2002 and 2018 in Makkah.
3.1.1 The incidence of heat exhaustion rate (HER) of pilgrims
The total number of HER cases for pilgrims in the Hajj months from 2002 to 2018 was approximately 184.19 per 105 and the summer cases accounted for 122.22 per 105 (66 %) of the total. The HER values were increasing from 0.18 per 105 in the winter of 2005 to 35.97 per 105 in summer of 2018 (Table 1). This is because pilgrims feel very tired in the high ambient temperatures in the summer, which leads to an increase in cases of heat exhaustion for pilgrims. The HER values vary with the seasons, and therefore are dependent on the surrounding weather conditions.
3.1.2 The incidence of HER versus T
The average measured T was ranging between 23.6 and 36.6 °C with mean value of 29.9 ± 4.7 °C (Table 1). Simple linear regression analysis of HER against T revealed a very high direct relationship between them showing values of MR = 84 %, R2 = 71 % and P = 1.04*10−5 (P <10−4) Fig. 3. This result supported the result of another study that showed a high direct relationship between the incidence of exertional heat illness (EHI) cases and Tamb with the same R2 = 71 % but larger P value of 0.001 (DeMartini et al., 2014). It was also observed that the highest HER value (35.97 per 105) was recorded in the hottest conditions (36.6 °C) in the summer of 2018, while the lowest HER value (0.18 per 105) was recorded in the coldest conditions (23.6 °C) in the winter of 2005. This is because pilgrims get very tired in the high ambient temperatures in the summer compared to winter. The positive linear equation for calculating the dependent variable of HER from the independent variable of T is shown in Fig. 3 and can be used to predict HER from T with accuracy of up to 72 % (R2 value).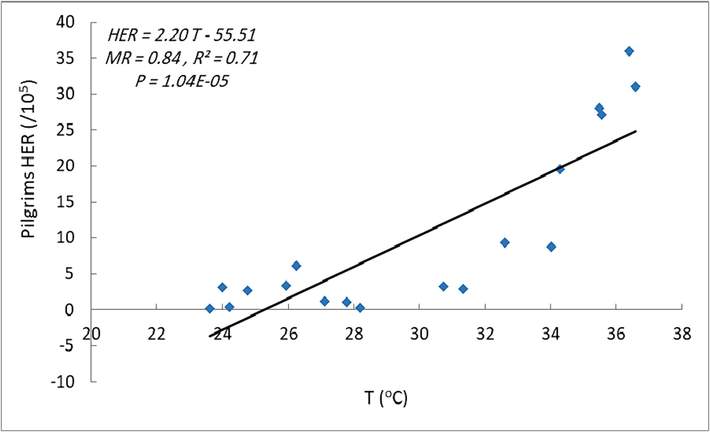
Simple linear regression analysis of the incidences of HER versus T.
3.1.3 The incidence of HER versus RH
The average measured RH was ranging between 26 and 60 % with mean value of 46 ± 9 % (Table 1). Simple linear regression analysis of HER against RH revealed a very high inverse linear relationship between them showing values of MR = 90 %, R2 = 81 % and P = 4.36*10−7 (P < 10−6) (Fig. 4). This result differed with the result of another study that reported a non-significant relationship (R2 = 22 % and P = 0.128) between the incidence of EHI cases and RH (DeMartini et al., 2014). This may be due to the relative warming prevailing in the years 2003, 2005 and 2007 included in this study (DeMartini et al., 2014), as the highest incidence of the disease was recorded in these years 2003, 2005 and 2007 at these high temperature levels of (27.7 °C, 26.0 °C and 25.3 °C respectively. Additionally, in DeMartini's study, there were very high incidence values of EHI cases affecting the average age of 18 years with the number of cases rising to 61 in 2003 compared to fewer cases of 33 and 39 in 2005 and 2007 respectively. Hence, it is expected that the EHI cases in these years, in DeMartini's study, were mainly affected by the higher temperatures more than by the higher relative humidity in the years in question. This is confirmed by the lowest Environmental Health Index (EHI) level of 7 in 1992 when the temperature was 17.2 °C and the relative humidity was the highest value of 92 %. In fact, this is the only study that reported no significant relationship between EHI and RH on researchers' knowledge level. However, this study and other recent studies (Divine et al., 2018; Games et al., 2020; Heidari et al., 2020; Hosokawa et al., 2018; Miller et al., 2017) confirmed that there is a statistically significant relationship between the incidence of HER and RH. Furthermore, the values of MR and R2 in terms of RH are relatively higher than those in in terms of T. The highest HER value was at the lowest RH (26 %) in the summer 2018, while the lowest HER value was recorded at RH of 50 %.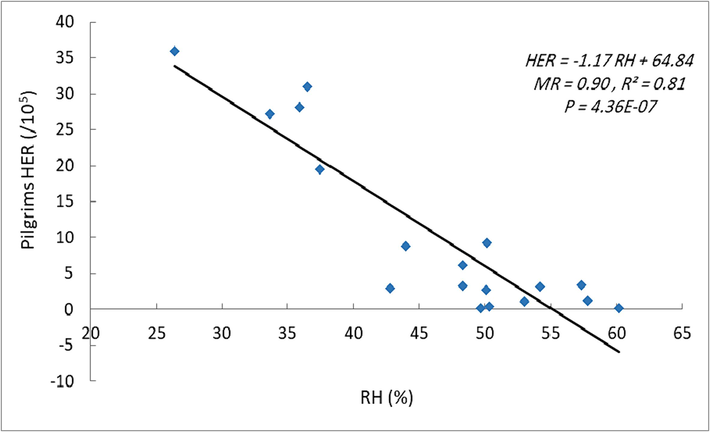
Simple linear regression analysis of the incidences of HER versus RH.
3.1.4 The incidence of HER versus HI
The average HI values were calculated using equation (1) and were ranging between 25.2 and 39.1 °C with mean value of 31.2 ± 4.9 °C (Table 1). Simple linear regression analysis of HER versus HI revealed a very high direct linear relationship between them showing values of MR = 80 %, R2 = 64 % and P = 6.32*10−5 (P < 10−4) (Fig. 5). These results also supported the result of another study that reported a high direct relationship between the incidence of EHI cases and HI with values of R2 = 76 % and P < 0.001 (DeMartini et al., 2014). The values of MR and R2 in terms of HI are lower than those in in terms of T and RH. The incidence of HER showed the highest value at HI value of 35.9 °C in the summer of 2018 (Table 1). This may be due to a high temperature of 36.4 °C and a lower relative humidity of 26 % in 2008 compared to a similar high temperature of 36.6 °C and a higher relative humidity of 37 %. As a result, the combination of a 36.4 °C rise in temperature and a 26 % drop in relative humidity in 2018 resulted in higher HER rates than in 2017. Moreover, there may be other factors affecting the number of cases such as pilgrims staying for a long time outside the camp, especially on Arafat Day, as most pilgrims prefer to go out in the afternoon to stay near the Arafat Mosque and outside it, next to the Mount of Mercy in Arafat. Since this study aims to estimate the relationship between the occurrence of EHIs and other ambient weather conditions over the past few years to get a general idea of how they relate to each other, it may be difficult to consider the full factors in detail here for each year. However, the highest value of HI was observed in the summer 2017 with the second highest HER value of 31.0 per 105. These small differences in the highest and the lowest values between HI and HER are acceptable and can be considered identical due to the small differences (only a 3-unit) the measurements were averaged over two months. The lowest value of HER was observed at the lowest HI value of 25.2 °C in the winter 2005.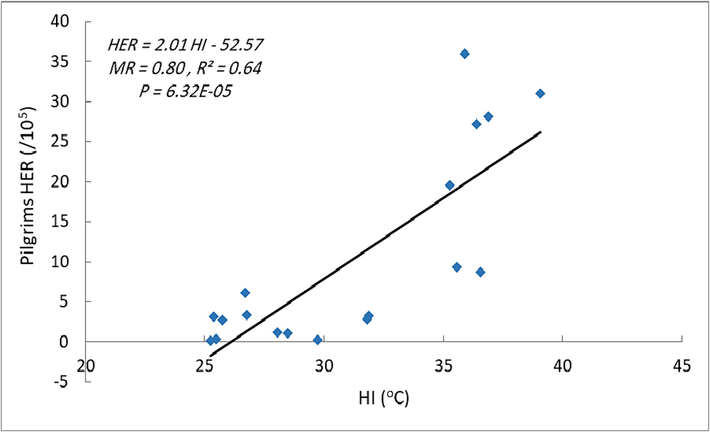
Simple linear regression analysis of the incidences of HER versus HI.
3.1.5 The incidence of HER versus TSR
The average measured TSR was ranging between 144.1 – 242.8 W/m2 with mean value of 194.1 ± 34.0 W/m2 (Table 1). Simple linear regression analysis of HER versus HI revealed a very high direct linear relationship between them (MR = 79 %, R2 = 63 % and P = 9.07*10−5 P < 10−4) (Fig. 6). The values of MR and R2 of TSR are similar to that of HI values and both are lower than those in in terms of T and RH. Thus, the correlation between TSR and the incidence of HER was relatively lower than those between both T and RH with HER. The highest value of HER was recorded at the third highest value of TSR of 233.6 W/m2 in the summer 2018 (Table 1), while the lowest HER value (0.18 per 105) was observed at TSR value of 164.3 W/m2 in the winter 2005.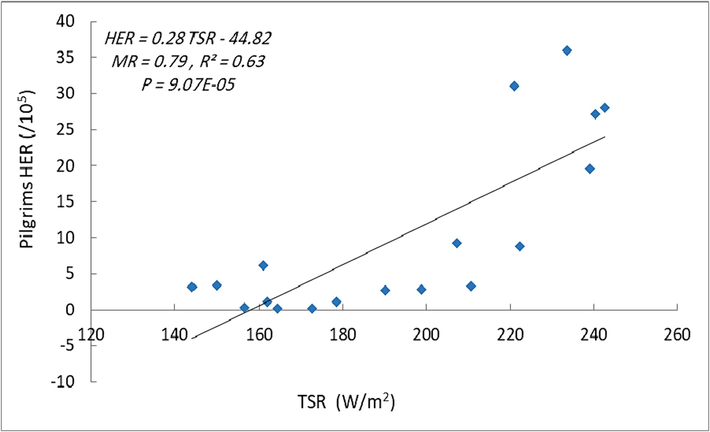
Simple linear regression analysis of the incidences of HER versus TSR.
3.1.6 The incidence of HER versus WS
The average measured WS was ranging between 1.19 and 2.30 m/s with mean value of 1.75 ± 0.43 m/s (Table 1). Simple linear regression analysis of HER versus WS revealed an acceptable direct linear relationship showing values of MR = 82 %, R2 = 67 % and P = 3.54*10−5 (P < 10−4) (Fig. 7). As a result, WS has shown the third highest correlation with HER among other climate elements, while TSR was the lowest. However, all climate elements have shown statistically significant relationship (P < 0.05) with HER. The highest HER value was recorded at the highest WS value of 2.30 m/s in the summer 2018, while the lowest HER value was recoded at WS of 1.47 m/s in the winter 2005 (Table 1). It was expected that as the wind speed (WS) increased, the evaporation of sweat from the bodies of pilgrims would increase, leading to a decrease in body temperature and thus leading to a decrease in HER cases. However, it must be noted here that this increase in wind speed occurred in the summer of 2018, and therefore it is expected that there are other factors that interfere with wind speed in influencing HER cases, such as air temperature, solar radiation, and increased crowding and movement among pilgrims at noon, which increases the effort made by the pilgrims. All these factors may lead to an increase in HER despite high wind speeds, as these factors interact with each other and influence each other in influencing the number of HER cases. Nevertheless, further investigation into the impact of WS related to the number of HER cases is needed in the future to clarify its true role.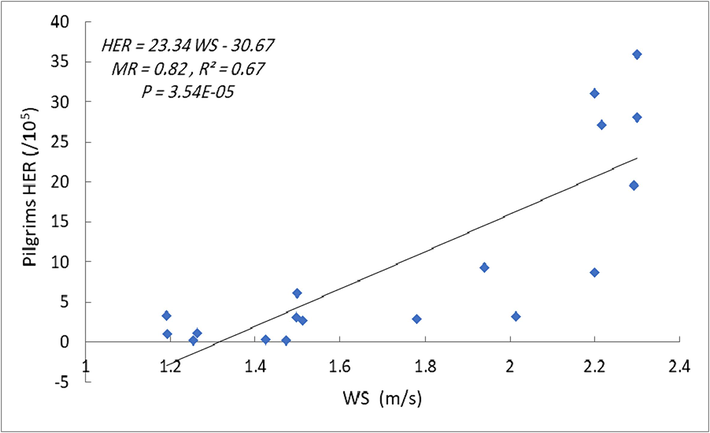
Simple linear regression analysis of the incidences of HER versus WS.
3.1.7 The incidence of HER versus different groups of T, RH, HI, TSR and WS
Multiple linear regression analysis was performed to find the best correlation between the incidence of HER versus seven different groups of climate elements. The collinearity among these variables of interest were checked and controlled. The regression analysis output factors of MR, R2, and P values with their linear equations are presented in Table 2. It has been observed that the higher the number of climate elements used, the greater the correlation between the observed and predicted HER values. Hence, the greatest correlation occurred when the five climatic elements were used together as in group 7, while the relatively lowest correlation was observed in groups of three climatic elements (see Table 2). The minimum values of MR and R2 were 92 %, 85 %, while the maximum value of P was 4.91*10−5 confirming that all seven equations have a very high correlation and can be trusted to predict the cases of HER pilgrims in Makkah.
Group
No.Climate elements
MR
(%)R2
(%)P value
HER Equation
(/105)
1
T, RH, HI
92
85
5.11*10−6
HER = 0.44 T − 0.85 RH + 0.39 HI + 24.39
2
T, RH, TSR
93
87
1.95*10−6
HER = 1.68 T − 0.96 RH − 0.15 TSR + 33.73
3
T, RH, WS
93
86
3.37*10−6
HER = 1.25 T − 0.98 RH − 7.77 WS + 31.97
4
T, RH, HI, TSR
93
87
1.09*10−5
HER = 1.05 T − 1.02 RH + 0.55 HI − 0.15 TSR + 39.11
5
T, RH, HI, WS
93
86
1.51*10−5
HER = -0.44 T − 1.21 RH + 1.67 HI − 12.33 WS + 49.09
6
T, RH, TSR, WS
93
87
1.14*10−5
HER = 1.72 T − 1.01 RH − 0.13 TSR − 3.2 WS + 36.58
7
T, RH, HI, TSR, WS
93
87
4.91*10−5
HER = 0.33 T − 1.19 RH + 1.33 HI − 0.12 TSR − 7.24 WS + 49.81
3.2 Prediction of the HER values at different weather conditions
The seven group equations were used in this study to predict the HER values at two seasons of fall and summer from 2011 to 2018. The winter years and some of fall years are excluded here due to the very low values of HER in the years between 2002 and 2010. For this reason, when applying the predicted equations in the years between 2002 and 2010 they gave very high difference between the observed values and the expected ones. Therefore, more accurate results can be obtained when HER values are relatively high as in the years from 2011 onwards until the Hajj months moved into the summer season. The observed and predicted HER values from seven equations between 2011 and 2018 in Makkah are presented in Fig. 8. A very good correlation between the observed and predicted values of HER with very high correlation values of 91 %≤ MR ≤ 97 %, 83 %≤ R2 ≤ 93 % and 0.0001 %≤ P ≤ 0.001. In addition, the summer seasons showed higher observed HER values compared to the predicted ones, while fall seasons showed lower observed values. The average percentage differences between the observed and predicted values were calculated and found to range from −16.4 % ± 6.9 % to −4.6 % ± 0.8 %. These are low percentage differences, and therefore the predicted equations gave very good results and could be used with confidence to predict future HER case numbers in Makkah. Thus, protecting pilgrims from heat exhaustion and heat stroke can be considered and implemented in the future Hajj plans, especially when Hajj occurs in the summer. It is proposed to use Group Equation (1) in predicting the number of HER cases in the future, where only two factors RH and HI need to be entered and these factors are always available at most meteorological stations. Such an equation is more suitable in most cases as it has the same accuracy level as the other equations.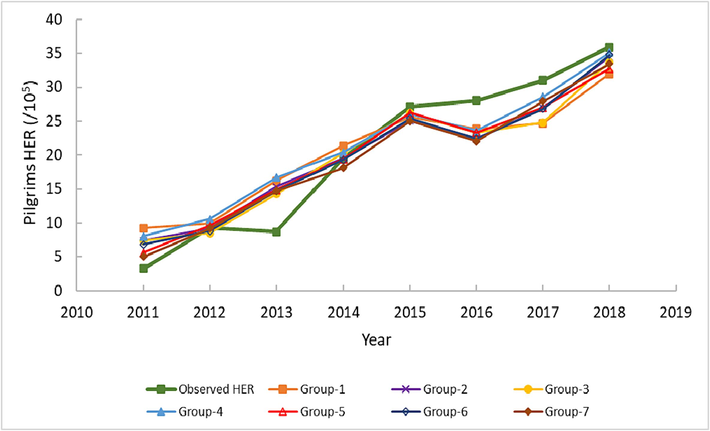
The observed and predicted HER values from seven groups between 2011 and –2018 in Makkah.
3.3 The efforts of the Kingdom of Saudi Arabia to protect pilgrims from HER
In fact, the government of the Kingdom of Saudi Arabia has made many efforts to provide services in a safe, secure, and appropriate environment for pilgrims during their stay in Makkah and in the holy places. For example, it has built many water mist fountains in Arafat and Mina to reduce ambient temperatures and to provide more favorable weather conditions especially in the daytime. It also adapted all the tents in Arafat and Mina. Furthermore, the government of the Custodian of the Two Holy Mosques has established many health centers and hospitals everywhere in the holy sites. To facilitate ease of movement for the pilgrims, the government has established multiple modes of transportation such as trains, buses, large vehicles, and shaded pedestrian paths. Cool bottled drinking water is distributed free of charge throughout the holy places and around the Grand Mosque. The Ministry of Health offers many health awareness programs through national channels and various social media channels during the Hajj season to protect pilgrims against diseases. Moreover, raising the awareness of pilgrims about the danger of heat exhaustion and heat stroke in their country before coming to Hajj is very important. Efforts are exerted tirelessly to raise the awareness of the pilgrims to protect themselves against harmful, but avoidable diseases. For example, pilgrims are urged to reduce their exerted efforts during their stay in Makkah and during their commute between their residences and the Grand Mosque or between Makkah and the holy places especially peak heat times such as around the noon. They are also advised to drink as much water and fluids as possible for most of the day. It is preferable to wear soft clothing (Hosokawa et al., 2018) that allow sweat to evaporate easily and use sunshades while they are staying outside and moving outside, especially in the afternoon. It is also desirable to delay some of the rituals of Hajj from day to night if the religion allows it. For example, to reduce exertion stoning the Jamarat can be performed at night. All these tips should be kept in mind in a comprehensive Hajj plan and need continuous evaluation and improvement.
As this was a retrospective study design that evaluated many years (18 years) of Hajj data, it was not possible for the study to collect demographic information of the pilgrims present. For example, it was not known whether pilgrims possessed other predisposing factors for heat exhaustion, such as fitness status, thermoacclimatization status, water condition, ages, gender, nationalities, etc. Therefore, it is possible that linear regression analysis of such factors may have altered the contribution of climatic elements of interest to the occurrence of HER incidents. However, the climate elements contributions here were very high as analysis has shown. All these factors and other environmental conditions such as seasonal acclimatization, hot surfaces, tree canopy cover, cloud cover, precipitation and shading need to be investigated in terms of HE and HS.
4 Conclusion
The incidence of heat exhaustion (HER) of pilgrims with various climate factors during Hajj seasons between 2002 and 2018 in Makkah were studied. The HER values ranged between 0.2 per 105 in the winter of 2005 to 36 per 105 in the summer 2018. Statistical analysis of linear regression revealed a very high linear relationship between climate elements and HER values (MR ≥ 79 %, R2 ≥ 63 % and P value < 10−4). Predicted equations of HER values from single climate factor and seven different groups of climate elements were applied and compared with the observed values showing a very high correlation with the observed HER values (MR ≥ 91 %, R2 ≥ 83 % and P < 0.001). TSR showed the lowest relative correlation with HER among the climate components. It was found that the more climatic elements used in the equation, the greater the correlation. Although the correlation between the observed and predicted HER values was very high in fall and summer seasons, it was limited in the winter. The HER values are very important in terms of the future comprehensive plan of the Hajj in the following years to protect the pilgrims from heat exhaustion and heat stroke. Further studies in the medical, environmental, demographic, and social sciences on heat exhaustion (HE) and heat stroke (HS) are needed to increase our understanding of facing such challenges, especially in hot weather seasons.
Acknowledgment
All thanks and gratitude to Umm Al-Qura university and the Custodian of the Two Holy Mosques Institute of Hajj and Umrah Research in Makkah for their financial support of this study. I also thank the Ministry of Health for making its reports on heat exhaustion available on its website.
Disclosure of funding
This research was funded by Umm Al-Qura university in Makkah, Saudi Arabia.
Declaration of competing interest
The authors declare that they have no known competing financial interests or personal relationships that could have appeared to influence the work reported in this paper.
References
- American College of Sports Medicine position stand. Exertional heat illness during training and competition. Med. Sci. Sports Exerc.. 2007;39:556-572.
- [Google Scholar]
- Breslow, R.G., Collins, J.E., Troyanos, C., Cohen, M.C., D'hemecourt, P., Dyer, K.S., Baggish, A., 2021. Exertional Heat Stroke at the Boston Marathon: Demographics and the Environment. Medicine and Science in Sports and Exercise.
- Global non-linear effect of temperature on economic production. Nature. 2015;527:235-239.
- [Google Scholar]
- National athletic trainers' association position statement: fluid replacement for athletes. J. Athl. Train.. 2000;35:212.
- [Google Scholar]
- O'Connor FG huggins RA. exertional heat stroke: new concepts regarding cause and care. Curr. Sports Med. Rep.. 2012;11:115-123.
- [Google Scholar]
- Exposure to excessive heat and impacts on labour productivity linked to cumulative CO2 emissions. Sci. Rep.. 2019;9:1-11.
- [Google Scholar]
- Biophysical aspects of human thermoregulation during heat stress. Auton. Neurosci.. 2016;196:3-13.
- [Google Scholar]
- Heat stress on agricultural workers exacerbates crop impacts of climate change. Environ. Res. Lett.. 2021;16:044020
- [Google Scholar]
- Environmental conditions and the occurrence of exertional heat illnesses and exertional heat stroke at the Falmouth road race. J. Athl. Train.. 2014;49:478-485.
- [Google Scholar]
- Case series of exertional heat stroke in runners during early spring: 2014 to 2016 Cincinnati flying pig Marathon. Curr. Sports Med. Rep.. 2018;17:151-158.
- [Google Scholar]
- Functional performance of firefighters after exposure to environmental conditions and exercise. J. Athl. Train.. 2020;55:71-79.
- [Google Scholar]
- Temperature and human capital in India. J. Assoc. Environ. Resour. Econ.. 2020;7:1113-1150.
- [Google Scholar]
- Projections of temperature-related excess mortality under climate change scenarios. Lancet Planet. Health. 2017;1:e360-e367.
- [Google Scholar]
- Influence of race performance and environmental conditions on exertional heat stroke prevalence among runners participating in a warm weather road race. In: Frontiers in Sports and Active Living. 2019. p. :42.
- [Google Scholar]
- American football and fatal exertional heat stroke: a case study of Korey stringer. Int. J. Biometeorol.. 2017;61:1471-1480.
- [Google Scholar]
- The effects of climatic and environmental factors on heat-related illnesses: a systematic review from 2000 to 2020. Urban Clim.. 2020;34:100720
- [Google Scholar]
- Environmental condition and monitoring, sport and physical activity in the heat. Springer 2018:147-162.
- [Google Scholar]
- Working on a warmer planet: the effect of heat stress on productivity and decent work. International Labour Organization; 2019.
- Heat exposure from tropical deforestation decreases cognitive performance of rural workers: an experimental study. Environ. Res. Lett.. 2020;15:124015
- [Google Scholar]
- Temperate-water immersion as a treatment for hyperthermic humans wearing American football uniforms. J. Athl. Train.. 2017;52:747-752.
- [Google Scholar]
- Ministry of health, K., 2002 - 2018. Annual statistical yearbook of ministry of health 2002 - 2018, Annual Statistical yearbook of ministry of health, Riyadh, Saudi Arabia., 321-322.
- Physiological impacts on construction workers under extremely hot and humid weather. Int. Arch. Occup. Environ. Health 2022:1-15.
- [Google Scholar]
- Heat stress increases long-term human migration in rural Pakistan. Nat. Clim. Chang.. 2014;4:182-185.
- [Google Scholar]
- Learning is inhibited by heat exposure, both internationally and within the United States. Nat. Hum. Behav.. 2021;5:19-27.
- [Google Scholar]
- Exertional heat stroke during a cool weather marathon: a case study. Med. Sci. Sports Exerc.. 2006;38:1197-1203.
- [Google Scholar]
- The ground ozone variations with UV radiation during winter and spring seasons in 2007 over Makkah. J. King Abdulaziz Univ. Sci. 2010;22:35-55.
- [Google Scholar]
- The burden of heat-related mortality attributable to recent human-induced climate change. Nat. Clim. Chang.. 2021;11:492-500.
- [Google Scholar]


