

Translate this page into:
Validation and application of the square wave voltammetry method for the electrochemical determination of eszopiclone in pharmaceutical formulations and human biological fluids using glassy carbon electrode
-
Received: ,
Accepted: ,
This article was originally published by Elsevier and was migrated to Scientific Scholar after the change of Publisher.
Abstract
A buffer solution of Britton-Robinson (B-R) pH 6.5 was utilized to validate and apply a square wave voltammetry (SWV) method for the electrochemical determination of Eszopiclone (ESP) in pharmaceuticals and biological samples. The cyclic voltammetry (CV) and differential pulse voltammetry (DPV) methods were employed in the initial study of the voltammetric behavior of the ESP compound. The rotating glassy carbon (GC) indicator electrode (2.0 mm2), Pt auxiliary electrode, and Ag/AgCl reference electrode were used for ESP determination. ESP was analyzed to produce a sharp reduction peak at a potential of −750 mV. The best shape and high sensitivity of SWV cathodic current for ESP, were observed using GC electrode, B-R, pH 6.5, accumulation time (tacc) of 60-second, accumulation potential (Eacc) of - 0.1 V, amplitude voltage of 150 mV, frequency of 15 Hz, scan rate of 150 mV s−1, and stirrer rate of 1000 round per minute (rpm). The electroanalytical performance of the SWV method was evaluated through study of repeatability, stability, calibration curve, recovery, and limits of detection and quantification (LOD,LOQ). Under the optimal conditions, the SWV response was linear in the range from 3 × 10⁻⁶ to 5 × 10⁻⁵ mol/L (n = 10). The SWV method achieved a LOD of 1.9 × 10⁻⁸ mol/L (7.5 ppb), and a LOQ of 6.41 × 10⁻⁸ mol L−1 (24.93 ppb). The validated SWV method was appeared the good repeatability, sensitivity and stability for the determination of ESP. It was given a very stable SWV current for 90 min, with a 0.141 % relative standard deviation (RSD%). The SWV method was applied to the determination of ESP in pharmaceutical tablets and biological samples.
Keywords
Square wave voltammetry
Cyclic voltammetry
Differential pulse voltammetry
Reduction
Eszopiclone
GC electrode

1 Introduction
A sedative called Eszopiclone (ESP) is used to treat both acute and persistent insomnia. It is a non-benzodiazepine hypnotic, a type of sleeping pill that induce relaxation to help with falling asleep and staying asleep for a set period. The United State Food and Drug Administration (FDA) approved ESP in 2004 as the first drug for treating insomnia in adults. It is available in pharmacies in 1.0, 2.0, and 3.0 mg film-coated tablets and can be used for short- or long-term treatment a sleep insomnia for adults. Oral ESP quickly enters the body and is vastly distributed through tissues of body, such as the brain. ESP chemically known as 5S and S-isomer zopiclone, (5S)-6-(5-chloropyridin-2-yl) -7-oxo-6,7-dihydro-5H-pyrrolo[3,4-b] pyrazin-5-yl 4-methylpiperazine -1-carboxylate. It has a molecular formula of C17H17ClN6O3 with a molecular weight of 388.9 g mol−1 (Monti and Pandi-Perumal, 2007, Rosner et al., 2018, Halas and Pharm, 2006, Wessell et al., 2005).
Eszopiclone has been identified using various analytical techniques, including spectrophotometry (Chennaiah et al., 2012, Patel et al., 2013), chromatography (Bhusari and Dhaneshwar, 2021, Anandakumar et al., 2010, Liu et al., 2020, Ravi et al., 2014, Shaikh et al., 2014), spectrophotometry with chromatography (Pandya et al., 2013, Panchal and Maheshwari, 2017), IR spectroscopy (Liu et al., 2014), thermodynamic and gravimetry (Liu et al., 2016).
SWV is a frequently used method in various fields, including the analysis of caffeine in beverages (Tefera et al., 2016), analysis of pharmaceutical formulations (Afzali et al., 2020, Faria et al., 2019, Alghamdi, 2016, Karastogianni and Girousi, 2022, Kokoskarova et al., 2023, Neven and Emad, 2022, Biya et al., 2023), metals (Mekassa et al., 2018, Alshawi et al., 2022, Leon-Medina et al., 2022), and dyes (Hayat et al., 2022, Yahya et al., 2022).
The current research aims to develop a rotating glassy carbon (GC) indicator electrode-based method for quick, sensitive, and selective square wave voltammetry for the quantitative analysis of ESP in commercial tablets and human fluids. The study focus on the simplicity, sensitivity, affordability and time-saving aspects of SWV methodology compared to other analytical methods. The accuracy and precision of the SWV approach were validated via comparison of its voltammetric results with UV spectrophotometry utilizing the statistical “F-test”. This research is developed the SWV method to estimate ESP drug and had never done as like it.
2 Materials and methods
2.1 Materials
The starting material of ESP was obtained from Qasim Pharmaceutical Company (Spimaco) in Buraydah, KSA, in a powder form. A 50 mL volumetric flask containing a mixture of phosphate buffer (pH 3) and distilled H2O (1:10) was used to prepare the ESP stock solution. The buffer solutions (carbonate, phosphate, acetate, and B-R) were prepared using chemicals as described by “Alghamdia et al. (2014)”, for the purpose of determining ESP and monitoring its reduction reactions.
2.2 Methods
The voltammetric applications of SWV, CV and DPV used a 797 VA equipment, (Switzerland made) for ESP drug analysis. This apparatus included auxiliary electrode of Pt, reference electrode of Ag / AgCl (KCl), and indicator electrode of GC. The acidity and basicity of ESP solutions were measured and controlled using pH meter of model pH 211. The Labofuge 200 device, manufactured in Germany, was used to centrifuge the biological fluids.
2.3 Procedures
Firstly, the electrochemical cell (10 mL capacity) is typically cleaned using ethanol and distilled water before any experiment. The square wave reduction was applied in the potential range from 0.0 to−1.0 Volt. Nitrogen gas was used to purge all buffer solutions to eliminate O2 gas. To achieve optimal electro-voltammetric signal shape and high current for ESP determination, the B-R pH 6.5 solution, tacc of 60-second, Eacc of −0.1 V, frequency of 15 Hz, scan rate of 150 mVs−1, amplitude voltage of 150 mV, and 1000-rpm were chosen. All voltammetric measurements were carried out at room temperature (25 °C).
2.3.1 Preparation of ESP tablets
Pharmaceutical tablets labeled “Zonam® 3 mg (Eszopiclone)” were obtained from the pharmaceutical plant “SPIMACO” in Al-Qassim, KSA. Ten tablets were crushed and weighed using a sensitive balance to prepare 1 × 10⁻³ mol L−1 of ESP tablets in a volumetric flask of 25 mL. Then, the filtrate of solution was used to apply the SWV method for the determination of ESP content by recovery.
2.3.2 Preparation of biological fluids
The half-mL samples of human urine and plasma were mixed with 5 × 10⁻⁶ mol L−1 of ESP. To this mixture, 1.0 mL of ZnSO4·7H2O, 1.0 mL of CH3OH, and 0.1 mL of NaOH were added in a tube of centrifuge (Alghamdi, 2014). After centrifuging the mixture for eight minutes at 5000 rpm, the filtrate was placed in the electrochemical cell. Thereafter, SWV method was applied to estimate ESP content in the biological fluids.
3 Results
3.1 Electrochemical observations
The DPV and CV techniques were applied to evaluate the voltammetric behavior of 4 × 10⁻⁵ mol L−1 of ESP compound as shown in Figs. 1 and 2, respectively. The resulting voltammetric signals confirmed the suggestion of the electro-voltammetric reduction of the carbonyl (C═O) to the alcohol (OH—C—H) functional groups (Morrison and Boyd, 1992) as proposed in Scheme 1.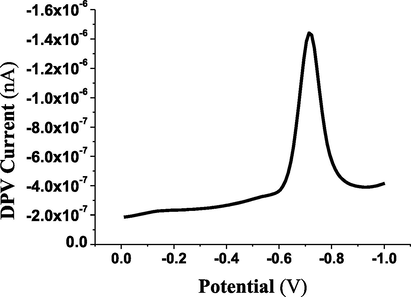
Differential pulse voltammetric reduction behavior of 4 × 10⁻⁵ mol L−1 of ESP (I=1100nA).
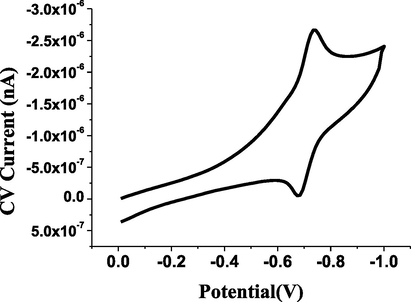
Cyclic voltammetric reduction behavior of 4 × 10⁻⁵ mol L−1 of ESP (Ic = 1040nA).
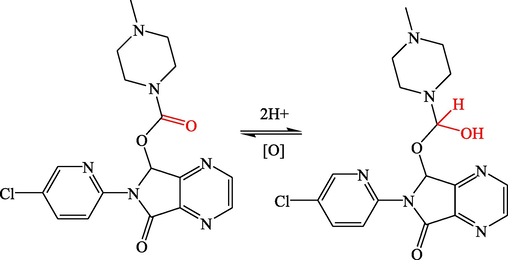
Eszopiclone's chemical structure and the proposed electrochemical mechanism.
The CV technique was utilized to study the reversibility of the cathodic peak for the determination of ESP within the range of 20−120 mV s−1 (n = 6). The relationship between the logarithm of scan rate (log ν) and the logarithm of current (log I) was examined, resulting in a slope of 0.85, which approached a value of 1.00. This value (0.85) confirmed the involvement of an adsorption process of ESP onto the surface of the GC electrode (Laviron, 1981).
Furthermore, the multi-cyclic voltammetry method was used to measure 4 × 10⁻⁵ mol L−1 of ESP for five sweep rates. The resulting reduction signals decreased suddenly after the first scan. This CV approach confirmed the saturation of ESP onto the GC surface.
Finally, the SWV technique was applied and recorded a well-defined reduction peak at−750 mV potential for the electro-determination of 1 × 10⁻⁵ mol L−1 of ESP as shown in Fig. 3.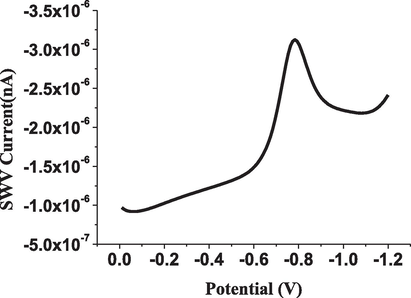
Reduction of 1 × 10⁻⁵ mol L−1 of ESP using square wave voltammetry under optimal conditions (I=865nA).
3.2 Analytical parameters
In order to optimize the experimental conditions and achieve the highest sensitivity for the SWV method, the effect of buffer solutions, pH, scan rate, tacc, Eacc, frequency, amplitude voltage, and stirrer rate on the reduction response of 5 × 10⁻⁶ mol L−1 of ESP was studied.
3.2.1 Effect of buffers and pH
Here, the SWV method was used to determine ESP using various buffers, including acetate at pH 3, carbonate at pH 10, phosphate at pH 3, and B-R at pH 3, 7, and 10 as shown in Fig. 4. The B-R buffer at pH 7 was recorded a highest current and was used for subsequent experiments. Additionally, the pH effect was studied over the range of 5- 8.5 (n = 8) using the B-R buffer, as depicted in Fig. 5. A pH value of pH of 6.5 gave a high current, and was therefore chosen for further experiments.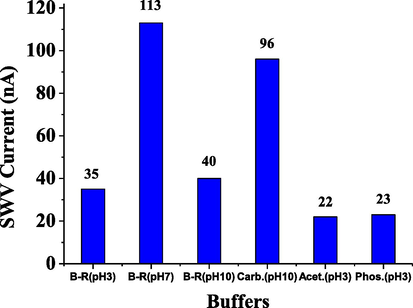
Effect of buffers on SWV reduction current for 5 × 10⁻⁶ mol L−1 of ESP.
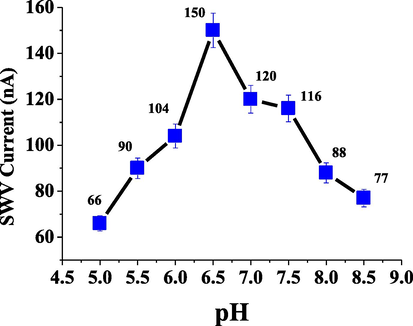
Effect of pH on SWV reduction current for 5 × 10⁻⁶ mol L−1 of ESP in B-R buffer.
3.2.2 Effect of tacc and Eacc
The tacc was investigated over the time range of 0.0 – 105 s. A 60-second of tacc was given a high cathodic current, therefore the optimal tacc value (60 s) was chosen for further studies. Additionally, Eacc was assessed over the range of −0.8 to + 0.8 V. The highest current was recorded at −0.1 V Eacc, wherefore this value was chosen for subsequent experiments.
3.2.3 Effect of frequency and amplitude
The frequency (Hz) was studied in the range of 5-40 Hz. A frequency of 15 Hz was identified as producing a high sensitivity of reduction signal and was chosen for subsequent work. Additionally, the amplitude voltage was monitored over the range of 10-200 mV. A high reduction current was observed at an amplitude of 150 mV, so this value was selected for further experiments.
3.2.4 Effect of scan rate and stirrer
The scan rate was investigated over the range of 50-300 mVs−1. A scan rate of 150 mVs−1 was given a high reduction peak, leading to its selection for further studies. Furthermore, the stirrer rate was examined over the stirrer range of 0.0-3000 rpm. A stirrer operating at 1000 rpm demonstrated the highest SWV current, prompting its choice for continued research.
3.2.5 Effect of rotating indicator electrodes
The gold (Au), silver (Ag), glassy carbon (GC), and (UT) graphite electrodes were used to determine ESP. The gold, and silver electrodes failed to produce a SWV signal at -750 mV. The UT graphite electrode showed an overlapping peak around the reduction potential. The glassy carbon electrode was the only one that recorded a high current (387nA) and the best SWV shape. It was selected as the best electrode for determining ESP in pharmaceutical and human fluids.
3.2.6 Effect of some interferences
In general, certain substances such as lactose, sucrose, and starch, were added to the standard drug materials for patients use. These additives could affect the SWV response for ESP determination by competing with the ESP cathodic response on the GC indicator electrode surface. Interferences at folds of 2.0, 5.0, 10.0, and 50 were added to a 5 × 10⁻⁶ mol L−1 of ESP solution. At high folds (50), lactose and starch had adverse effects of 10 % and 8 % on the cathodic current of ESP. In contrast, sucrose also had negative effects of 11.3 %, 17.6 %, 20 %, and 25 % on the cathodic current of ESP.
3.3 SWV validation
According to the criteria set by the United State Food and Drug Administration (FDA) (US-FDA, Guidelines, 2018), the SWV method was validated for calibration curve, LOD, LOQ, repeatability, recovery and stability.
3.3.1 Calibration curve
Under optimal conditions, the correlation between square wave voltammograms and ESP concentration was monitored in the concentration range of 3 × 10⁻⁶-5 × 10⁻⁵ mol L−1 as shown in Fig. 6. The linearity (calibration curve) of the SWV method was investigated for ten cathodic measurements (n = 10), to give analytical results with a correlation coefficient of 0.999 (r2), as listed in Table 1. On the other hand, the linearity of UV-Vis spectrophotometry; as a reference method, was investigated during the concentration range (2 × 10⁻⁵-1 × 10⁻⁴ mol L−1; n = 5) to give 0.9999 r2 correlation coefficient and linear equation of Abs = 1.36 × 10⁴C+0.065.![SW-Voltammograms of ESP using calibration curve under optimal conditions over the range of 3 × 10⁻⁶-5 × 10⁻⁵ mol L−1 [ A: 3 × 10⁻⁶, B: 8 × 10⁻⁶, C: 1.5 × 10⁻⁵, D: 2 × 10⁻⁵, E: 2.5 × 10⁻⁵, F: 3 × 10⁻⁵, G: 3.5 × 10⁻⁵, H: 4 × 10⁻⁵, I: 4.5 × 10⁻⁵, J: 5 × 10⁻⁵ mol/L].](/content/185/2024/36/9/img/10.1016_j.jksus.2024.103408-fig7.png)
SW-Voltammograms of ESP using calibration curve under optimal conditions over the range of 3 × 10⁻⁶-5 × 10⁻⁵ mol L−1 [ A: 3 × 10⁻⁶, B: 8 × 10⁻⁶, C: 1.5 × 10⁻⁵, D: 2 × 10⁻⁵, E: 2.5 × 10⁻⁵, F: 3 × 10⁻⁵, G: 3.5 × 10⁻⁵, H: 4 × 10⁻⁵, I: 4.5 × 10⁻⁵, J: 5 × 10⁻⁵ mol/L].
Calibration curve
Parameters
ESP Concentration (mol L−1)
SWV current (nA)
3.0 × 10⁻⁶
709
Range (mol/L)
3.0 × 10⁻⁶-5.0 × 10⁻⁵
8.0 × 10⁻⁶
837
Correlation coefficient®2
0.999
1.5 × 10⁻⁵
950
2.0 × 10⁻⁵
1060
2.5 × 10⁻⁵
1180
Equation
Y=2.2 × 10⁷C+639.5
3.0 × 10⁻⁵
1290
3.5 × 10⁻⁵
1410
4.0 × 10⁻⁵
1520
Y
I (nA)
n (number of measurements)
10
4.5 × 10⁻⁵
1640
5.0 × 10⁻⁵
1720
Slope
2.2 × 10⁷
Intercept
639.5
LODa
7.5 ppb
LOQb
24.93 ppb
3.3.2 Repeatability, stability and recovery
The repeatability, stability, and recovery of ESP of 5 × 10⁻⁶ mol L−1 were investigated under optimal parameters. The cathodic response remained stable through the 90-minute analytical period. Repeatability was assessed through six SWV measurements, to give 0.141 % (RSD%). Recovery was studied through five SWV measurements of the ESP drug, yielding a result of 110 % ± 1.1 SD. The results for repeatability and recovery were summarized in Table 2, for ESP determination using SWV and UV spectrophotometry techniques. a: Level of confidence. b: Number of concentrations. c: Number of replicates for each concentration d: F‐test calculated value. e: F‐test critical value.
ESP concentration(mol L-1)
SWV Current (nA)
UV (Abs)
RSD %
Recovery%(5.0×10⁻⁶ mol L-1)
SWV
UV
785
0.740
SWV0.141
UV0.1214
109109110110112
785
0.741
786
0.742
5.0 × 10⁻⁶
5.0 × 10⁻⁵
787
0.742
787
0.742Mean± SD0.7414±0.001
Mean
110
788Mean±SD786.33±1.11
SDV
±1.1
“F-test” variances significance
Fcalcd = 1.33
Fcrite (αa = 0.05; Nb = 9;nc = 4) = 6.00
Fcalc. < Fcrit.
3.3.3 LOD and LOQ
The LOD was estimated to be 1.9 × 10⁻⁸ mol L−1 (7.5 ppb), while the LOQ was found to be 6.41 × 10⁻⁸ mol/L (24.93 ppb). The developed SWV approach was discovered to be significantly more sensitive than previous analytical techniques for detecting ESP in pharmaceuticals. For example, the PR-HPLC method reported ESP levels of 54 and 132 ppb, respectively, according to the LOD and LOQ (Ravi et al., 2014).
4 Discussion
Using the validated SWV method, the presence of the eszopiclone molecule was swimmingly determined in both pharmaceuticals and biological samples.
4.1 Application to pharmaceutical tablet
The SWV method was used to determine the content of ESP in commercial tablets “Zonam® 3 mg (Eszopiclone)”, with a recovery of 5 × 10⁻⁶ mol L−1 of ESP. The recovery was calculated based on five additions of 3 × 10⁻⁶ mol L−1 of ESP to the medication solution. The average recovery was found to be 105 ± 0.63 % (see Table 3).
Recovery %
Zonam® 3 mg
ESP Tablet
Urine
Plasma
Recovered
Conc. of ESP
(5.0 × 10⁻⁶ mol/L)
104
105
105
105
106
104
105
105
106
10699
100
101
102
103
105
105.2
101
±0.63
±0.75
±1.414
4.2 Application to biological fluids
The SWV method was utilized to estimate the concentration of ESP in urine and plasma samples by recovering 5 × 10⁻⁶ mol L−1 of ESP. The recoveries for the five additions of 3 × 10⁻⁶ mol L−1 of ESP stock solution to the biological samples are summarized in Table 3. The mean recoveries were reported as 105.2 ± 0.75 % for urine sample and 101 ± 1.414 %, for plasma sample.
On the other hand, the results obtained from square wave voltammetry (SWV) were compared to results from spectrophotometric method, which served as the reference method for determining ESP content in pharmaceutical tablets. The comparison showed that there was no considerable variance between all results obtained from UV-Vis spectrophotometry and SWV methods, confirmed the statistical valuation using the “F-test” for all analytical data. The calculated “F-test” value in this study was 1.33, which fell below the crucial value of 6.00 at a 95 % confidence level. Therefore, it can be concluded that there was no noticeable difference in accuracy between the spectrophotometry and SWV methods that were validated.
5 Conclusion
This study validated the square wave voltammetry approach for the determination of ESP in pharmaceutical formulations and biological samples using a GC indicator electrode. Under optimal conditions, the SWV method can accurately determine the concentration of ESP drug within a linear scope of 3 × 10⁻⁶-5 × 10⁻⁵ mol L−1. One advantage of this study is the simple approach used to prepare human biological fluids, resulting in several characteristics that validate the SWV method. The electrochemical results highlighted additional benefits, such as affordability, speed, simplicity, and sensitivity of the SWV method. The analysis of ESP by SWV was found to be accurate and precise, with validation conducted in accordance with FDA requirements. The findings of the LOD and LOQ values further supported the SWV method's sensitivity in determining ESP. A comparison between the SWV and reference UV-Vis spectrophotometry methods was made using “F-test”.
Disclosure of funding
This research did not receive any funds.
CRediT authorship contribution statement
Ali F. Alghamdi: Validation.
Acknowledgement
The author would like to express gratitude to Spimaco-KSA, Mr. Abdulwase'a Alshaikh, Miss Rahaf Almatrafy, Mrs. Afnan Almatrafy, and the Qassim Pharmaceutical Plant in Buraydah for their assistance in completing this research.
Declaration of Competing Interest
The authors declare that they have no known competing financial interests or personal relationships that could have appeared to influence the work reported in this paper.
References
- Square wave voltammetric determination of anticancer drug flutamide using carbon paste electrode modified by CuO/GO/PANI nanocomposite. Arabian J Chem.. 2020;13:3255-3265.
- [Google Scholar]
- Electrochemical oxidation behavior of hydrochlorothiazide on a glassy carbon electrode and its voltammetric determination in pharmaceutical formulations and biological fluids. J. Food Drug Anal.. 2014;22:363-369.
- [Google Scholar]
- Development of square wave voltammetric method for the electrochemical determination of pregabalin as pregabalin-Cu(II) complex using graphite electrode. Mor. J. Chem.. 2016;4:853-861.
- [Google Scholar]
- Non-extractive ultra-trace determination of simvastatin in biological fluids by voltammetric method via complexation with cadmium. Dig. J. Nano. Bios.. 2014;9:355-368.
- [Google Scholar]
- Voltammetric determination of Hg2+, Zn2+, and Pb2+ ions using a PEDOT/NTA-modified electrode. ACS Omega. 2022;7:20405-20419.
- [Google Scholar]
- Validated RP-HPLC Method for the estimation of Eszopiclone in bulk and tablet dosage form. As. J. Res. Chem.. 2010;3:63-66.
- [Google Scholar]
- Development and validation of a stability-indicating HPTLC method for the estimation of Eszopiclone in pharmaceutical dosage forms. As. J. Res. Pharm. Sci.. 2021;11:219-223.
- [Google Scholar]
- Highly sensitive square wave voltammetric method for determination of brucine in artificial urine samples based on choline chloride modified glassy carbon electrode. Heliyon.. 2023;9:14544.
- [Google Scholar]
- Spectrophotometric determination of eszopiclone in pure and pharmaceutical forms. J. Chil. Chem. Soc.. 2012;57:1460-1463.
- [Google Scholar]
- Square-wave voltammetry determination of ciprofloxacin in pharmaceutical formulations and milk using a reduced graphene oxide sensor. J. Braz. Chem. Soc.. 2019;30:1947-1954.
- [Google Scholar]
- A novel electrochemical sensing platform for the sensitive detection and degradation monitoring of methylene blue. Cat.. 2022;12:306.
- [Google Scholar]
- Square wave voltammetric (SWV) Determination of cyanocobalamin (Vitamin B12) in pharmaceuticals and supplements on a carbon paste electrode (CPE) modified by a manganese(II) polymeric film. Anal. Let.. 2022;55:399-410.
- [Google Scholar]
- Multilayer model for the study of space distributed redox modified electrodes: part III. Influence of interactions between the electroactive centers in the first layer on the linear potential sweep voltammograms. J. Electroanal. Chem.. 1981;122:37-44.
- [Google Scholar]
- Classification of As, Pb and Cd heavy metal ions using square wave voltammetry, dimensionality reduction and machine learning. IEEE Acc.. 2022;10:7684-7694.
- [Google Scholar]
- Development of a novel tandem mass spectrometry method for the quantification of eszopiclone without interference from 2-amino-5-chloropyridine and application in a pharmacokinetic study of rat. J. Pharm. Biomed. Anal.. 2020;188:113363
- [Google Scholar]
- Quantitative analysis of uncoated Eszopiclone tablets by near-infrared spectroscopy. Anal. Let. 2014:1938-1951.
- [Google Scholar]
- Determination and correlation of solubility and thermodynamic properties of eszopiclone in pure and mixed solvents. J. Mol. Liq.. 2016;221:1035-1044.
- [Google Scholar]
- Square wave voltammetric determination of ibuprofen at poly(L-Aspartic Acid) modified glassy carbon electrode. IEEE Sen. J.. 2018;18:37-44.
- [Google Scholar]
- Eszopiclone: its use in the treatment of insomnia. Neuropsychiatr. Dis. Treat.. 2007;3:441-453.
- [Google Scholar]
- Organic chemistry,6th edition. Englewood Cliffs, New Jersey, USA: Prentice Hall; 1992. p. :425-430.
- Square wave voltammetric and ion selective potentiometric strategies for spiramycin determination in pharmaceutical formulations. Anal. Bioanal. Electrochem.. 2022;14:621-637.
- [Google Scholar]
- A review on chromatographic and spectrophotometric estimation of escitalopram oxalate and eszopiclone in bulk and in different dosage forms. Euro. J. Pharm. Med. Res.. 2017;4:183-191.
- [Google Scholar]
- Development and validation of UV spectrophotometric and RP HPLC method for the estimation of eszopiclone bulk and tablets. Inter. J. Adv. Pharm. Anal.. 2013;3:11-19.
- [Google Scholar]
- Simultaneous determination of escitalopram oxalate and eszopiclone in their combined mixture by ultraviolet spectrophotometry (Dual wavelength method) Anal. Chem. a. Ind. J.. 2013;12:398-402.
- [Google Scholar]
- Development and validation of an RP-HPLC method for the determination of the eszopiclone in tablet dosage forms. Inter. J.R.P.C.. 2014;4:119-130.
- [Google Scholar]
- Eszopiclone for insomnia. Rev: Cochrane Database Syst; 2018.
- Stability-indicating LC-UV method for the determination of eszopiclone and degradation impurities in tablet dosage form. J. Chromatogr. Sci.. 2014;52:293-297.
- [Google Scholar]
- Simultaneous determination of caffeine and paracetamol by square wave voltammetry at poly(4- amino-3-hydroxynaphthalene sulfonic acid)-modified glassy carbon electrode. Food Chem.. 2016;210:156-162.
- [Google Scholar]
- US-FDA, Guidelines, 2018. Bioanalytical method validation guidance for industry.
- Eszopiclone (Lunesta) for treatment of transient and chronic insomnia. Am. Fam. Physician. 2005;71:2359-2360.
- [Google Scholar]
- Electrochemical sensor for detection and degradation studies of ethyl violet dye. ACS Omega. 2022;7:34154-34165.
- [Google Scholar]


