

Translate this page into:
Validated spectrophotometric approach for determination of salbutamol sulfate in pure and pharmaceutical dosage forms using oxidative coupling reaction
⁎Corresponding author. fadamabdon@tu.edu.iq (Fadam M. Abdoon)
-
Received: ,
Accepted: ,
This article was originally published by Elsevier and was migrated to Scientific Scholar after the change of Publisher.
Peer review under responsibility of King Saud University.
Abstract
This study was aimed to find out a simple, sensitive and rapid spectrophotometric method for determination of salbutamol sulfate (SAL). The suggested method was based on the oxidative-coupling reaction of SAL with potassium iodate coupled with 4-amino-5-isopropyl-1-methyl-2-phenyl-1,2-dihydro-3H-pyrazol-3-one (AMP). The formed red colour of the reaction product was measured at a maximum absorption wavelength of 499 nm against the blank solution. It was obeyed to Beer-Lambert's law over the concentration ranged of 2–32 μg mL−1 with a molar absorptivity of 9.165 × 10³ L mol−1 cm−1. The suitability of the proposed method for determination of SAL in the presence of some interfering species was studied. The method revealed high sensitivity for determination of the selected drug. The percentage recoveries were in the range from98.8 to 100.4% with relative standard deviation less than 0.3%. The developed method was validated according the current ICH guidelines (ICH guidelines, 2005). Promising results using the proposed spectrophotometric method were recorded for determination of SAL in its pure form and pharmaceutical formulations.
Keywords
Salbutamol sulfate
AMP reagent
Method validation
Oxidative coupling reaction
Spectrophotometry

1 Introduction
Salbutamol sulfate (SAL) is one of the selective short actingbeta-2-adrenergic agonist acts as a bronchodilator in the treatment of asthma and chronic obstructive pulmonary disease (Wilson and Gisvols's, 2004). It is also recommended as a prophylacting agent for exercise-induced asthma. It is formulated as a mixture of R-and S-isomers (Fig. 1) (See Scheme 1).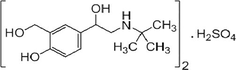
Chemical structure of salbutamol sulfate.
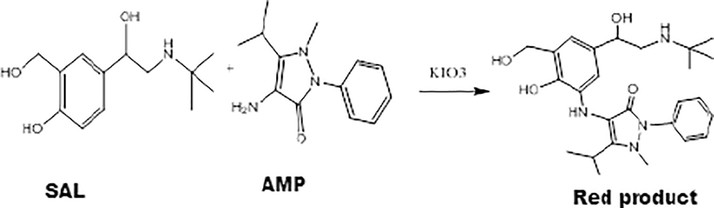
Proposed chemical equation of the reaction of SAL and AMP.
Several methods have been addressed for determination of SAL in its pure and pharmaceutical dosage forms. Among these methods, flow injection spectrophotometric methods (Dol and Knochen, 2004; Al-Abachi and Subhi, 2013). Furthermore, other spectrophotometric approaches were proposed for determination of SAL in different matrices (Duraid et al., 2014; Hind, 2008; Manasa et al., 2013; Mishra et al., 2010; Patel et al., 2011). Many chromatographic separation techniques were reported for determination of SAL in pure form, pharmaceutical formulations and biological fluids. High performance liquid chromatography is the most common technique used in SAL determination (Kashyap and Srinivasa, 2013; Martis and Gangrade, 2011; Muralidharan and Kumar, 2012; Sawant et al., 2015). Liquid chromatography coupled with mass spectrometry method was also proposed for determination of SAL by (Dahiya, et al. 2014; Zhang et al. 2012). Another chromatographic suggested technique was thin layer chromatography by (Dave et al., 2010) for the separation and determination of SAL in ternary mixture with bromhexine hydrochloride and etofylline. Chen et al. (2008) was also described a new capillary zone electrophoresis method for determination of SAL in swine feed complex extracts. Different electrochemical methods were developed for determination of SAL including, voltammetry on carbon paste electrode modified with iron titanate nanopowder (Attaran et al., 2012), potentiometry (Abdel-Ghani et al., 2000; Abdel-Ghani et al., 2002).
Although the literatures revealed different techniques which have been reported for determination of SAL, there are some drawbacks observed (Table 1). Unfortunately, the separation techniques provide a quick PC controlled and high sensitive determination of many chemicals and pharmaceutical products; they still have many drawbacks such as high cost, need for large amounts of organic solvents and high operating skills. Moreover, electrochemical approaches may also be carried out very quickly, and the results are available as electrical signals. These techniques displayed some errors in analysis and require high environmental protection in order to minimize the toxicity. However, spectrophotometry is very simple, fast and provides promising results as well. Therefore, the aim of this study is to develop a new simple, robust and rugged based on oxidative coupling reaction for determination of SAL in its pure form and different pharmaceutical formulations.
Method of analysis
Principle
Linear concentration range
Limitation
Reference
Flow-injection spectrophotometry
The method is based on the condensation of salbutamol with 4-aminoantipyrine in the presence of hexacyanoferrate (III) in alkaline medium, producing a coloured quinoneimide that was detected at 500 NM.
0–74.1 mg L−1
Consuming large quantity of reagents
Dol and Knochen, 2004
The methods based on an oxidative-coupling reaction of 2,4-dinitro phenyl hydrazine with sodium periodate, where an electrophilic intermediate diazonium salt of the reagent is produced, which coupled with SAL. The determination at 525 nm.
1–24 µg mL−1
Consuming large quantity of reagents
Al-Abachi, and Subhi, 2013
High performance liquid chromatography
The separation is achieved on C18, (Hypersil ODS) column with a flow rate 1.0 mL min−1 in Socratic mode using Buffer pH 3.5 (0.1% triethylamine): Acetonitrile (60:40) as mobile phase. Column oven temperature is maintained at 25 °C.
10–30 µg mL−1
The chromatographic method required high operator skills, need large amounts of solvents and specific optimized conditions for separations
Kashyap and Srinivasa, 2013
High performance liquid chromatography coupled with mass spectrometry
The separation was carried out using C18 column, 0.1% formic acid in water and 0.1% formic acid in methanol (20 : 80 v/v) using isocratic mode at 30 °C. under typical mass setting Capillary voltage 3.5, cone voltage 30, temperature source 100 °C and dessolvation temperature 450 °C.
1-50
g mL−1
Very expensive method
Dahiya, et al. 2014
Voltammetry
This method was based on the direct electrochemical determination of SAL using an iron titanate nanopowder‐modified carbon paste electrode.
0.2–25 nmol L−1
This electrochemical method may display some errors in analysis, requiring environmental protection to minimize the toxicity.
Attaran, et al. 2012
Spectrophotometry
Oxidative-coupling reaction of salbutamol sulfate (SAL) with potassium iodate coupled with 4-amino-5-isopropyl-1-methyl-2-phenyl-1,2-dihydro-3H-pyrazol-3-one. The resulting red colour product was measured at maximum absorption of 499 nm.
2–32 μg mL−1
Present work
2 Experimental
2.1 Apparatus
All spectrophotometric measurements were carried out using Jasco UV–Vis 530 double beams (Easton, USA) and Apple PD303S single beam (Tokyo, Japan). The pH of all solutions was recorded using a Jenway-3510pH meter (Essex, England). Sartorius four digit balance (Gottingen, Germany) was used for weighing.
2.2 Chemicals and reagents
All reagents used were of analytical grade. Pure grade of salbutamol sulfate of purity (99.8%) was produced by Samarra Drug Industry, Samarra, Iraq. Pharmaceutical formulations including Butalin®2 mg /tablet, Butaline® 2 mg/5 mL syrup (Julphar of pharmaceutical industry Co, Ras Alkhaimah, UAE) andVental® 20 mg /20 mL inhalation (The Arab drug Co. Cairo, Egypt) were purchased from local drug stores. Potassium iodate (99.5%), potassium chromate (99.0%) and sodium iodate (99.0%) were acquired from (BDH, Pool, UK). Furthermore, sodium hydroxide (98.0%), potassium ferricyanide (99.5%), methanol and Ferric chloride hydrate (98.0%) were purchased from (Fluka, Swezriland).
2.3 Preparation of analytical solutions
2.3.1 Standard solution of salbutamol
A solution of 100 µg mL−1 SAL was prepared by dissolving 0.01 g of pure SAL powder in 100 mL of distilled water with continuous stirring. Working solutions for an experimental study were prepared by a serial dilutions using the same solvent.
2.3.2 Preparation of tablet solution
Twenty tablets of Butalin® 2 mg/tablet were finely powdered and accurate amount equivalent to prepare a solution of 100 µgmL−1 was transferred into a 100-mL volumetric flask and dissolved in 50 mL methanol. The solution was then centrifuged at 2500 rpm for 3 min. and filtered. The filtrate was completed to100 mL using distilled water.
2.3.3 Preparation of inhalation solution
Ten mL of Vental® inhalation (20 mL of canister contains 20 mg) was drawn out into a 100-mL volumetric flask and a 100 mL of distilled water was added to obtain a 100 µg mL−1 SAL solution. The working solutions were prepared by serial dilutions using the same solvent.
2.3.4 Preparation of syrup solution
Sixty mL of Butalin® syrup 2 mg/5mLequivalent to 0.024 g SAL was drawn out in a 100-mL volumetric flask and the volume was completed to the mark with distilled water to produce a solution of 240 µg mL−1 of SAL.
2.3.5 Procedure for the calibration curve
The main procedure is based on oxidative coupling reaction of SAL with potassium iodate coupled with AMP. Different samples of pure SAL with concentrations of 2–32 μg mL−1were tested. Under optimal conditions, the absorbance intensities were plotted vs. the investigated drug concentrations. The calibration graph was constructed and the regression equation was then derived.
2.3.6 Procedure for SAL pharmaceutical formulation analysis
Under optimal conditions, three different samples of SAL (10, 15, 20 and 32 μg mL−1) in each tablet, syrup and inhalation were investigated using the proposed oxidative-coupling spectrophotometric method and the total content of each sample was evaluated using the calibration graph.
3 Results and discussion
3.1 Optimization of analytical conditions
Various parameters which affect the spectrophotometric intensity were studied and the reaction conditions were improved. Subsequent, all experiments were performed in a volumetric flask of 10 mL using 0.5 mL of 0.01 mol L−1 of potassium iodate, 0.5 mL of 0.01 mol L−1 of AMP and 0.2 mL of 100 µgmL−1 of SAL. All spectrophotometric measurements were recorded at λmax of 499 nm against the blank solution.
3.1.1 Effect of the coupling reagent amount (AMP)
To study the effect of AMP volume on the absorbance, various amounts of 0.01 mol L−1AMP solution in the range of 0.1–2.5 mL were added to 0.5 mL of KIO3 and 0.2 mL of SAL solution. It was observed that using 0.9 mL of 0.01 mol L−1 AMP provided a maximum absorbance, this volume was selected as optimum value for further study (Fig. 2).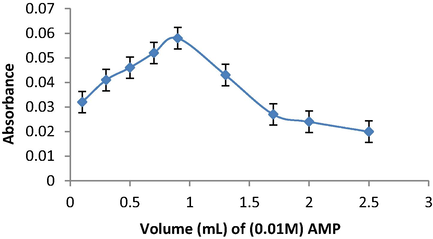
Effect of AMP volume in SAL determination using the oxidative coupling reaction of KIO3 and AMP.
3.1.2 Selection of suitable oxidizing agent
To select the suitable oxidizing agent, several oxidants were investigated such as 0.1 mol L−1 of potassium ferricyanide (K3Fe(CN)6), potassium dichromate (K2CrO4), sodium iodate (NaIO3), Ferric chloride (FeCl3) and potassium iodate (KIO3). It was observed that potassium iodate gave the maximum absorbance signal and it was selected as a suitable oxidizing agent (Fig. 3) for further studies.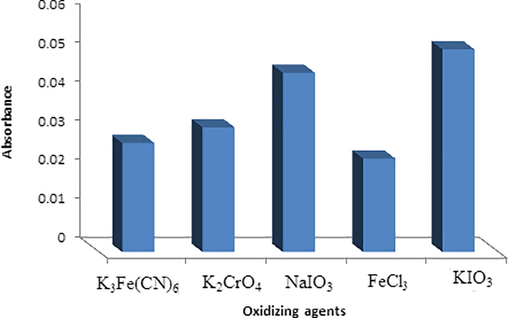
Selection of the suitable oxidizing agents using 0.1 mol L−1 of each K3Fe(CN)6, K2CrO4, NaIO3, FeCl3 and KIO3.
3.1.3 Effect of the oxidizing agent (KIO3) amount
The influence of oxidizing agent volume can affect the maximum absorbance signal, therefore, different volumes in the range of 0.2–2.0 mL of 0.01 mol L−1 KIO3 were added to 0.9 mL of AMP and 0.2 mL of SAL solution. The results showed that 0.8 mL of 0.01 mol L−1 KIO3 solution gave the maximal absorbance signal and it is used to accomplish the subsequent measurements (Fig. 4).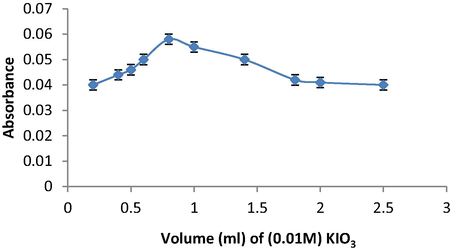
Effect of KIO3volume on the maximum absorbance signal of SAL using the oxidative coupling reaction of KIO3 and AMP.
3.1.4 Effect of pH
The absorbance was recorded using different pH of tested solution by a universal buffer of pH ranged from 2 to 8. The peak intensity has slightly changed with changing the pH values. The maximum peak intensity was recorded at pH value 5 (Fig. 5). It was also noticed that the normal pH value of the tested solution was 5 therefore; the measurements were carried out without adding any buffer solution.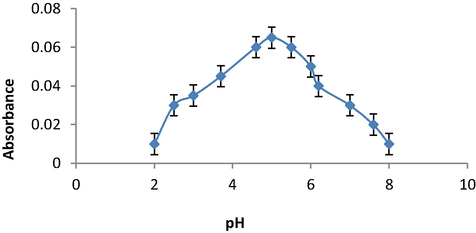
Effect of pH on determination of SAL using the oxidative coupling reaction of KIO3 and AMP.
3.1.5 Effect of order addition
The sequence of reactant addition can cause a significant effect on the yield of the produced compound. Several experiments with different addition sequences were carried out. The obtained results revealed that adding SAL followed by KIO3 and finally AMP, the optimal absorbance signal was recorded (Table 2).
No.
Order of addition
Absorbance
I
SAL + AMP + KIO3
0.04
II
SAL + KIO3 + AMP
0.06
II
KIO3 + AMP + SAL
0.04
3.1.6 Effect of time on colour stability
The effect of time on the stability of the formed colour was studied at the optimum conditions (0.2 mL of SAL, 0.9 mL of KIO3 and 0.8 mL of AMP). The recorded results indicated that a significant increase in the colour was observed with time and the colour becomes more stable within 5 min and remains unaltered for at least 55 min (Fig. 6).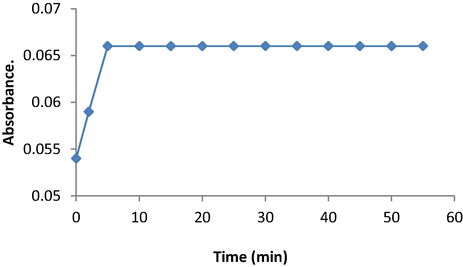
Effect of time per min on the maximum absorbance signal of SAL using the oxidative coupling reaction of KIO3 and AMP.
3.1.7 Effect of temperature
At optimum condition, the effect of temperature (5–60 °C) on the oxidizing coupling reaction was studied. The results have shown that the better absorbance was at a temperature of 25 °C (room temp.) and it is used in subsequent experiments (Table 3).
Temp, °C
5
10
15
20
25
30
35
40
45
50
55
Abs
0.05
0.05
0.05
0.06
0.06
0.05
0.04
0.04
0.03
0.03
0.02
3.2 Analytical figure merit
After optimizing the analytical conditions, the suggested method was used for determination of SAL pure samples and the analytical figure of merit was obtained. The plotted calibration graph was linear over a concentration range of 2–32 µg mL−1 (Fig. 7) and limit of detection 0.4 µgmL−1. The regression equation was derived A = 0.038C – 0.013, (r = 0.9995) and the percentage relative standard deviation (%RSD) of six replicate measurements equal to 0.9%. The obtained results revealed that the suggested method has a high sensitivity, good stability and acceptable linearity (See Fig. 8).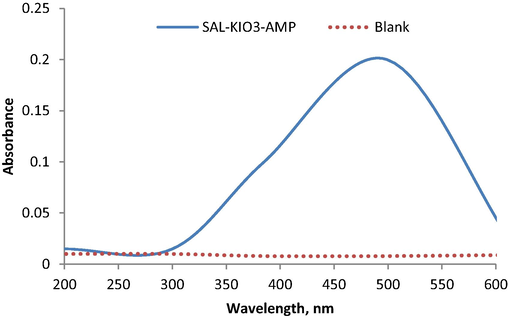
Absorption spectrum at 499 nm of SAL using oxidative coupling reaction with KIO3 and AMP.
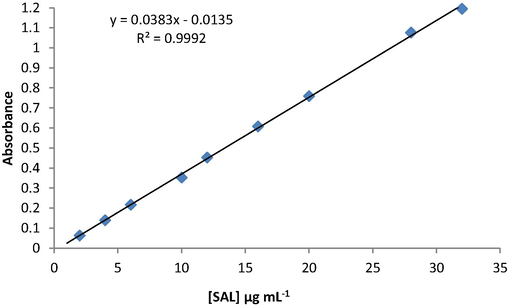
Calibration graph of SAL determination using oxidative coupling reaction with KIO3 and AMP.
3.3 Method validation
3.3.1 Linearity
Under experimental conditions, the linearity of the proposed spectrophotometric method for determination of SAL using oxidative coupling reaction with KIO3 and AMP was evaluated by analyzing a series of standard solutions (three replicates for each one) of SAL and measured by following the procedure described in the experimental section. Table 4, showed the obtained results from the statistical analysis of data. The calibration graph was linear in the ranges of 2–32 µg mL−1. The regression equation was A = 0.038C – 0.013, (n = 7) and (r = 0.9995).
Parameter
Values
Beer's law limits, μg mL−1
2–32
Regression equation
A = 0.038C – 0.013
Slope
0.038
Intercept
−0.1667
Correlation coefficient, r
0.9995
Molar absorptivity, (L mol−1 cm−1)
9.165 × 10³
Sandell's sensitivity, (μg cm−2)
0.026
Detection Limit, LOD, (μg mL−1)
0.4
Quantification Limit, LOQ, μg mL−1
1.3
% RSD
0.98
Accuracy (%Rec ± SD)
99.6 ± 0.4
Robustness
99.2 ± 0.4
Ruggedness
100.1 ± 0.3
3.3.2 Limit of detection (LOD) and limit of quantitation (LOQ)
The suggested spectrophotometric system displayed high sensitivity to the target analyte with LOD (3.3σ/s) and LOQ (10σ/s) of 0.44 and 1.33 µg mL−1, respectively. The obtained analytical data revealed high sensitivity for SAL determination using oxidative coupling reaction with KIO3 and AMP.
3.3.3 Accuracy and precision
The accuracy of the suggested spectrophotometric method was evaluated by calculating the % mean recoveries of nine SAL solutions in the range of 2 – 32 µg mL−1. The outcome result was 99.6 ± 0.4%, revealing high accuracy of the suggested method (Table 5). Moreover, to study the precision of the suggested method, intra-day and inter-day precision were applied by determining three different concentrations of SAL in pure form through three successive occasions or by replicating the analysis for a period of three successive days (Table 6). The evaluated % RSD ranged from 0.2 to 0.7 % for intra-day assay and 0.1–0.6% for inter-day, revealing good precision of the proposed method towards the determination of SAL.
Sample
SAL determination using KIO3/AMP
Taken, µg mL−1
Found, µg mL−1
% Recovery
1
6
5.99
99.8
2
8
7.89
98.6
3
10
10.00
100.0
4
15
14.96
99.7
5
18
17.87
99.3
6
20
19.99
99.9
7
25
24.95
99.8
8
30
29.97
99.9
9
32
3.89
99.7
Mean ± SD
99.6 ± 0.4
n
9
Variance
0.2
% SE
0.1
Sample
SAL determination using KIO3/AMP
Taken, µg mL−1
Found, µg mL−1
% Recovery ± SD, (n = 3)
% RSD
Intra-day assay
12
11.99
99.9 ± 0.7
0.7
16
15.98
99.9 ± 0.4
0.4
20
19.87
99.3 ± 0.2
0.2
Inter-day assay
12
11.98
99.8 ± 0.3
0.3
16
15.93
99.6 ± 0.6
0.6
20
19.98
99.9 ± 0.1
0.1
3.3.4 Selectivity
The selectivity of the proposed method towards the determination of SAL was evaluated by assaying SAL in the presence of some possible interfering species. Among these are Na+, K +, Ca2+, Mg2+ and Zn2+, starch, glucose, lactose, citric acid and magnesium stearate. Under optimized conditions the detection of 10 µg mL−1 of SAL was investigated in the presence of 1.0 µg mL−1 of each interfering species using the proposed method. As reported in Table 7, no significant interference was observed. Accordingly, the proposed procedure can be considered as a selection method for the determination of SAL.
Interferences
Tolerable values
Na+, K +, Ca2+ , Mg2+ and Zn2+
900
Starch, glucose, lactose
260
Citric acid, magnesium stearate
180
3.3.5 Robustness and ruggedness
The robustness of developed method was measured (ICH guidelines, 2005) by introducing small changes in the method parameters such as change in solvent (using ethanol) and pH (5 ± 0.1). The recorded data were expressed as % recovery. As previously summarized in Table 4 the calculated % recovery was found to be 99.2 ± 0.4. The ruggedness of the suggested spectrophotometric method was investigated by the analysis of the same samples under optimum conditions using different instrument and another operator. The recorded result represented as % recovery and was 100.1 ± 0.3 revealing high robustness and ruggedness of the proposed method for the determination of SAL using oxidative coupling reaction with KIO3 and AMP.
3.4 Stoichiometry of the reaction
The method of continuous variations (Job's Method) was used to determine the reaction ratio of SAL with AMP. In this method a number of equamolar (1 × 10⁻⁴ mol L−1) solutions containing different volumes of SAL (0.1–0.9 mL) and AMP reagent (0.9–0.1 mL) in volumetric flasks of 10 mL. The other solutions are added under the optimum working method and the absorbance is measured against the blank at 499 nm. Fig. 9 shows that the ratio between the SAL and AMP is 1:1. Based on this ratio, the proposed chemical equation for the reaction can be written as follows: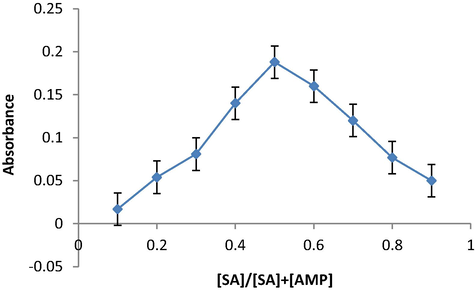
Stoichiometry of the reaction of the proposed method of SAL determination using oxidative coupling reaction with KIO3 and AMP.
Stability constant (K) (Al-Abachi and Al-Ghabsha, 1983) was also calculated for the colour product consisting of a 1:1 ratio of SAL:AMP by the equation:
where c = concentration of the product colour, α = degree of dissociation, As = the absorption of solution containing a stoichiometric amount of SAL and AMP, Am = the absorption of solution containing the same amount of SAL and excess of AMP. The As and Am, were measured at (λ max) of solution. The values of (As, Am, α, K and log K) were classified in (Table 8). The high values of K may indicate the high stability of the prepared colour product.
Colour product
As
Am
α
K L2.mol−2
Log K
SAL:AMP
0.304
0.409
0.256
1.14 × 10⁵
5.05
3.5 Analytical applications
The proposed spectrophotometric method was employed to determine SAL in its bulk drug and the % recovery was ranged from 99.9 ± 0.4 to 100.4 ± 0.3%. Also, the developed method was used to estimate the SAL in its pharmaceutical dosage forms. The obtained data (Table 9) were assessed statistically and then compared with those obtained from other previously spectrophotometric published article (Duraid et al. 2014)which is based on the reaction of SAL with ferric chloride in the presence of potassium ferricyanide in acidic medium, the determination was carried out at a wavelength ranged from 700 to 750 nm, using t-student and F-test at 95% confidence level(Miller and Miller, 1993).
Sample
Taken, µg mL−1
Found, µg mL−1
% Recovery ± SD, (n = 6)
% SE
Reported method
t-test
F-test
Pure drug
10
10.01
100.1 ± 0.7
0.4
99.5 ± 0.8
SE = 0.4
n = 60.87(2.228)*
2.76(5.05)*
15
15.07
100.4 ± 0.3
0.2
20
19.99
99.9 ± 0.1
0.05
Inhaler solution
10
9.99
99.9 ± 0.1
0.05
0.98(2.228)*
3.21(5.05)*
15
15.02
100.1 ± 0.4
0.2
20
19.96
99.8 ± 0.2
0.1
Syrup
10
10.00
100.0 ± 0.7
0.4
1.92(2.228)*
1.77(5.05)*
15
15.02
100.1 ± 0.4
0.2
20
19.98
99.9 ± 0.1
0.05
Tablets
10
9.92
99.2 ± 0.5
0.3
1.84(2.228)*
2.48(5.05)*
15
14.82
98.8 ± 0.1
0.05
20
20.02
100.1 ± 0.2
0.1
4 Conclusion
This study introduced a new simple, fast and accurate spectrophotometric approach based on the oxidative coupling reaction of SAL with potassium iodate and AMP reagents. The developed method provided promising results for determination of SAL in its pure drug and pharmaceutical preparations. The proposed method displayed linear relationship over a concentration range of 2–32 µg mL−1. Also, the obtained results indicated that this technique is simpler and more flexible to detect SAL without the significant interference from other co-formulated species or possible interfering compounds.
Conflict of interest
No conflict of interest associated with this work.
Acknowledgements
The authors express their gratitude to the Samarra drug industry (SDI), Iraq for gifting a pure sample of Salbutamol. Special thanks are due to the department of chemistry-college of Science, Tikrit University, Iraq for the use of its instruments and laboratories.
References
- Salbutamol plastic membrane electrodes based on individual and mixed ion-exchangers of salbutamolium phosphor-tungstate and phosphomolybdate. Analyst.. 2000;125:1129-1133.
- [Google Scholar]
- Potentiometric flow injection determination of salbutamol. Anal. Lett.. 2002;35:39-52.
- [Google Scholar]
- Fundamentals of Analytical Chemistry. Mosul, Iraq: Press of Mosul University; 1983.
- Flow Injection-Spectrophotometric Determination of Salbutamol Sulphate and Pyridoxine Hydrochloride Using 2,4-Dinitrophenylhydrazine. Iraqi J. Sci.. 2013;54(1):6-16.
- [Google Scholar]
- Determination of salbutamol in pharmaceutical and serum samples by adsorptive stripping Voltammetry on a Carbon Paste Electrode Modified by Iron Titanate Nanopowders. Electroanalysis. 2012;24:2013-2020.
- [Google Scholar]
- Separation and determination of abused drugs clenbuterol and salbutamol from complex extractants in swine feed by capillary zone electrophoresis with simple pretreatment. Talanta. 2008;76:282-287.
- [Google Scholar]
- Development and validation of LC-MS/MS method for simultaneous quantitation of testosterone, tranbolone, salbutamol and taleranol in chicken muscle. Ind. J. Chem.. 2014;53:1211-1217.
- [Google Scholar]
- Thin layer chromatography method for the determination of ternary mixture containing salbutamol sulphate, bromhexine hydrochloride and etofylline. J. Pharm. Sci. Res.. 2010;2(2):143-148.
- [Google Scholar]
- Flow-injection spectrophotometric determination of salbutamol with 4-aminoantipyrine. Talanta. 2004;64:1233-1236.
- [Google Scholar]
- Spectrophotometric Analytical method for Determination the Drug Compound Salbutamol by using Prussian blue Complex. Bag. J. Sci.. 2014;11(2):303-310.
- [Google Scholar]
- Developed Spectrophotometric Determination of Salbutamol sulphate in Pharmaceutical Samples by Coupling with O-Nitroaniline. Iraq. J. Sci.. 2008;49(1):12-17.
- [Google Scholar]
- ICH guidelines: Validation of analytical procedures: text and methodology Q2(R1), 2005
- Development and Validation of HPLC Method for the Simultaneous Estimation of Ketotiden and Salbutamol in Bulk and Dosage Form. WJPPS. 2013;2(6):6109-6128.
- [Google Scholar]
- Spectrophotometric determination of salbutamol in bulk form and in various dosage forms. The Experiment. 2013;7:445-449.
- [Google Scholar]
- Reverse phase isocratic HPLC method for simultaneous estimation of Salbutamol sulphate and beclomethasone dipropionate in rotacaps formulation dosage forms. Int. J. Pharm. Pharm. Sci.. 2011;3:64-67.
- [Google Scholar]
- Statistics for analytical chemistry (3rd Ed.). New York: Ellis Horwood PTR Prentice Hall; 1993.
- Validated UV spectroscopic method for estimation of Salbutamol from tablet formulations. Arch. Appl. Sci. Res.. 2010;2:207-211.
- [Google Scholar]
- High performance liquid chromatographic method development and its validation for salbutamol. British J. Pharm. Res.. 2012;2:228-237.
- [Google Scholar]
- Spectrophotometric simultaneous estimation of salbutamol and Ambroxol in bulk and formulation. Asian J Pharm. Clin. Res.. 2011;4(3):42-45.
- [Google Scholar]
- A New RP-HPLC Method Development For Simulataneous Estimation Of Salbutamol, Theophyline and Furosemide. Int. J. Pharm. Sci. Res.. 2015;6(4):683-688.
- [Google Scholar]
- London, UK: John HB and John MB, Wolters K; 2004. p. :96-99.
- Determination of salbutamol in human plasma and urine using liquid chromatography coupled to tandem mass spectrometry and its pharmacokinetic study. Biomed. Chromatogr.. 2012;26(10):1176-1182.
- [Google Scholar]


