

Translate this page into:
Utilization of multispectral landsat-8 remote sensing data for lithological mapping of southwestern Saudi Arabia
⁎Corresponding author. akahal@ksu.edu.sa (Ali Y. Kahal)
-
Received: ,
Accepted: ,
This article was originally published by Elsevier and was migrated to Scientific Scholar after the change of Publisher.
Peer review under responsibility of King Saud University.
Abstract
The upper plutonic rocks in southwestern Saudi Arabia has been mapped through Landsat 8 Operational Land Imager (OLI) data. The gathered field rock samples were subjected to spectral measurements (in the range of 0.4–2.5 µm) in the laboratory using a GER 3700 spectroradiometer. Integrated remote sensing techniques, including the band ratio, principal component analysis (PCA), and Gram-Schmidt spectral sharpening have been applied through this study. The red–greenblue composites of the pan-sharpened original bands (3, 4, and 7), principal components (PC3, PC1, and PC2), and band ratios 5/6 and 5/7 were found to be the most useful to delineate the study area’s Upper Proterozoic plutonic rocks. The results of image processing methods, spectral reflectance analyses are in good agreement with the field data. The spectral reflectance curves of the collected samples and the corresponding Landsat 8 pixels match well. It is indicated that Landsat-8 image data has great capability to identify lithological units and could be applicable in several areas in arid and semiarid environments.
Keywords
Landsat 8
Mapping
Image transform
Saudi Arabia
Spectral measurements
Reflectance

1 Introduction
The delineation of lithological units and geological mapping were conducted using different airborne and spaceborne multispectral (e.g., Landsat 8, ASTER, ALI, QuickBird, and WorldView-3) and hyperspectral remote sensing data (e.g., Hyperion and AVIRIS) (Loughlin, 1991; Abrams et al., 1988; Rowan and Mars, 2003; Ciampalini et al., 2013). The digital format of remote sensing data enables image processing to be applied to extract or enhance information useful for mapping purposes. The band ratio, image classification, principal component analysis (PCA), minimum noise fraction, decorrelation stretch, spectral angle mapper, and matched filtering are remote sensing technique examples frequently used to detect and map minerals and rocks (Gahlan and Ghrefat, 2018). The visible–infrared (0.4–14 μm) region of the electromagnetic spectrum is commonly used to identify different minerals and rocks based on their spectral reflectance properties (Hunt, 1977). The electronic processes in transition metals are dominated in the visible–near infrared (VNIR) region (Hunt, 1977). Carbonates, hydrates, and hydroxide minerals exhibit absorption features at short wavelengths (Hunt, 1977). Spectral discrimination of silicate minerals is identified by using the thermal infrared wavelength region (3–20 μm), which can provide information complementary to that from VNIR and shortwave infrared (SWIR) regions (Hunt, 1977; Gaffey et al., 1993; Hapke, 1993; Clark, 1999; Hook et al., 1999).
The reflectance spectral curves of rocks depend on their mineralogical composition and texture properties including packing, mixing, and grain size (Hunt, 1977; Clark, 1999). Such spectral reflectance data can be directly used to infer the lithology and hydrothermal alteration of rocks and minerals in semiarid and arid environments. The presence of opaque minerals in rocks very distinctly affects the reflectance spectra of rocks because it decreases their total reflectance. Basic, mafic, and intermediate igneous rocks are characterized by low reflectance compared with acidic igneous rocks (Clark, 1999).
Remote sensing studies have not been conducted in the study area in the past. The goals of the present study are to identify and map various lithological units and geological structures using Landsat 8 Operational Land Imager (OLI) data combined with field investigations. Various spectral processing techniques including PCA, band ratio, and Gram–Schmidt (GS) spectral sharpening were selected to map the known lithological units in the study area, especially mafic–ultramafic and igneous rocks. The results of this study can be used for geologic mapping in other arid and semiarid regions.
2 Study area and geologic setting
Sarat Abidah is located in southwestern Saudi Arabia and covers the area between 18°00′N–18°09′N in latitude and 43°18′E–43°32′25′′E in longitude (Fig. 1). Recently, this area has been selected by the Saudi General Authority for Antiques and Tourism as one of the promising sites for tourism. Consequently, the development and promotion of this area is attracting the attention of governmental authorities.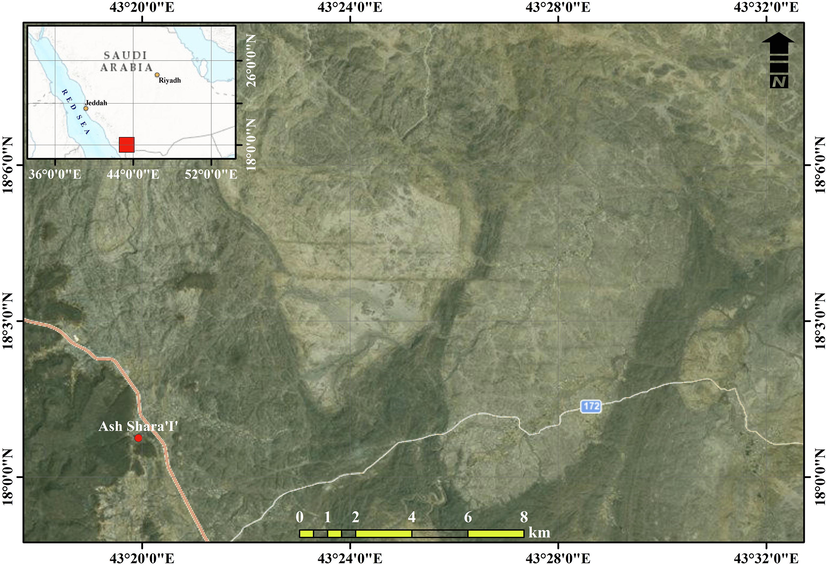
Location map of the study area.
The geological map of the study area is shown in Fig. 2. Upper Proterozoic metamorphosed volcanic and sedimentary rocks of the Baish, Bahah, Jeddah, Ablah, and Halaban groups and Upper Proterozoic plutonic rocks ranging from gabbro to granite in composition underlay the area. The Baish, Bahah, and Jeddah groups represent the older ensimatic-arc complex, and the Ablah and Halaban groups represent the continental margin complex. The rocks of both complexes have undergone regional metamorphism to the greenschist or amphibolite facies and have been affected by several episodes of deformation and intrusion from Proterozoic igneous rocks (Fig. 2) (Greenwood, 1985).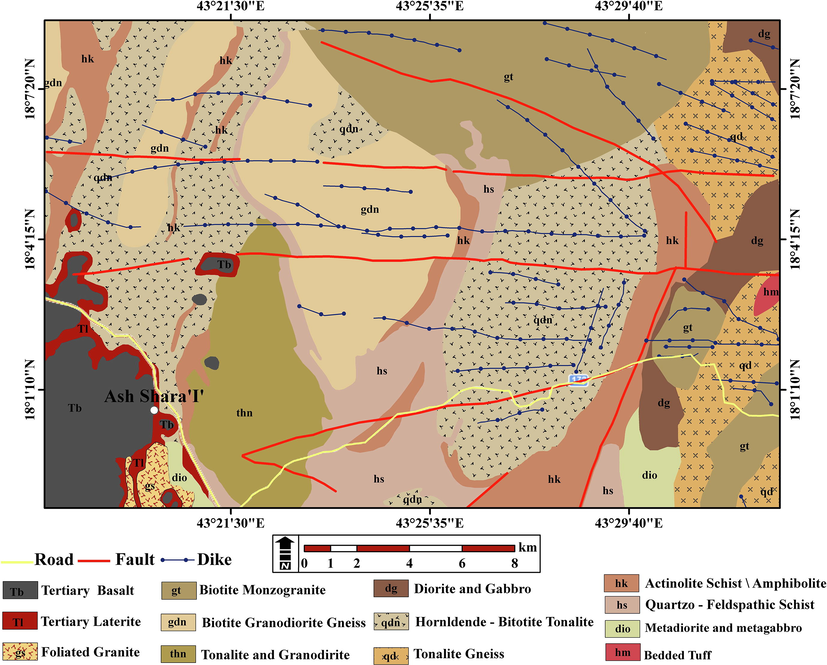
Geological map generated from Landsat 8 data.
Upper Proterozoic rocks contain muscovite–biotite granodiorite rocks, which form several domical plutons and conformable bodies in layered rocks. These rocks are light gray to pink, fine- to medium-grained, and weakly foliated to gneissic. They are made of plagioclase, quartz, microcline, and subordinate amounts of muscovite and biotite (Stoeser, 1984). The hornblende–biotite tonalite and granodiorite unit is characterized by massive to weakly foliated rocks. The rocks of this unit are predominantly light to medium gray and medium-grained tonalite but range in composition from granodiorite to monzogranite. The rocks contain plagioclase, quartz, hornblende, biotite, and variable amounts of microcline. The biotite granodiorite and monzogranite are strongly foliated and form much of what was mapped as Khamis Mushaut gneiss by Coleman (1973a, b). The granodiorite is mainly composed of plagioclase, microcline, quartz, and biotite. It is locally graded into tonalite and monzogranite. The foliated biotite–hornblende granodiorite is widespread in the study area. The tonalite–biotite–hornblende and granodiorite unit ranges in composition from granodiorite to tonalite and is coarse-grained and massive. The rocks consist of oligoclase, quartz, microcline, biotite, hornblende, and muscovite. Diorite and gabbro are exposed in the eastern part of the study area and exhibit a wide range of relative ages based on crosscutting plutonic contacts and various degrees of metamorphism.
Phanerozoic volcanic rocks in the area are represented by Tertiary basalt and laterite. Tertiary laterite is present as a residual soil zone preserved under and near the Tertiary basalt. The laterite is red, yellow, and white and ranges from 20 to 30 m in thickness. It typically has a ferruginous pisolitic cap, which is 1 to 2 m thick, and is underlain by 2–4 m thick clay-rich and bleached zones that rest on a lower section of commonly sharp saprolite (Overstreet et al., 1977).
The Tertiary basalt unit forms many smaller flat-lying exposures in the western corner of the study area. The unit is dark gray and ranges in composition from hypersthene-normative basalt to alkali picrate and alkali olivine basalt. This unit is > 580 m thick and includes 20 lava flows (Coleman et al., 1977a). Numerous, generally north-trending faults or fault zones are superimposed on volcanic arc complexes and Proterozoic intrusive rocks spread throughout the southern part of the Arabian Shield and divide the shield into several north-trending belts (Greenwood et al., 1982). The belt-bounding fault zones (Fig. 3) separate rock units that appear to differ in age, metamorphic grade, deformation style, or lithofacies. Five belts are found in the Abha quadrangle; from west to east, they are the Bidah, Ablah, Tayyah, Khadra, and Tathilth belts.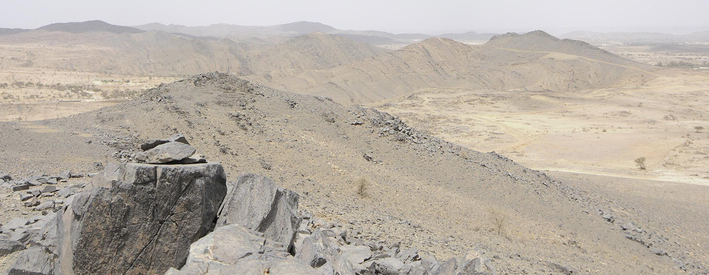
Photograph showing the shear zone in the study area.
The study area is in the Khadra Belt in which early structures appear to consist of open to tight, northwest-trending, similar folds and axial-plane schistosity formed during dynamothermal metamorphism to the greenschist facies (Greenwood, 1985). Gneissic and foliated plutons were emplaced as coalescing sills and massive diapirs controlled by earlier structures. Ductile faults and mylonite zones, now mostly annealed or recrystallized, appear to have formed as the result of regional compression during earlier intrusive events. Many of the younger plutons are cut by diversely trending transverse faults. West–northwest trending faults and fracture zones filled in several locations with dikes. These younger plutons appear to have been emplaced during a general reduction of regional compression.
3 Methods and materials
3.1 Image processing of Landsat 8 data
Landsat-8 was launched from Vandenberg Air Force Base, California on February 4, 2013. Each Landsat 8 image includes 11 spectral bands: five in the VNIR region, two in the SWIR region, two in the thermal infrared region, and one panchromatic band (band 8) (Gahlan and Ghrefat, 2018). The spatial resolution of these bands ranges from 15 to 100 m (Table 1). Two additional bands represent the difference between Landsat 8 and Landsat 7 ETM+: Landsat 8 is a deep blue coastal/aerosol band, and Landsat 7 ETM + is a shortwave infrared cirrus band.
Subsystem
Band number
Spectral range (µm)
Ground resolution (m)
Swath width (km)
VNIR
1
0.433–0.453
15
185
2
0.450–0.515
3
0.525–0.600
4
0.630–0.680
SWIR
5
0.845–0.885
30
6
1.560–1.660
7
2.100–2.300
8
0.500-0.680
9
1.360-1.390
The Landsat 8 OLI data acquired over the study area (path 165 and row 43) on March 10, 2017, are of L1T type. These data, acquired on March 10, 2017, were radiometrically and geometrically corrected. Accurate correction was achieved using ground control chips and a digital elevation model (DEM) (Lee et al., 2004). Image processing of Landsat 8 data was performed using Environment for Visualizing Images (ENVI 5.1) software.
The Quick Atmospheric Correction (QUAC) method was used in this study to convert digital number (DN) values of Landsat 8 data into reflectance data and reduce the effects of atmospheric scattering. The method is based on the average reflectance of a collection of diverse material spectra being basically scene-independent, as determined empirically (ITT, 2009).
Red-green–blue (RGB) color combination images using Landsat 8 (OLI) were selected primarily based on the spectral reflectance properties of dominant rock types in the Sarat Abidah area. Red, green, and blue additive colors were used to display the multispectral bands of Landsat 8 data with the color composite method, in which the spectral response of minerals indicates maximum reflectance. Selected bands in the visible and infrared portions of the electromagnetic spectrum were combined to produce the RGB color images (Gaffey, 1986; Evans, 1988; Crosta and McMoore, 1989).
The PCA method was applied to multispectral and hyperspectral remote sensing data to produce uncorrelated output bands, segregate noise components, and reduce the dimensionality of these data (Loughlin, 1991; Ciampalini et al., 2013; Gahlan and Ghrefat, 2018). PCA is performed by identifying a new set of orthogonal axes whose origin is at the data mean and are rotated such that data variance is maximized.
Variations related to topography, overall reflectance variations, and brightness differences related to grain size can be suppressed using the band ratio technique (Abrams et al., 1983; Abrams, 1984; Sultan et al., 1987; Abdelsalam et al., 2000a, 2000b; Gahlan and Ghrefat, 2018). However, this method emphasizes the spectral reflectance shape differences. The band ratio images are generated by dividing the DN values of pixels in a band with high total reflectance by the DN values of corresponding pixels in a band with low total reflectance (Jensen 1996). The selection of band ratios is based on the spectral signatures of dominant lithological units that potentially exist in the region (Kusky and Ramadan, 2002).
In the current study, GS spectral sharpening (Laben and Brower, 2000; Aiazzi et al., 2007) was used to sharpen low-spatial-resolution multispectral Landsat 8 data (bands 3, 4, and 7) with high-spatial-resolution panchromatic data (band 8). In this method, the mean brightness value of each band in the multispectral image is subtracted from each pixel value of that band and then all bands are orthogonalized. Subsequently, the low-resolution panchromatic band (band 8) is simulated by using the orthogonalized and wavelength-matching bands of the multispectral image. This simulated band corresponds to the first band of the GS transformation. The original high-spatial-resolution panchromatic image statistics are then adjusted to match the first band. After the statistical matching, the adjusted panchromatic band is subtracted from the GS transformation bands to obtain a new transformed band set. Finally, an inverse GS transformation is applied to obtain the pansharpened digital image.
3.2 Spectral measurements and field verification
Representative rock samples were collected from different locations in the study area. A photograph of each sample was taken and the geographic coordinates of each locality were noted using GPSMAP 276C. Reflectance spectra of the samples were obtained in the visible to shortwave infrared regions (0.4–2.5 μm) using a GER 3700 spectrometer (ITT, 2009). An external light source, for which the distance between the sensor and the sample was ≈25 cm, was used to conduct the spectral measurements. The source of illumination was a 500-W halogen lamp and the position was set to ≈45°. The spectrometer sensor was vertically positioned above the sample. The GER 3700 spectrometer uses 640 bands between 0.315 and 2.519 μm and its spectral sampling ranges from 0.0015 to 0.012 μm. The ground field of view of the instrument is ∼ 100 cm2.
4 Results and discussion
4.1 Reflectance spectroscopy
Laboratory spectra of the collected rock samples in the VNIR and SWIR regions (0.4–2.5 µm) are shown in Fig. 4. The spectra of biotite granodiorite gneiss and bedded tuff exhibit absorption features at 1.4, 1.9, and 2.2 µm, corresponding to OH and H2O absorption bands. The spectra of tonalite schist, actinolite schist, hornblende biotite tonalite, and amphibolite exhibit absorption bands corresponding to ferrous (Fe+2) and ferric (Fe+3) iron at ∼ 0.7 and ∼ 1.0 µm, respectively (Clark, 1999). In addition to MgOH, OH and H2O absorption (at 1.4 and 1.9 µm, respectively) dominate the spectral features of these rocks. The Landsat 8 convolved spectral plot of the collected rock samples is shown in Fig. 5. The spectral reflectance of biotite granodiorite gneiss and bedded tuff in all spectral bands of Landsat 8 is higher than that of the other collected rocks. These two rocks exhibit the highest reflectance at band 6 and the lowest reflectance at band 2. The spectra of tonalite gneiss, actinolite schist, hornblende–biotite tonalite, and amphibolite convolved to Landsat 8 bandpasses exhibit lower reflectance values at Landsat 8 band 5 owing to the presence of iron. These rocks have a lower reflectance in the VNIR region (bands 2–5) and a higher reflectance in the SWIR region (bands 6 and 7; Fig. 5).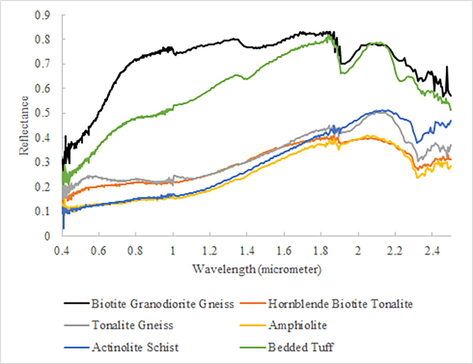
Reflectance spectra (0.4–2.5 μm) of the samples measured using the GER 3700 spectrometer.
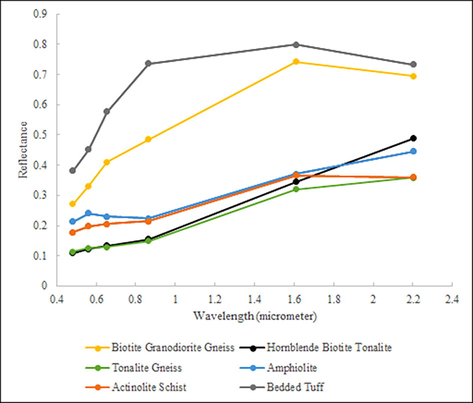
Landsat 8 convolved spectral plot of the collected rock samples.
4.2 Lithological mapping
Fig. 6 shows 7–5–3 Landsat 8 data, representing the RGB color combination image used for geological mapping in the study area. Generally, this RGB color combination exhibits a notable color variation corresponding to the various rock types. Actinolite schist is shown in dark red, whereas biotite and granodiorite gneiss is shown by white pixels. Areas covered with biotite tonalite are pinkish gray. The visual interpretation of this image was compared with a published geological map covering the same area (Fig. 2), and the two are in good agreement.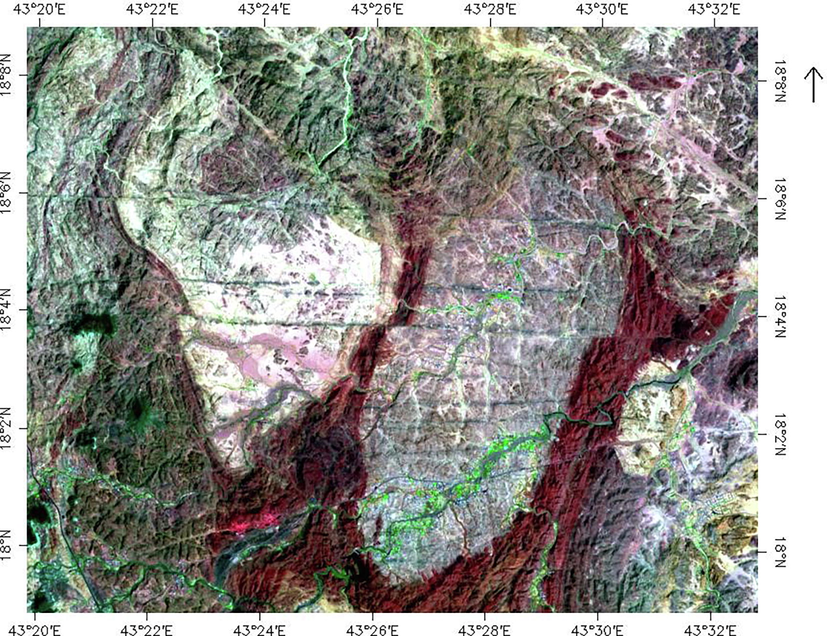
RGB composite of bands 7 (red), 5 (green), and 3 (blue) of Landsat 8 OLI data of the study area. Actinolite schist in red, basalt in green, biotite granodiorite gneiss in white, and biotite tonalite in pinkish gray.
The PCA results revealed that the largest percentage of data variance is represented by the first PC (PC1), while the last PC (PC6) exhibits very little variance owing to the presence of noise in the original spectral bands of Landsat 8 data. More colorful color composite images are produced using PCA as instead of the spectral color composite images as the spectral bands are uncorrelated. Fig. 7 shows PCA bands 3, 1, and 2 in RGB for the study area. Nearly all the rock units distributed in the study area were detected and mapped using the above-mentioned false color composite PCA image. PCA enhances biotite tonalite (bright orange pinkish pixels), biotite granodiorite gneiss (dark orange pinkish colors), actinolite schist (cyan pixels), tertiary basalt (green pixels), and biotite monzogranite rocks (blue pixels). The PCA results reveal that PC3 was the best in highlighting the lineaments in the study area (Fig. 7). Structural information is well exhibited in the Landsat 8 image; undocumented shear zones, prominent faults, and lineaments of regional significance were detected, thereby revealing the geological nature of the area. Most faults exhibit strike–slip shear. The most prominent trends of these faults are E–W and N–S.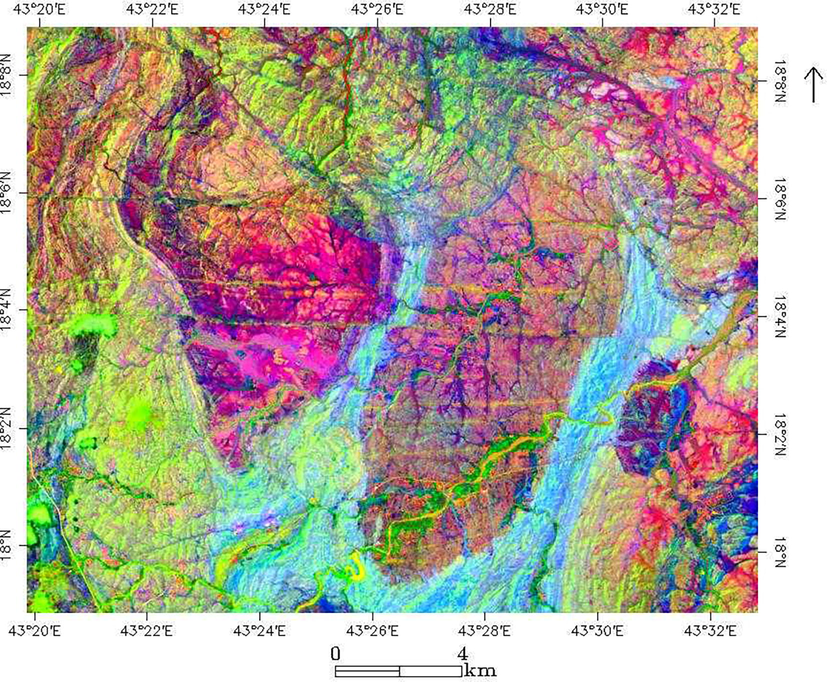
Color composite of the first three PCA eigenchannels depicted in red (PC3), green (PC1), and blue (PC2) for Landsat 8 data. Actinolite schist in cyan, biotite granodiorite gneiss in dark orange pinkish colors, and biotite tonalite in bright orange pinkish pixels.
Discrimination of the rock units was accomplished using the band ratio technique applied to Landsat data (Frei and Jutz, 1989; Sabins, 1999; Abdelsalam and Stern, 1999; Kusky and Ramadan, 2002; Gad, 2002; Gahlan and Ghrefat, 2018). In the present study, the Landsat 8 band ratios 5/6 and 5/7 were highly effective in differentiating the various rock units in the study area (Fig. 8). Actinolite schist and amphibolite and quartzo-feldspathic schist rocks are shown by white pixels and igneous and metamorphic rocks are presented by dark pixels. Actinolite schist and amphibolite and quartzo-feldspathic schist rocks are characterized by higher reflectance values at Landsat 8 band 6 and an absorption feature at band 5.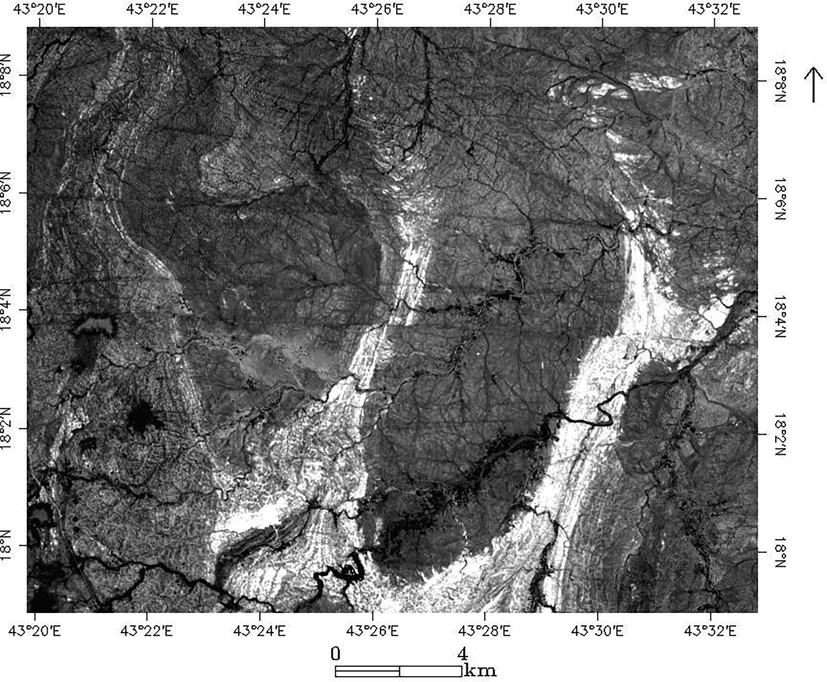
Landsat 8 OLI band ratio 6/5 image showing actinolite schist in white pixels.
The geological features of the study area were highlighted using the 3–4–7 pan-sharpened color composite image of Landsat 8 (Fig. 9). Generally, these color combinations exhibit color variations corresponding to various geological units in the study area. This method provided the best results among all the methods used in this study with respect to discriminating diorite and gabbro from actinolite schist and amphibolite. Diorite and gabbro are shown by blue colors, actinolite schist and amphibolite are green, basalt is black, and biotite granodiorite gneiss is presented in white.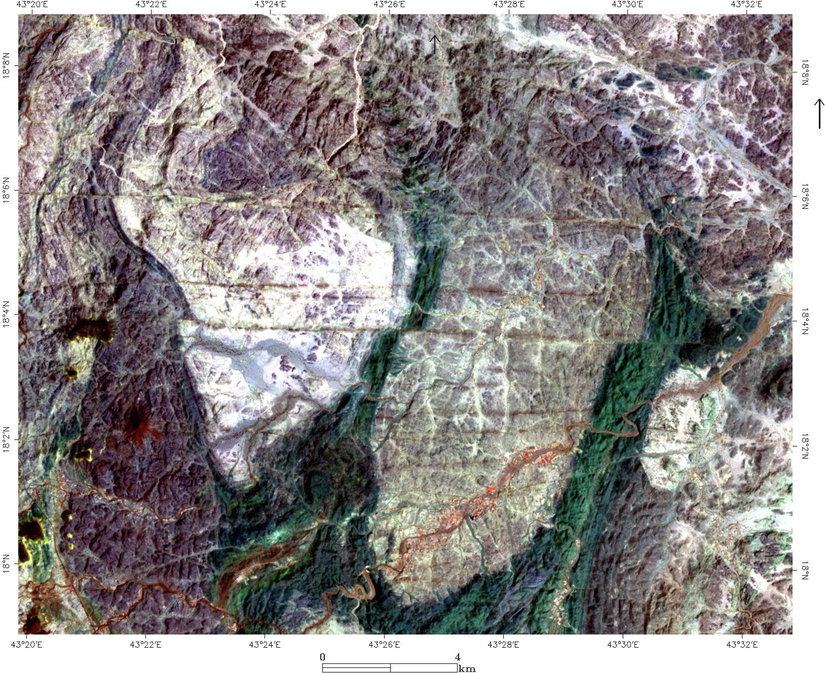
RGB composite of pan-sharpened bands 3 (red), 4 (green), and 7 (blue) of Landsat 8 OLI data of the study area. Diorite and gabbro are displayed in bluish green, actinolite schist in green, basalt in black, biotite granodiorite gneiss in white, and tonalite and granodiorite in violet.
The results of the current study demonstrate the usefulness of Landsat 8 OLI data for geologic mapping because of the high signal-to-noise ratio of these multispectral data. The fieldwork supports the geological maps obtained from the band ratio, pan sharpening, and PCA. The results demonstrate a good correspondence between the maps produced from the Landsat 8 data and the published geologic map. The images generated from the above-mentioned image processing methods discriminate the rock units and lineaments in the study area better. Geological mapping of the study area was improved by GS spectral sharpening. Based on this method, various igneous and metamorphic rocks in the study area can be better discriminated. Spectral information from all bands can be utilized in the PCA method. The effects of shadows and different slope orientations can be minimized by using the band ratio. Discrimination of different rock types is better using the band ratio compared with RGB band combinations. A new geological map of the study area was created and produced by combining the results of PCA, band ratio, and spectral sharpening.
5 Conclusions
Remote sensing methods including the band ratio, GS spectral sharpening, and PCA were applied to process Landsat 8 OLI data to delineate the geological units in the study area. These methods were useful and the results based on the images generated by PCA, pan sharpening, and band ratio are in good agreement. Analyzing surface and geological features using remote sensing data is of importance for geological studies over large regions with little or no in situ data. The combination of multispectral optical Landsat 8 data and laboratory spectral measurements with field data proved to be a valuable tool for mapping lithological units in the study area. The GS spectral sharpening method is more accurate than the other methods. This method uses the spectral response function of a given sensor to estimate what the appearance of the panchromatic data.
Acknowledgements
The authors extend their appreciation to the Deanship of Scientific Research at King Saud University for funding this work through research group No. RGP-1438-059.
Declaration of Competing Interest
The authors declare that they have no known competing financial interests or personal relationships that could have appeared to influence the work reported in this paper.
References
- Applications of orbital imaging radar for geologic studies in arid regions: the Saharan testimony. Photogramm. Eng. Remote Sens.. 2000;66:717-726.
- [Google Scholar]
- Mapping gossans in arid environments with Landsat TM and SIR-C images: the Beddaho alteration zone in northern Eritrea. J. Afr. Earth Sci.. 2000;30:903-916.
- [Google Scholar]
- Mineral exploration with satellite remote sensing imagery: examples from Neoproterozoic Arabian shield. J. Afr. Earth Sci.. 1999;28:4a.
- [Google Scholar]
- Recent developments in lithologic mapping using remote sensing data. Bureau de Recherches Geologiques et Minieres. 1984;82:177-189.
- [Google Scholar]
- M.J. Abrams D. Brown L. Lepley R. Sadowski Remote sensing for porphyry copper deposits in southern Arizona 78 4 1983 1983 591 604.
- Mapping in the Oman Ophiolite using enhanced Landsat Thematic Mapper images. Tectonophysics. 1988;151(1-4):387-401.
- [Google Scholar]
- Improving Component Substitution Pansharpening Through Multivariate Regression of MS+Pan Data. IEEE Trans. Geosci. Remote Sens.. 2007;45(10):3230-3239.
- [Google Scholar]
- Remote sensing techniques using Landsat ETM plus applied to the detection of iron ore deposits in Western Africa. Arab J. Geosci.. 2013;6:4529-4546.
- [Google Scholar]
- Spectroscopy of Rocks and Minerals, and Principles of Spectroscopy. In: Rencz A.N., ed. Manual of Remote Sensing. New York: John Wiley and Sons; 1999. p. :3-58.
- [Google Scholar]
- Coleman, R.G., 1973a. Reconnaissance geology of the khybar quadrangle (18/42 B), Kingdom of Saudi Arabia: Saudi Arabian Directorate of Mineral Resources, Geologic Map GM-4 scale 1:000,000; text, 5 p.
- Coleman, R.G., 1973b. Reconnaissance geology of the Khamis Mushayt quadrangle (18/42 D), Kingdom of Saudi Arabia: Saudi Arabian Directorate of Mineral Resources, Geologic Map GM-5 scale 1:000,000; text, 6 p.
- Coleman, R.G.; Fleck, R.J.; Hedge, C.E.; Ghent, E.D., 1977a. The volcanic rocks of the southwest Saudi Arabia and the opening of the Red Sea, in Red Sea research 1970-1975: Saudi Arabian Directorate of Mineral Resources Bulletin 22, D1–D30.
- Enhancement of landsat Thematic Mapper imageryfor residual soil mapping in SW Minas Gerais State Brazil: a prospecting case history in greenstone belt terrain. In: Seventh Thematic Conference on Remote Sensing for Exploration Geology. Calgary, Alberta, Canada: ERIM; 1989. p. :1173-1187.
- [Google Scholar]
- Multi-sensor classification of sedimentary rocks. Remote Sens. Environ.. 1988;25(2):129-144.
- [Google Scholar]
- Use of Thematic Mapper data for the detection of gold bearing formations in the eastern Desert of Egypt. In: Proceedings of the 7th thematic conference on remote sensing for ore exploration geology II. 1989. p. :1157-1172.
- [Google Scholar]
- Exploration for mineralized granites in Central Eastern Desert, Egypt. M.Sc: Thesis, Faculty of Science, Aswan, South Valley University, Egypt; 2002. p. :118.
- Spectral reflectance of carbonate minerals in the visible and near infrared (0.35–2.55 microns): calcite, aragonite, and dolomite. Am. Mineral.. 1986;71:151-162.
- [Google Scholar]
- Ultraviolet, visible, andnear-infrared reflectance spectroscopy: laboratory spectra of geologicmaterials. In: Pieters C.M., Englert P.A.J., eds. Remote Geochemical Analysis: Elemental and Mineralogical Composition. NY, USA: Cambridge University Press; 1993. p. :43-77.
- [Google Scholar]
- Detection of Gossan Zones in Arid Regions Using Landsat 8 OLI Data: Implication for Mineral Exploration in the Eastern Arabian Shield, Saudi Arabia. Natural Resources Research. Natural Resources Research. 2018;27(1):109-124.
- [Google Scholar]
- Greenwood, W.R., 1985. Explanatory notes to the geologic map of the Abha quadrangle, Sheet 18F, Kingdom of Saudi Arabia.
- Greenwood, W.R.; Stoeser, D.B.; Fleck, R.J.; Stacey, J.S., 1982. Late Proterozoic island-arc complexes and tectonic belts in the southern part of the Arabian Shield, Kingdom of Saudi Arabia: Saudi Arabian Deputy Ministry for Mineral Resources Open-File Report USGS-OF-02-8, 46 p
- Hapke B., ed. Theory of Reflectance and Emittance Spectroscopy. Cambridge University Press; 1993.
- Multispectralthermal infrared data in geological studies. In: Rencz A.N., ed. RemoteSensing for the Earth Sciences (3rd ed.). John Wiley & Sons; 1999.
- [Google Scholar]
- Spectral signatures of particulate minerals in the visible and near infrared. Geophys.. 1977;42(3):501-513.
- [Google Scholar]
- ITT., 2009. Atmospheric correction module: QUAC and FLAASH user’s guide (http://www.exelisvis.com/portals/0/pdfs/envi/Flaash_Module.pdf).
- Introductory Digital Image Processing. Prentice Hall Series in Geographic Information Science; 1996. p. :318p.
- Structural controls in the Neoproterozoic Allaqi suture: an integrated field, Landsat TM, and radar C/X SIR SAR images. J. Afr. Earth Sci.. 2002;35:107-121.
- [Google Scholar]
- Process for enhancing the spatial resolution of multispectral imagery using pan-sharpening. United States Patent No.. 2000;6011875
- [Google Scholar]
- Four years of Landsat-7 on-orbit geometric calibration and performance. IEEE Transactions on Geoscience and Remote Sensing. 2004;42(12):2786-2795.
- [Google Scholar]
- Principal component analysis for alteration mapping. Photogramm Eng Remote Sensing.. 1991;57:1163-1169.
- [Google Scholar]
- Overstreet, W.C.; Stoeser, D.B.; Overstreet, E.F.; Goudarzi, G.H., 1977.Tertiary laterite of the As Sarat Mountains, Asir Province, Kingdom of Saudi Arabia: Saudi Arabian Directorate of Mineral Resources Bulletin 21, 30 p.
- Lithologic mapping in the Mountain Pass, California area using Advanced Spaceborne Thermal Emission and Reflection Radiometer (ASTER) data. Remote Sens Environ.. 2003;84(3):350-366.
- [Google Scholar]
- Stoeser, D.B., 1984. Plutonic rock distribution map of the southern Arabian Shield, Kingdom of Saudi Arabia. Saudi Arabian Deputy Ministry for Mineral Resources Open-File Report USGS-OF-04-51
- Lithologic mapping in arid regions with Landsat TM data: Meatiq dome. Egypt. Geol. Soc. Am. Bull.. 1987;99:748-762.
- [Google Scholar]


