

Translate this page into:
Use of various statistical techniques to assess the vertical and lateral change in the groundwater chemistry of Quaternary aquifer in an irrigated highly populated area
⁎Corresponding author. Osman.badran@sci.dmu.edu.eg (Osman M. Badran)
-
Received: ,
Accepted: ,
This article was originally published by Elsevier and was migrated to Scientific Scholar after the change of Publisher.
Peer review under responsibility of King Saud University.
Abstract
A large Hydrogeochemical data were obtained from the central Nile delta aquifer system where 167 groundwater samples were gathered from three depth zones and analyzed for majors and minors. Different statistical techniques were applied to the analyzed geochemical data. The target of the current investigation is to find the principle factors and processes controlling the variation in the hydrogeochemistry in the three groundwater zones. The physicochemical analysis revealed that concentrations of majors (K, Na, Ca, Mg, HCO3, Cl and SO4) with some traces as NO3, Si, NH4 and Fe decrease from the shallow zone to reach its lowest values in the deep zone because of the surface hydrologic and anthropogenic factors affect the shallow groundwater. The studied groundwater classified into five series, every series has its own hydrochemical type. It is revealed that the shallow groundwater was affected by surface hydrochemical process, soil salinity and water–rock interaction as main sources of groundwater salinity. There are two origins of the deep groundwater, one is fresh flowing from south to north and the other is influenced by the intruded seawater in the northern part of the investigated region. The groundwater of the intermediate zone is a mix between the shallow groundwater and the deep groundwater.
Keywords
Nile Delta
Quaternary aquifer
Seawater intrusion
Statistical analysis
Cluster analysis
Factor analysis

1 Introduction
Due to the shortage of precipitation and fresh surface water in arid regions, undergroundwater is amongst the most valuable natural resources. In these regions, subsurface water is regularly portrayed by considerable spatio-temporal changeability (Gemail et al., 2017). Under certain chemical conditions, mineral dissolution is considered as a natural dissolution source in some aquifers (Rasool et al., 2015) and (Hend Hussien et al., 2021). Recently, incredible stress on the limited water resources in arid regions has been occurred due to population growth and rising life levels (Moosavirad et al., 2013). Therefore, excessive pumping of the groundwater and limited recharge led to degradation and depletion in groundwater (Kulmatov et al., 2015). Besides, expanded utilization of fertilizers for yield improving can increment contamination of groundwater (El Alfy and Faraj, 2016).
Various multivariate statistical methods, for example, cluster analysis (CA), principle and factor analysis (FA) give strong help with the understanding of complicated data sets. These types of data analysis lead to better understanding of hydrogeochemistry and water resources management of the investigation area (Simeonov et al., 2004). Salem et al. (2015), Armanuos et al. (2016), Salem and Osman (2017) and ElKashouty (2019) utilized statistical methods to explore the salinity sources and the geochemical processes in the Quaternary aquifer of the Nile Delta.
Well-proven multivariate techniques were utilized to examine the geochemical information by utilizing hierarchical cluster analysis (HCA), Correlation matrix, and Factor analysis (FA) to distinguish the predominant procedures influencing the geochemistry of the groundwater in the area of study.
2 Methodology
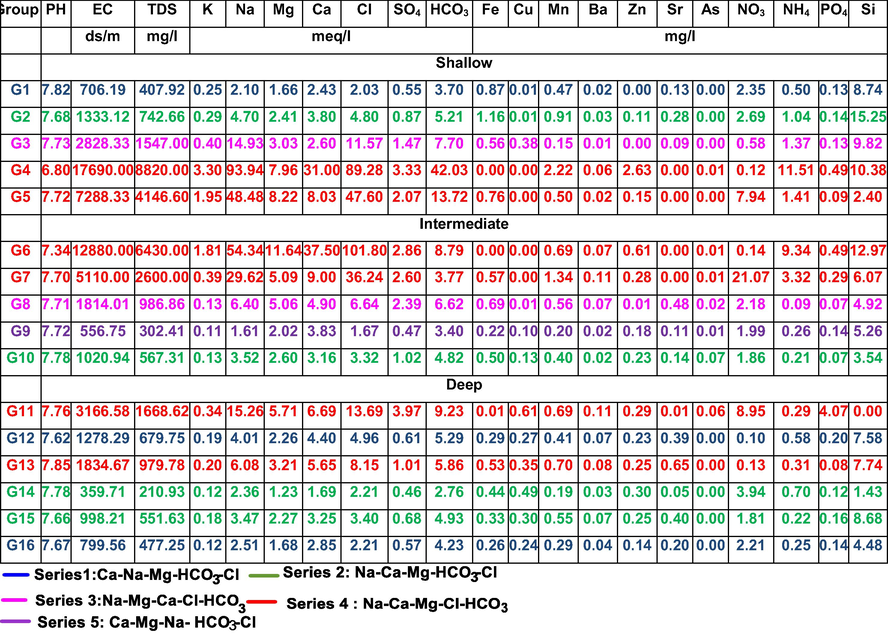
Groundwater was gathered from 167 water wells in the study area (Fig. 1). The statistical analysis of the hydrochemical measurements of the gathered samples are listed in Table 1. To assess the three-dimensional change in the hydrochemistry of the considered groundwater, the collected groundwater samples (Fig. 1) were grouped into shallow groundwater (less than 40 m depth, Fig. 1b), intermediated groundwater (41–60 m depth, Fig. 1c), and deeper groundwater (>60 m depth, Fig. 1d). Sampling procedure and field measurements were done according to standard methods as discussed in details in Salem et al. (2017a) and Salem et al. (2017b), Salem et al. (2018). Max = maximum, Min = minimum, SD = standard deviation, n = number of samples.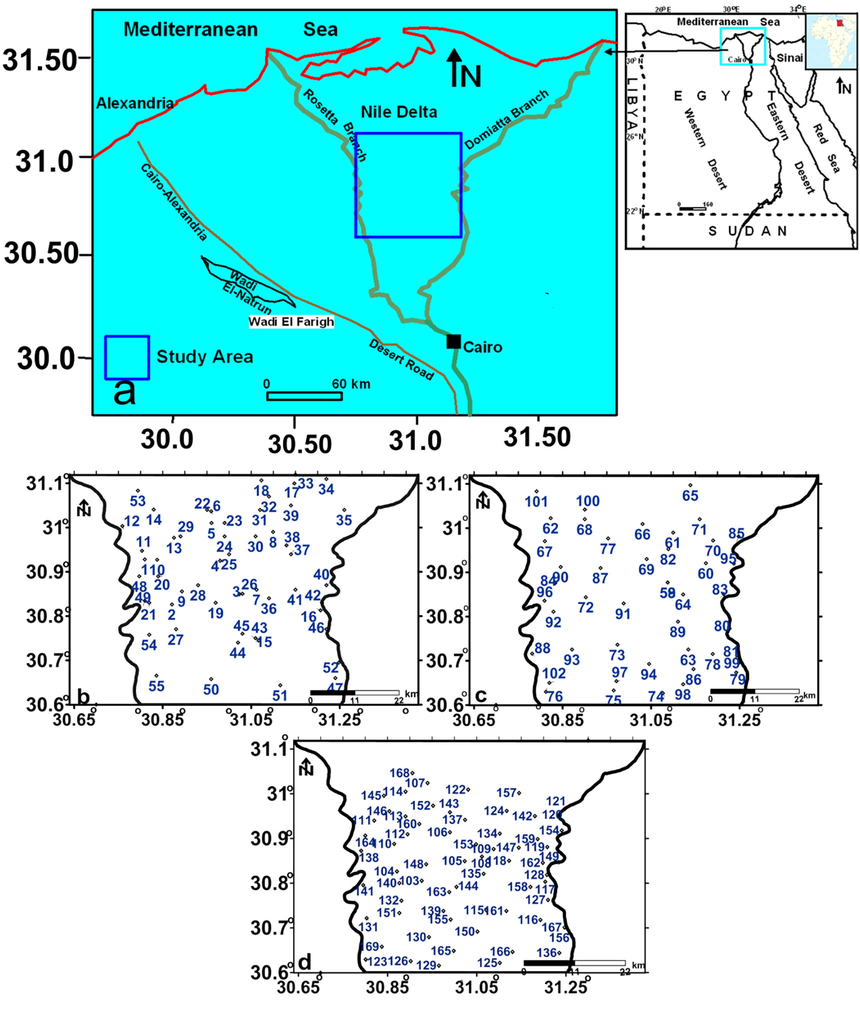
Location map of the study area (a) and the groundwater gathered samples location maps (b-d) for shallow, intermediate and deep zones, respectively.
Shallow groundwater (n = 55)
Intermediate groundwater (n = 45)
Deep groundwater (n = 67)
Unit
Min
Max
Mean
SD
Min
Max
Mean
SD
Min
Max
Mean
SD
PH
–
6.8
8.31
7.73
0.25
7.34
8.4
7.74
0.23
7.3
8.45
7.69
0.19
EC
µs/cm
10.73
33,580
2002.08
4647.05
288.33
12,880
1484.20
1996.75
325
3890
1166.86
710.71
TDS
mg/l
210
8820
1135.59
1604.89
173
6430
794.33
995.63
180
1940
640.71
372.31
K
mg/l
0.6
62
9.70
14.53
1
70.65
6.89
10.12
1.538
20.21
6.65
3.93
Na
mg/l
24.17
2160
239.68
442.16
13
1252
134.45
219.92
15.7
499.3
97.48
99.42
Mg
mg/l
10.5
207
34.25
33.59
4
141.4
38.49
26.96
6.56
110
28.79
18.77
Ca
mg/l
24
620
80.84
90.19
8.4
750
84.39
109.08
9.22
230
74.87
38.24
Cl
mg/l
37.3
3166
356.88
657.15
16
3610
252.58
576.54
17.02
748.06
158.82
143.33
SO4
mg/l
0.2
519.26
64.88
101.97
0.3
190.33
58.85
46.83
0
519.57
42.47
74.33
HCO3
mg/l
142.1
2575.00
439.36
404.25
73.17
575
294.38
126.51
88
904
303.14
121.86
Fe
mg/l
0
4.90
0.93
1.12
0
3.3
0.67
0.90
0
1.47
0.30
0.34
Cu
mg/l
0.001
1.15
0.09
0.27
0
1.280701
0.18
0.35
0
1.95
0.40
0.58
Mn
mg/l
0
2.76
0.64
0.54
0
1.946
0.63
0.48
0.036
1.43
0.44
0.39
Ba
mg/l
0.023
0.21
0.08
0.07
0
0.2818012
0.06
0.08
0
0.55
0.08
0.10
Zn
mg/l
0.006
2.63
0.31
0.76
0.0049
1.54
0.36
0.42
0
1.37
0.28
0.38
Sr
mg/l
0
1.21
0.49
0.35
0
1.288014
0.33
0.43
0.0004
1.372
0.40
0.43
As
mg/l
0.00015
0.01
0.00
0.00
0
0.973986
0.09
0.25
0
0.147
0.01
0.03
NO3
mg/l
0
42.00
2.94
7.12
0
42
3.99
9.11
0
6.64
0.26
0.93
NH4
mg/l
0
11.51
1.04
1.90
0
9.34
1.02
2.25
0
5.59
0.74
1.07
PO4
mg/l
0.12
0.67
0.38
0.15
0
0.73
0.15
0.21
0.06
12.14
1.18
2.77
Si
mg/l
9.722
53.66
31.74
13.53
0
39.71
8.36
12.96
0
35.85
7.07
11.88
3 Study area
Investigated region is situated in the central part of the middle Nile Delta (Fig. 1a). Mit Ghar Formation is the fundamental aquifer and characterized by sandy facies and covered with clayey Bilqas Formation. Thickness of Mit Ghamr Formation has a most extreme thickness (1172 m) to the north and it is made essentially out of thick beds of sands with clay and gravel interbeds, which dates to the Late Pliocene-Pleistocene (Said, 1981; Salem et al., 2020). Mit Ghamr Formation sediments were most likely deposited under deltaic and additionally costal to fluvial conditions (Salem, 2009; Salem and El-Nahrawy, 2020).
4 Results and discussion
4.1 Hydrogeochemical data
As shown in Table 1, EC and TDS have the heights values in the shallow groundwater and decrease gradually in the intermediate groundwater to reach its lowest value in deep groundwater (Fig. 2a-c). The increase in the salt concentration in the shallow zone might be related to human activities, processes of water rock interchange and sea water intrusion. According to Winslow and Kister (1956), the measured salinities of the collected groundwater samples (Table 1) range from fresh to moderately saline. Respectively, the lowest values of TDS (mg/l) for the shallow, intermediate and deep groundwaters are 210, 173 and 180, the highest values are 8820, 6430 and 1940 and the average values are 1146.495, 794.33 and 640.71. The pH values of the groundwater samples from shallow to deep zones range from 6.8 to 7.7, 7.3 to 8.4 and 7.3 to 8.5 with an average values 7.7, 7.74 and 7.7, respectively (Table 1), indicating slightly alkaline waters.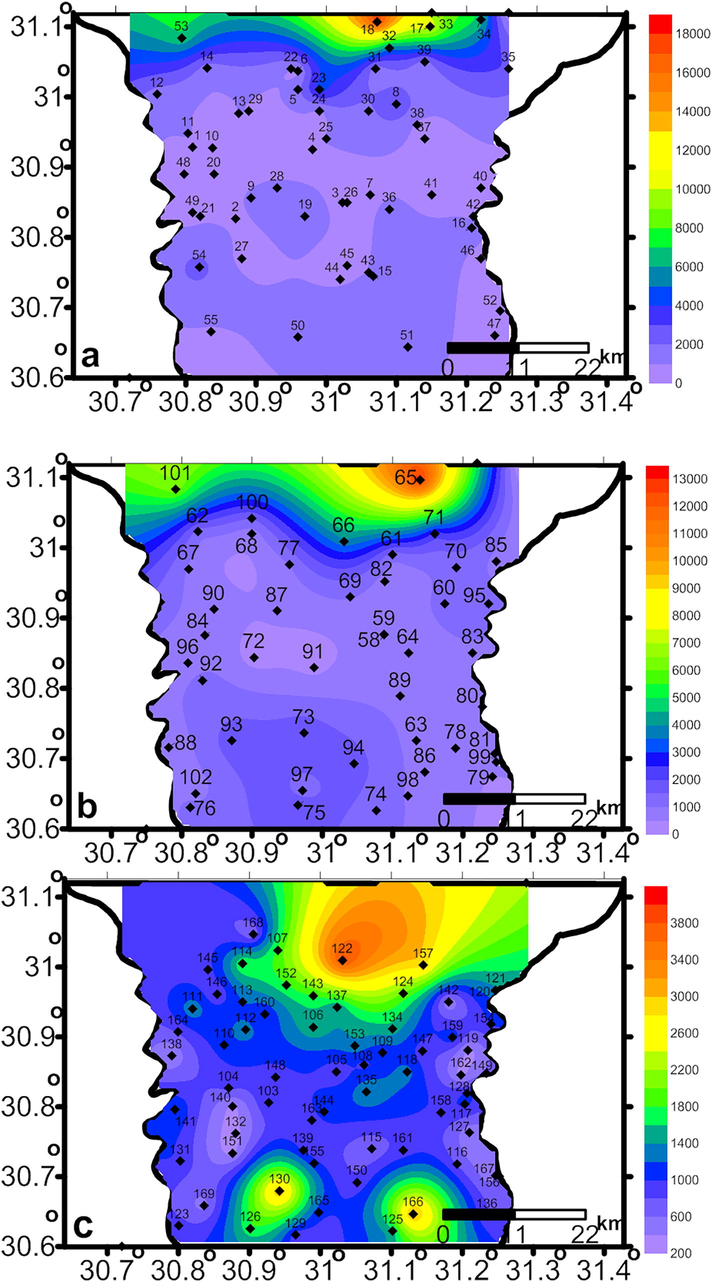
The spatial distribution of the groundwater EC (ds/m) in the shallow zone (a) intermediate zone (b) and (c) the deep zone.
The elements concentrations of the shallow groundwater (Table 1) reveal that sodium, calcium, magnesium, chloride, bicarbonate have the highest concentration of the majors and some trace elements as NO3, Si, NH4 and Fe showed significant effect. In the intermediate groundwater (Table 1) dominance of sodium, calcium, magnesium, bicarbonates and chloride with some traces of NO3, Si and NH4 were recognized. In the deep groundwater (Table 1), sodium and chloride have the highest concentrations among the majors with significant effect of calcium, magnesium, bicarbonate and sulfate. Some trace elements as NO3, Si, NH4 and PO4 are of considerable concentrations. It is observed that the concentration of majors decrease from the shallow zone to reach its lowest values in the deep zone due to secondary salts leaching and some human activities on the land surface.
4.2 Correlation analysis
Generally, in the shallow zone (Table 2a), major ions (except SO4), EC and TDS are highly correlated to each other indicating that the salinity of this groundwater is related to surface and soil hydrochemical processes like evaporation, organic matter decay and not related to seawater intrusion. Sulfates low correlation values with the other ions could be related to the use of sulfate ion for carbonate production as shown in Eq. (1).
values listed in red font are strong positive correlation, blue font are intermediate positive correlation, values listed in green font are weak correlation.

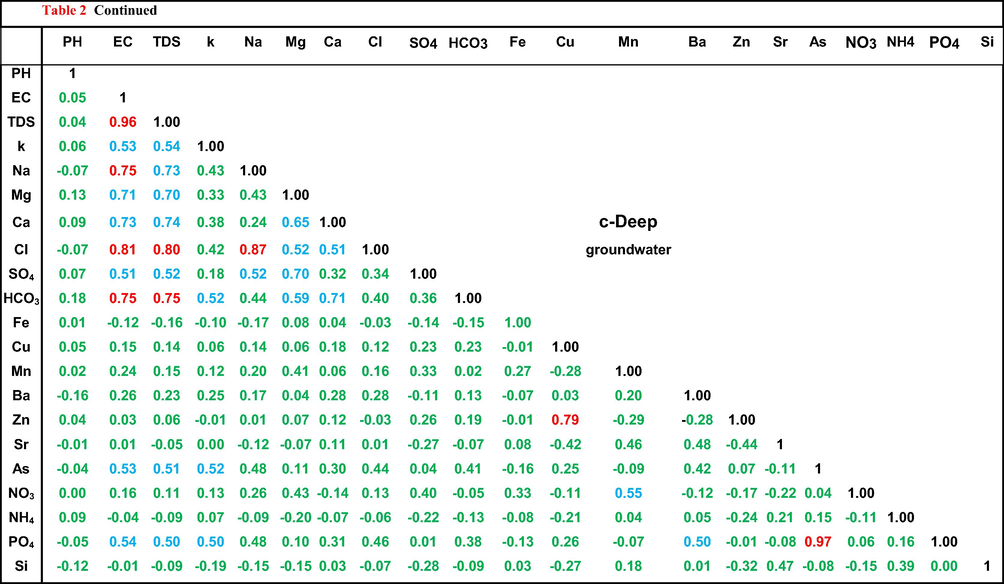
The former idea is clearly confirmed by moderate to strong correlation values between NH4 and EC, TDS and most of major ions and trace elements. Zn and As might be added to the shallow groundwater due to surface and soil hydrochemical processes as well as the sewage seepage, as they moderately correlated with salinity and most of the measured ions.
In contrast to the shallow groundwater, HCO3, Zn, and As in the intermediate groundwater (Table 2b) showed low correlation values with most of the measured parameters. This might be related to the attenuation in the effect of surface and soil hydrochemical processes. The strong relationships between EC and TDS, K, Na Ca and Cl are related to seawater intrusion as well as the silicate mineral weathering where Ca is not related to either calcite (Ca-HCO3, r = 0.43) or gypsum (Ca-SO4, r = 0.37) dissolutions. NH4 showed a strong relationships with EC, TDS, K, Na and Cl, and moderate relationships with Ca. These relationships could be considered as an indication of nitrate reduction into ammonia in seawater–freshwater circulation zone as shown in Eq. (2).
The deep groundwater (Table 2c) showed a quite different trend compared to the shallow and the intermediate groundwater. Strong relationships were noticed between EC, TDS, Na and Cl due to seawater intrusion effect. HCO3 showed strong relations with EC and TDS and intermediate relationship with Ca indicating freshwater as a second major source of groundwater in this zone. NH4 has weak relationships with all ions revealing the complete decay of the surface activities effects.
4.3 Hierarchical cluster analysis (HCA)
In the present study, cluster analysis (CA) was employed for distinguished geochemical groups among sample sites based on content of selected elements. The obtained dendograms were used to define five geochemical series based on the physico-chemical parameters of the samples. The analysis of the dendograms reveals some indications of the level of similarity between the obtained groups of the shallow, intermediate and deep groundwater (Fig. 3a, b and c, respectively). Regarding the shallow groundwater, samples of G4 and G5 are linked to that of G1, G2 and G3 at an elevated distance, indicating that these samples (18, 17, 23, 32, 33, 34 and 53) which occupy the northern part of the area (Fig. 1b) are geochemically distinct from the other samples. Also, samples of G6 and G7 geochemically different from other sample groups of the intermediate groundwater and G11 samples are different compared to the other sample groups of the deep groundwater.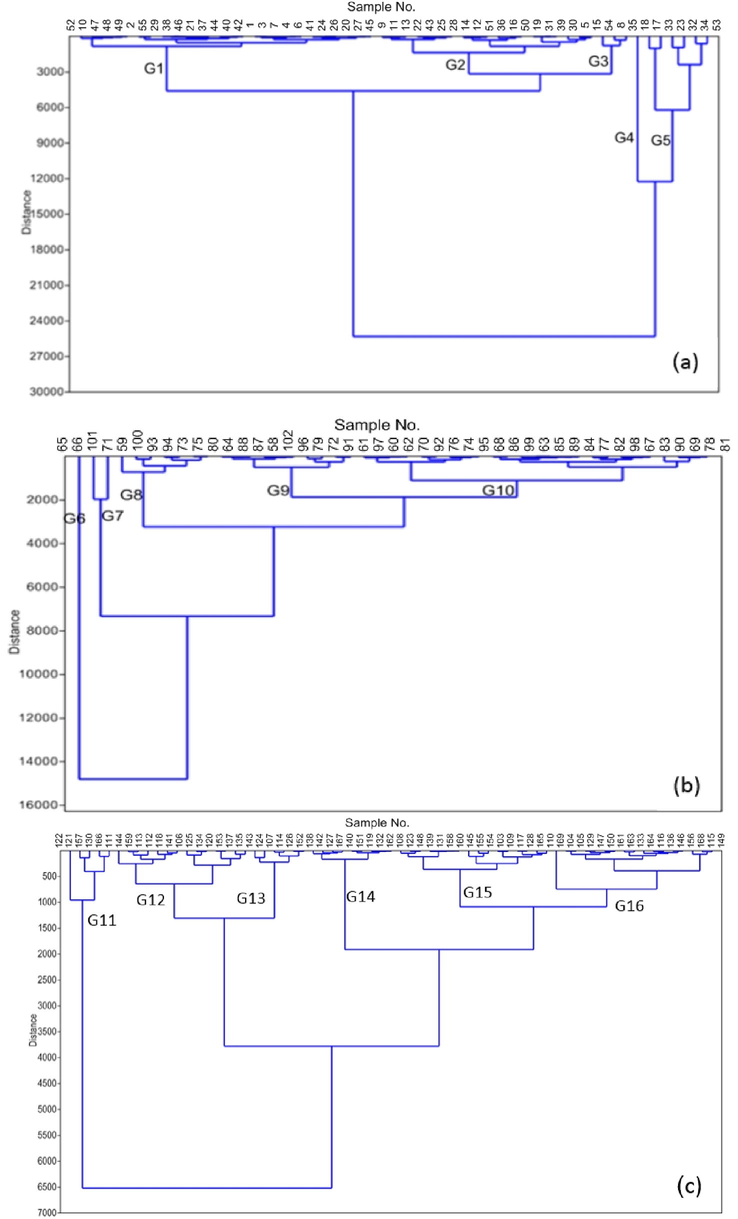
Dendogram diagram shows the grouping of shallow (a), intermediate (b) and deep groundwater samples (c).
To simplify the statistical classification of the collected samples, the geochemically similar groups in the three groundwater zones were gathered in one series. Maps and Schoeller diagrams which shown in Fig. 4 illustrate the hydrochemical composition and spatial distribution of these series. Series 1 contains samples from G1 (shallow groundwater) and G12 and G16 (deep groundwater) (Table 3 and Fig. 4). This series has the minimum TDS average values 407.92 mg/l (G1), 679.75 mg/l (G12), 477.25 mg/l (G16) and of Ca-HCO3 groundwater type (Ca > Na > Mg and HCO3 > Cl > SO4) (Table 3 and Fig. 4). Samples of this series are located in the central parts, southeastern and southwestern corners of the investigated region in the shallow zones, not represented in intermediate zone, and occupy the central and northwestern parts of the deep groundwater zone.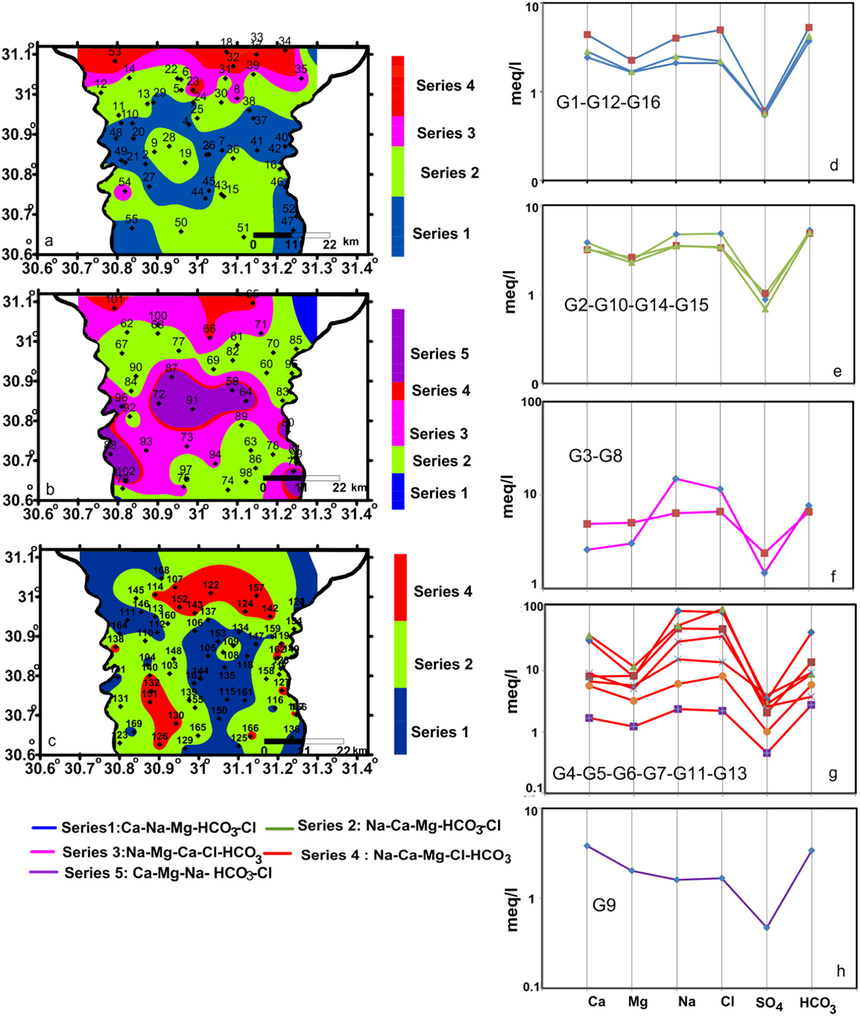
Spatial distribution maps of the sample series for the shallow (a) intermediate (b) and deep (c) groundwater zones; a-h are schoeller diagrams for series 1–5 describe the hyrochemical type of every series.
Series 2 contains samples from G2 (shallow groundwater), G10 (intermediate) and G15 (deep groundwater). It has TDS average values 742.66, 567.31, 551.63 mg/l, respectively and is of Na-HCO3 groundwater type (Na > Ca > Mg and HCO3 > Cl > SO4) (Table 3 and Fig. 4). Chemical type of series 2 is the predominant type in the shallow and deep zones and occupy a considerable area in the intermediate groundwater. Groundwater belong to this series was affected by calcium-sodium ion-exchange process due to either infiltrated water and clayey soil interaction in the shallow zone or fresh water–seawater interactions in the intermediate and deep groundwater zones according to Eq. (3).
Series 3 contains G3 (shallow groundwater) and G8 (intermediate) with TDS average values 1547 and 986.86 mg/l, respectively and of Na-Cl hydrochemical type (Na > Mg > Ca and Cl > HCO3 > SO4) (Table 3 and Fig. 4). Samples of series 3 are represented only in the shallow and intermediate groundwater and located to the northern part of series 2 (which is of Na-HCO3). Groundwater chemistry of this series could be related to the surface hydrological and human activities. Series 4 was represented in the shallow groundwater by G4 and G5 with TDS average values 8820 and 4146.60 mg/l, respectively, in the intermediate groundwater by G6 and G7 with TDS average values 6430 and 2600 mg/l, respectively and in deep groundwater by G11, G13 and G14 with TDS average values 1668.62, 979.78 and 210.93 mg/l, respectively. This series has Na-Cl groundwater type (Na > Ca > Mg and Cl > HCO3 > SO4) (Table 3 and Fig. 4) which reflects the effect of seawater intrusion in the three groundwater zones. Series 5 samples were located only in the central part of the intermediate groundwater zone with TDS average values 302.41 mg/l and of Ca-HCO3 (Ca > Mg > Na and Cl > HCO3 > SO4) (Table 3 and Fig. 4). This series represents the fresh groundwater samples in the investigated region which formed due to direct seepage from the irrigation canals.
4.4 Graphical representation
The Piper diagrams are a graphical representation of the groundwater chemistry labeled according to samples respective series of HCA (Fig. 3). As shown in Fig. 5, Na and Ca are the major cations and Cl and HCO3 are the main anion in most of the samples. The groundwater in the three zone is characterized by two main water types and two mixing types. HCO3-CO3 and Ca + Mg is the predominant type where most of the groundwater samples are plotted. SO4 + Cl and Na + K type is also recorded and represented in the northern parts of the investigated region where seawater intrusion affects the groundwater. The mixing types are represented by samples either have increased concentrations percentages of Ca + Mg and Cl + SO4 or have increase concentrations percentages of Na + K and HCO3-CO3. The first mixing conditions occurred due to seawater intrusion while the second condition is represented by few samples and might be happened due to refreshining process.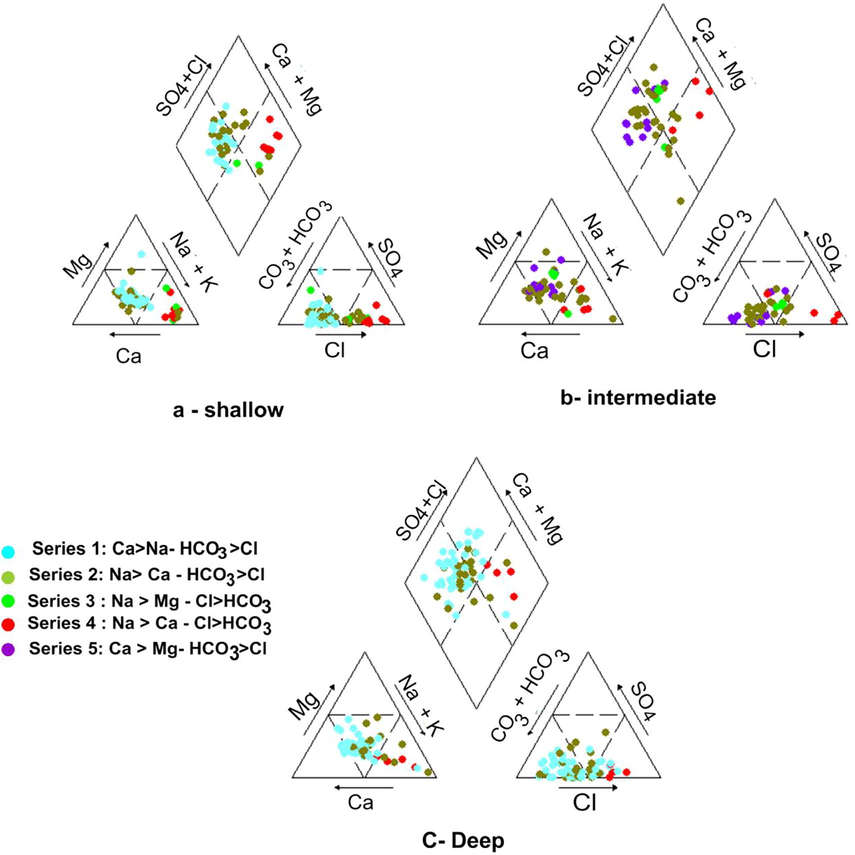
Piper diagram illustrates the genetic types of the shallow, intermediate and deep groundwater of the study area.
4.5 Factor analysis (FA)
Twelve factors with higher eigenvalues were identified, which formally can be assessed as statistically significant factors. The first four major factors with the highest eigenvalues explain 77.10 % (shallow), 68.59% (intermediate), 65.13% (deep) of the total variance in the data set of the studied groundwater (Fig. 6). Table 4 represents the most reliable results of factor analyses. For the shallow groundwater (Table 4), the first factor (F1) explains 42.60% of the all-out difference and was estimated as the main consideration controlling the general extents of significant component existing in the groundwater samples and had the high loadings of TDS, EC, K, Na, Cl, Mg, Ca, HCO3, NH4 and Zn indicating that these variables have common patterns. It also has an intermediate loading of Mg, SO4 and As. This means the major ions in the shallow groundwater is not related to seawater but might be affected by surface and soil hydrochemical processes. Further, it had a moderately negative loading for pH, showing that in samples with high TDS and much more SO4, pH will drop. The main ions that remain dissolved in phreatic water are Na, Mg, Ca, SO4 and Cl and the loading of those ions on Factor1 ranged from 0.53 to 0.974, therefore the concentrations of k, Na, Mg, Ca, SO4 and Cl in the phreatic water gradually increase with TDS of groundwater. The intermediate to good loading of Zn, As and NH4 on factor 1 is most probably contributed to anthropogenic sources due to farmer agrochemical pesticides and waste water infiltration to the shallow groundwater. values listed in red font are high positive and negative loading, blue font are intermediate positive and negative loading, values listed in green font are weak positive and negative loading.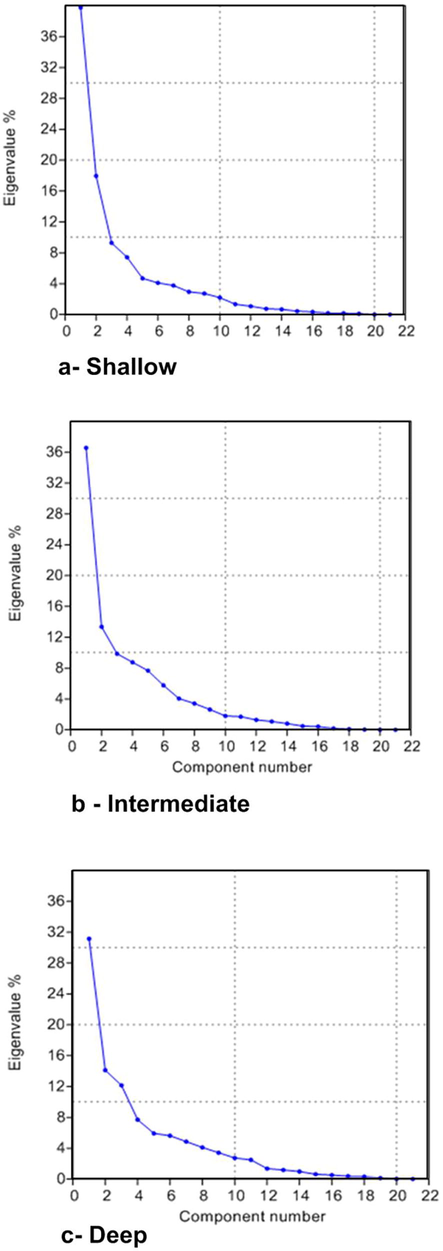
The scree plot curve for the shallow, intermediate and deep groundwater.
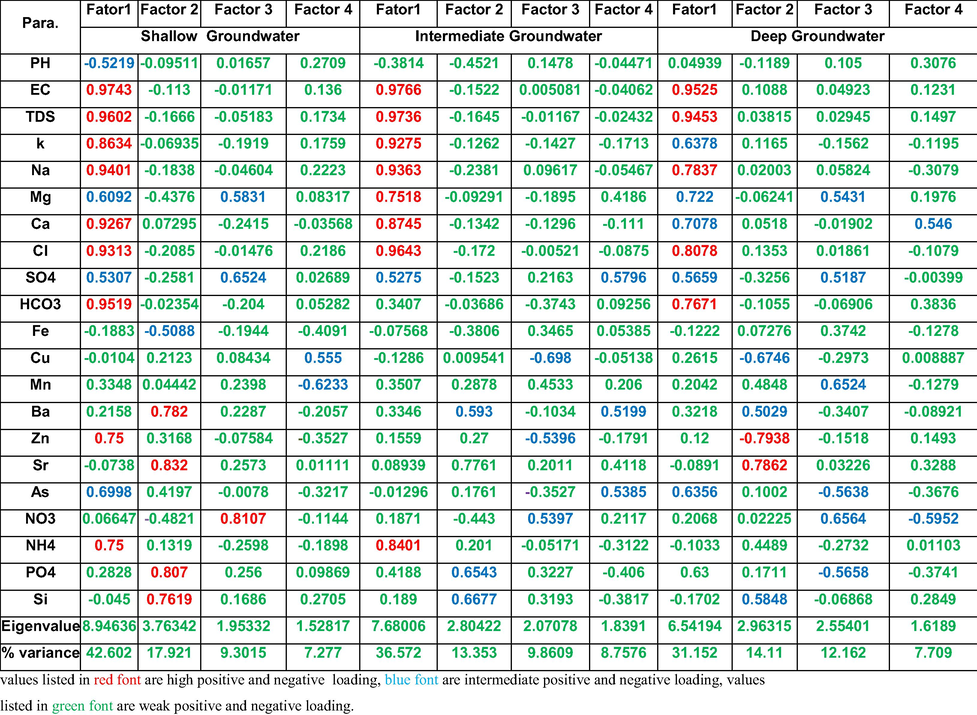
Seawater is considered a secondary origin of the dissolved ions in the shallow groundwater because of the higher load of seawater related ions on factors 2 like Ba and Sr (0.78 and 0.83, respectively). This seawater might have higher concentration of PO4 and Si as their loads are 0.8 and 0.76, respectively. Mg, SO4 and NO3 have a considerable loading on F3 (0.58, 0.65 and 0.81, respectively) indicating the old origin of closed lake water because that was a common phenomenon in the old Nile Delta. Mn and Cu loads in factor 4 could be related to water–rock interaction.
Factor 1 in the intermediate groundwater (Table 4) has higher loads of EC, TDS, K, Na, Ca, Cl and NH4 similar to that of the shallow zone while the load of Mg is increased and that of HCO3 is decreased. This means the intermediate groundwater is a mix between the shallow groundwater (which is highly affected by surface activities and soil zone) and the deep groundwater which affected by seawater intrusion. Intermediate to high loads of Ba, Sr, PO4 and Si in factor 2 are indicating seawater intrusion effect. Intermediate loads of NO3 in factor 3 and SO4 in factor 4 could be referred to the oxidation processes which led to formation of nitrates and sulfates.
Factor analysis for the deep groundwater zone (Table 4) reflect that F1 shows very good positive loading for EC, TDS, Na, Cl and HCO3 and good positive loading for K, Mg, Ca, As and PO4. These ions association indicate presence of two origins of the deep groundwater. One is fresh flowing from south to north and the other was affected by seawater intrusion in the northern direction. Factor 2 includes positive strong loads of Sr, intermediate positive loads of Ba and Si, negative intermediate and strong loads of Cu and Zn, respectively. This could be explained by the increase the effect of minor elements related to seawater intrusion and decrease of that related to the anthropogenic pollution which was common in the shallow zones. Combination of the positive intermediate loads of SO4, Mn, and NO3 and negative intermediate loads of AS and PO4 in factor 3 is an indication of the oxidation conditions where SO4 were used for NO3 production and release of Mn.
In factor 4 a positive and negative intermediate loads were observed for Ca and NO3, respectively, which might be related to another source of Ca related to country rock weathering as in shown in Eq. (4)
5 Conclusions
Hydrochemical data showed that the TDS (mg/l) ranges in the shallow, intermediate and deep groundwater zones are 210 to 8820, 173 to 6430 and 180 to 1940 with average values 1146.495, 794.33 and 640.71, respectively. Values of the pH in the three zones are of average values 7.7, 7.74 and 7.7, respectively. The physicochemical analysis revealed that concentrations of majors (K, Na, Ca, Mg, HCO3, Cl and SO4) with some traces as NO3, Si, NH4 and Fe decrease from the shallow zone to reach its lowest values in the deep zone because of the surface hydrologic and anthropogenic factors affect the shallow groundwater.
Correlation matrix showed different correlation relationships represented as very strong, intermediate and weak in the three zones. Geochemically, the cluster analysis classified the groundwater samples into five groups (G1-G5) in the shallow zone, five groups (G6-G10) in the intermediate zone and 6 groups (G11-G16) in the deep zone. To simplify the statistical classification of collected samples, the geochemically similar groups in the three groundwater zones were gathered in one series producing five series. Groundwater type of series one is Ca > Na > Mg and HCO3 > Cl > SO4, series 2 is Na > Ca > Mg and HCO3 > Cl > SO4, series 3 is Na > Mg > Ca and Cl > HCO3 > SO4, series 4 is Na > Ca > Mg and Cl > HCO3 > SO4 and series 5 is Ca > Mg > Na and Cl > HCO3 > SO4.
According to Piper diagrams, Na and Ca are the major cations and Cl and HCO3 are the main anions in the majority of the all groundwater samples. It was revealed that shallow groundwater characterized by four water types Na-Cl, Ca-HCO3, Na-Mg-Cl and Na-HCO3. Intermediate groundwater classified into four chemical types Na-Cl, Ca-Mg-HCO3-Cl, Na-Mg-Cl and Na-HCO3. The deep groundwater has three chemical types Na-Cl, Ca-HCO3, and Na-HCO3.
Factor analysis showed that the shallow groundwater was affected by surface hydrochemical process, soil salinity and water–rock interaction as main sources of groundwater salinity. Sea water is a secondary origin of the dissolved ions. The factor analysis revealed that there are two origins of the deep groundwater, one is fresh flowing from south to north and the other is affected by seawater intrusion in the northern directions of the investigated region. Factor analysis also showed that the intermediate groundwater is a mix between the shallow groundwater (which is heavily affected by surface and soil zones) and the deep groundwater which mainly affected by seawater intrusion.
Factor 1 in the three groundwater zones showed that the northern part of the study area was affected by salt water activity due to the influence of either surface and soil processes in the shallow zone and sea water intrusion in the deep zones. The positive representation of factor 2 in the three zones represented all over the study area.
Factor 3 in the shallow groundwater showed high scores due to the effect of salt water activity. In the intermediate groundwater, Factor 3 indicates high scoring where high effect of NO3 with negative loading mainly of Zn as well as majors and TDS. Factor 3 in the deep groundwater represented by positive scores. The positive scores of factor 4 are mainly related to the dissolved ions of fresh water origin like Ca and HCO3 while that of negative scores indicate seawater intrusion which is the main source of water salinity.
Acknowledgements
Deep thanks and gratitude to the Researchers Supporting Project number (RSP-2021/351), King Saud University, Riyadh, Saudi Arabia for funding this research article.
Declaration of Competing Interest
The authors declare that they have no known competing financial interests or personal relationships that could influence the work reported in this paper.
References
- Groundwater quality investigation using multivariate analysis-Case Study: Western Nile Delta Aquifer. Egypt. International Journal of Environmental Science and Development. 2016;7(1):1-9.
- [Google Scholar]
- Spatial distribution and health risk assessment for groundwater contamination from intensive pesticide use in arid areas. Environ. Geochem. Health. 2016;39:231-253.
- [CrossRef] [Google Scholar]
- ElKashouty, M., 2019. Groundwater quality distribution by geostatistical investigation (GIS), Nile Delta, Northern Egypt. J. Environ. Chem. Ecotoxicol. 11, 1-21, DOI:10.5897/JECE2018.0437
- Comparison of DRASTIC and DC resistivity modeling for assessing aquifer vulnerability in the central Nile Delta. Egypt. Environ Earth Sci. 2017;76(9)
- [CrossRef] [Google Scholar]
- Hend Hussien, Amr Abd El-Raouf, Sattam Almadani, Kamal Abdelrahman, Elkhedr Ibrahim and O. M. Osman, 2021: Application of geochemical modeling using NETPATH and water quality index for assessing the groundwater geochemistry in the south Wadi El-Farigh area, Egypt. King Saud J. Science 33 (2), 101284.
- The modern problems of sustainable use and management of irrigated lands on the example of the Bukhara region. Uzbekistan J Water Resour Prot. 2015;07(12):956-971.
- [Google Scholar]
- Impact of anthropogenic activities on the chemistry and quality of groundwater: a case study from a terrain near Zarand City, Kerman Province, SE Iran. Environ. Earth Sci.. 2013;69(7):2451-2467.
- [Google Scholar]
- Co-occurrence of arsenic and fluoride in the groundwater of Punjab, Pakistan: source discrimination and health risk assessment. Environ Sci Pollut Res. 2015;22(24):19729-19746.
- [Google Scholar]
- The geological evolution of the Nile River. New Work: Springer Verlag; 1981. p. :151p.
- Salem, Z.E., 2009 Natural and human impacts on the groundwater under an Egyptian village, Central Nile Delta – a case study of Mehallet Menouf. In: 13th international water technology conference (IWTC, 13), Hurghada, Egypt. 3, pp. 1397-1414.
- Use of major ions to evaluate the hydrogeochemistry of groundwater influenced by reclamation and seawater intrusion, West Nile Delta. Egypt. Environ. Sci. Pollut. Res. Int.. 2017;24(4):3675-3704.
- [CrossRef] [Google Scholar]
- Salem, Z.E., Atwia, M.G., El-Horiny, M.M., 2015. Hydrogeochemical analysis and evaluation of groundwater in the reclaimed small basin of Abu Mina, Egypt. Hydrogeol. J. 23, 1781-1797. doi: 10.1007/s10040-015-1303-9
- Use of 1-D subsurface thermal profiles to characterize the groundwater flow in the Central Nile Delta region. Arab. J. Geosci.. 2020;13:125.
- [CrossRef] [Google Scholar]
- Salem, Z.E., Elsaiedy, G., ElNahrawy, A., 2017a. Assessment of the groundwater quality for drinking and irrigation purposes in the Central Nile Delta Region, Egypt. In: Negm A. (Eds.) Groundwater in the Nile Delta (2019). The Handbook of Environmental Chemistry, vol 73. Springer, Cham
- Salem, Z.E., Elsaiedy, G., ElNahrawy, A., 2017b. Hydrogeochemistry and quality assessment of groundwater under some Central Nile Delta Villages, Egypt. In: Negm A. (Eds.), Groundwater in the Nile Delta (2019). The Handbook of Environmental Chemistry, vol. 73. Springer, Cham
- Salem, Z.E., Fathy, M.S., Helal, A., Afifi, S.Y., Attiah, A.M., 2020. Use of subsurface temperature as a roundwater flow tracer in the environs of Ismailia Canal, Eastern Nile Delta, Egypt. Arab J Geosci 13, 503 https://doi.org/10.1007/s12517-020-05518-0
- Salem, Z.E., Temamy, A.M., Salah, M.K., Kassab, M., 2018. Evaluation of water resources qualities for agriculture irrigation in Abu Madi Area, Northern Middle Nile Delta. In: Negm A.M. (Eds.), Conventional Water Resources and Agriculture in Egypt (2019). The Handbook of Environmental Chemistry, vol. 74. Springer, Cham
- Chemometric quality assessment of surface waters: two case studies. Chem And Engin Ecology. 2004;11:449-469.
- [Google Scholar]
- Saline-Water Resources of Texas. US Geological Survey Water-Supply Paper. 1956;1365:P105.
- [Google Scholar]


