

Translate this page into:
UPLC-ESI/MS analysis of disinfection by-products (perchlorate, bromate, nitrate, nitrite and sulfite) in micro-filtered drinking water obtained from spring, well and tap water (desalinated) sources
⁎Corresponding author. mrkhan@ksu.edu.sa (Mohammad Rizwan Khan)
-
Received: ,
Accepted: ,
This article was originally published by Elsevier and was migrated to Scientific Scholar after the change of Publisher.
Peer review under responsibility of King Saud University.
Abstract
Abstract
Objectives
In the current study, an analytical technique has been optimized for the analysis of disinfection by-products (perchlorate (ClO4−), bromate (BrO3−), nitrate (NO3−), nitrite and sulfite (SO32–) in drinking water obtained from spring, well and tap water (desalinated) sources.
Methods
The ultra-performance liquid chromatography-electrospray ionization mass spectrometry (UPLC-ESI/MS) conditions have been optimized for oxyhalides ClO4− (isotopes, 37ClO4− and 35ClO4−) and BrO3− (isotopes, 81BrO3− and 79BrO3−), and inorganic anions NO3−, NO2− and SO32–. Separation was achieved by BEH C18 column with methanol (75%) and water (24.99%, HCOOH 0.01%) mobile phase at flow rate 0.2 mL/min.
Results
The analysis was carried out in <1 min with excellent coefficient of determination, (R2 > 0.995–0.999), limit of detection (0.016–0.043 µg/L), limit of quantification (0.051–0.104 µg/L) and precision (repeatability, 1.54–2.28% and reproducibility, 3.13–4.08%) in terms of RSD%. The method was successfully applied, and the amounts of 35ClO4− (5.33–22.64 µg/L), 81BrO3− (7.52–16.73 µg/L), NO3− (5.42–12.14 mg/L), NO2− (1.08–4.37 mg/L) and SO32– (6.84–32.45 mg/L) were identified in spring water, whereas well and tap water contained 35ClO4− (4.20–21.33 µg/L), 81BrO3− (8.05–15.13 µg/L), NO3− (1.27–16.11 mg/L), NO2− (0.43–10.77 mg/L) and SO32– (7.14–36.10 mg/L), and 35ClO4− (0.89–7.37 µg/L), 81BrO3− (5.15–14.68 µg/L), NO3− (1.12–6.33 mg/L), NO2− (0.67–3.95 mg/L) and SO32– (5.40–23.26 mg/L), respectively.
Conclusions
The levels of 35ClO4−, 81BrO3−, NO3−, NO2− and SO32– were found beyond the maximum contaminant levels and drinking water equivalent levels regulated by the Environmental Protection Agency, respectively. The outcomes also revealed that comparatively tap water produced lower levels of these contaminants especially in the cities with low population densities. In addition, the geographical site would be helpful to categorize the tap water samples.
Keywords
Disinfection by-products
Drinking water
Regulations
Population densities
UPLC-ESI/MS

1 Introduction
The existence of specific disinfection by-products oxyhalides (perchlorate (ClO4−) and bromate (BrO3−) and inorganic anions (nitrate (NO3−), nitrite (NO2−) and sulfite (SO32–) in drinking water has become an important concern for human health, water industry and regulatory agencies.
ClO4− is assumed to be a persistent pollutant which is generally found in water surroundings (Cao et al., 2019; Constantinou et al., 2019; Van Stempvoort et al., 2019; Lajin and Goessler, 2020). The explosives, fireworks and rocket fuel are main source of ClO4− pollution (Cao et al., 2019). The ClO4− has been known to endocrine disruptor, lower the iodine concentrations in human body which reduce the heart rate including other deadly illnesses (Pleus and Corey, 2018). ClO4− has also been identified in biological samples such as blood, urine and human milk (Pleus and Corey, 2018; Song et al., 2019). The Environmental Protection Agency (EPA) initially issued ClO4− reference dose (RfD), which would recommend 0.007 mg/kg body weight/day and drinking water equivalent level (DWEL) of 0.025 mg/L (EPA, 2018).
BrO3−, a disinfection by-product, can be produced from the ozonation of bromide which is naturally present in water sources (Alsohaimi et al., 2012; Khan et al., 2016; Liu and Croué, 2016; Jahan et al., 2021). BrO3− has also been identified in other matrices for instance foods and non-alcoholic beverage, which are also an important concern (Khan et al., 2014; Constantinou et al., 2019; Aggrawal and Rohrer, 2020). Based on the laboratory experimental animals, the International Agency for Research on Cancer (IARC) has categorized BrO3− in Group 2B of possible human carcinogen to human (Moubarak et al., 2020). BrO3− is presently regulated with a Maximum Contaminant Limits (MCLs) of 0.01 mg/L in drinking water with RfD (0.004 mg/kg/day), DWEL (0.14 mg/L), 0.005 mg/L at 10-4 cancer risk (EPA, 2018).
NO3−, a vital plant supplement, added into the soil with fertilizer by the agriculturalists or leaching into soil by the chemical industries, erosion of natural deposits, leaking from septic tanks and sewage (European Commission Council Directive 91/676/EEC; Ward et al., 2018). Nonetheless, this useful action for plants has initiated to rise its amounts in water sources which causes eutrophication and led to adverse consequences on human beings and bio-diversity (European Commission Council Directive 91/676/EEC). EPA has established the MCL for NO3− of 10 mg/L in drinking water with RfD 1.6 mg/kg/day (EPA, 2018). Long-term exposure of NO3− in infants (<6 months) beyond MCL could become severely sick and, if not cured, may pass away. Symptoms comprise blue-baby syndrome, breath shortness and cancer (European Commission Council Directive 91/676/EEC; Espejo-Herrera et al., 2015).
NO2−, the presence in the environment arises because of the extensive utilization of organic fertilizers that are high in nitrogen-rich compounds (Khan et al., 2013; Miao et al., 2017). As oxidative yields from nitrification and denitrification reaction method, NO2− discharges in the water course (Miao et al., 2017). NO2− is also used in the meat processing companies to prevent from spoilage during their preservation (Leistner, 1985). The ingestion of NO2− can cause many severe diseases for instance hypertension, colorectal cancer and congenital incapacities (Hosseini et al., 2020). EPA has regulated the MCL for NO2− of 1 mg/L in drinking water with RfD 0.16 mg/kg/day (EPA, 2018). IARC has also classified NO2− in Group 2A of probable carcinogens to human (Adegoke et al., 2021).
SO32– play an important role in the surroundings (Khan et al., 2020b; Urupina et al., 2020), existence of SO32– in water environment is highly detrimental to land for essential natural resources and human health (Khan et al., 2020b; Urupina et al., 2020). SO32– led to acid rain after reaction with rainwater, its presence in the water system may reduce the quality of water (Khan et al., 2020b; Urupina et al., 2020). Epidemiological research revealed that the high SO32– consumption may cause various fatal diseases such as cancer of brain and lung, migraine headaches and asthma exacerbation (Silva et al., 2019). The US Food and Drug Administration (FDA) has set the maximum SO32– levels in drinks (≤10 mg/L) and food products (≤10 mg/kg) (Food and Administration, 1986). At the same time, the FDA has advised that the consumption of SO32– is nontoxic to ingest. Nonetheless, its injurious even at little amounts to the people having liver, kidney and asthma illness symptoms (Food and Administration, 1986).
Thus, in view of these particular oxyhalides and inorganic anions, numerous contrary influences concerning environment and human health have arisen and specified great attention relating to their identification in environmental samples. So far, a lot of determination techniques have been described for the analysis of ClO4−, BrO3−, NO3−, NO2− and SO32– in numerous environmental, food and biological samples such as high-performance liquid chromatography-inductively coupled plasma/mass spectrometry (HPLC-ICPMS/MS) (Lajin and Goessler, 2020), liquid chromatography-electrospray ionization-tandem mass spectrometry (LC-ESI-MS/MS) (Constantinou et al., 2019; Song et al., 2019), ultra-performance liquid chromatography (UPLC) coupled with electrospray ionization-mass spectrometry (ESI/MS) or tandem mass spectrometry (MS/MS) (Alsohaimi et al., 2012; Khan et al., 2013, 2014, 2016, 2020a), ion chromatography (IC) (Liu et al., 2002), IC-MS (Aggrawal and Rohrer, 2020), colorimetric method (Adegoke et al., 2021) and biosensing methods (Pundir and Rawal, 2013). These applied methods were found to be sensitive and offered excellent system performance. Nonetheless, the main shortcoming of these methods were; used either for single compound or in combination with two to three compounds in various types of matrices. Therefore, it was highly significant to optimize a single precise, speedy and sensitive technique for the analysis of 37ClO4−, 35ClO4−, 81BrO3−, 79BrO3−, NO3−, NO2− and SO32– in water samples. Taking into consideration, we have optimized a single method based on UPLC-ESI/MS for the analysis of oxyhalides (35ClO4− and 81BrO3−), and inorganic anions (NO3−, NO2− and SO32–) in drinking water obtained from spring, well and tap water sources. The method offered faster analysis, excellent sensitivity and high precision which accomplish the demand of small sample intake and decrease time loss all through the analysis. Present method could also be applied for the analysis of these oxyhalides and inorganic anions in other type of matrices (foods, environmental and biological) which might require precise sample extraction prior to the analysis.
2 Methods and materials
2.1 Reagents and chemicals
Solvents and reagents used were of LC and analytical-reagent, respectively. Stock (ClO4−, BrO3−, NO3− and NO2−) solutions (1000 µg/mL) of TraceCERT® grade were achieved from Merck. SO32–, ACS reagent, ≥98.0% supplied from Sigma-Aldrich (Darmstadt, Germany). Acetonitrile, methanol and formic acid were purchased from Sigma-Aldrich (Darmstadt, Germany). Ultra-pure water (Milli–Q) was used for standard, sampling and mobile phase purposes, achieved from a water purification system of model Advantage (A10) from Millipore Corporation (Bedford, USA).
2.2 Water samples
A total of seventy-five water samples including spring bottled water (11 samples, international brand) and well bottled water (34 samples, national brand) were purchased from the local super markets based in the Saudi Arabia. Tap water (30 samples, desalinated) were achieved from five locations/city, Saudi Arabia (Tables 1 and 2). Samples were filtered by means of polytetrafluoroethylene (Chromafil Xtra, PTFE) syringe filter (0.20 μm) before being injection into the UPLC-ESI/MS system. Solutions were freshly prepared to evade any dreadful conditions of the studied compounds. SW, spring water; BW, bottled water; *sterilized with ozone before packaging; –a,bnot defined; nd = standard deviation (n = 3); UK, United Kingdom; SA, Saudi Arabia
Sample
Source
Origin
Sterilization
35ClO4−, µg/L ± sd
R, %
81BrO3−, µg/L ± sd
R, %
NO3−,mg/L ± sd
R, %
NO2−,mg/L ± sd
R, %
SO32 –,mg/L ± sd
R, %
SW1
Spring
France
–a
15.04 ± 0.01
99
12.20 ± 0.01
98
6.84 ± 0.02
98
3.44 ± 0.03
99
21.85 ± 0.01
99
SW2
Spring
Turkey
–
22.64 ± 0.01
99
8.34 ± 0.02
99
11.04 ± 0.01
99
1.39 ± 0.04
97
8.97 ± 0.02
98
SW3
Spring
Italy
–
16.47 ± 0.01
98
14.13 ± 0.01
99
7.84 ± 0.02
97
2.84 ± 0.03
99
12.73 ± 0.01
99
SW4
Spring
Fiji
–
18.03 ± 0.01
99
11.37 ± 0.01
98
4.62 ± 0.03
98
2.40 ± 0.03
98
32.45 ± 0.01
98
SW5
Spring
UK
–
6.88 ± 0.02
96
9.22 ± 0.02
98
9.22 ± 0.02
99
1.36 ± 0.04
98
6.92 ± 0.02
98
SW6
Spring
France
–
9.22 ± 0.01
97
11.84 ± 0.01
97
3.81 ± 0.03
99
2.54 ± 0.03
99
13.52 ± 0.01
99
SW7
Spring
Denmark
–
8.62 ± 0.01
99
14.20 ± 0.01
99
12.14 ± 0.01
99
5.30 ± 0.03
97
22.36 ± 0.01
98
SW8
Spring
Lebanon
–
5.33 ± 0.02
97
9.98 ± 0.02
97
8.22 ± 0.02
97
2.74 ± 0.03
99
6.84 ± 0.02
97
SW9
Spring
Norway
–
11.86 ± 0.01
99
13.21 ± 0.01
98
3.62 ± 0.03
97
1.08 ± 0.04
99
18.22 ± 0.01
99
SW10
Spring
France
–
9.94 ± 0.01
99
16.43 ± 0.01
99
9.31 ± 0.02
99
1.98 ± 0.04
99
11.87 ± 0.01
97
SW11
Spring
Finland
–
32.74 ± 0.01
99
7.52 ± 0.02
99
5.42 ± 0.03
99
4.37 ± 0.03
98
16.20 ± 0.01
99
WW*1
Well
SA
–
18.06 ± 0.01
99
12.44 ± 0.01
97
12.36 ± 0.01
99
8.83 ± 0.02
99
18.67 ± 0.01
99
WW2
–b
SA
Ozonation
14.32 ± 0.01
99
9.03 ± 0.02
99
8.94 ± 0.02
97
3.42 ± 0.03
96
9.80 ± 0.02
99
WW3
Well
SA
–
5.38 ± 0.02
99
11.78 ± 0.01
98
6.66 ± 0.03
98
2.76 ± 0.03
96
12.66 ± 0.01
99
WW4
–
SA
Ozonation
6.98 ± 0.02
96
8.47 ± 0.02
98
10.20 ± 0.02
99
5.20 ± 0.03
99
24.38 ± 0.01
99
WW5
Well
SA
Ozonation
7.54 ± 0.02
97
14.66 ± 0.01
99
8.97 ± 0.02
96
10.77 ± 0.02
99
16.23 ± 0.01
98
WW6
Well
SA
Ozonation
5.10 ± 0.03
96
12.87 ± 0.01
99
7.55 ± 0.02
96
0.88 ± 0.05
96
6.28 ± 0.03
98
WW7
Well
SA
–
12.86 ± 0.01
98
10.22 ± 0.01
98
10.74 ± 0.01
98
2.31 ± 0.03
97
9.45 ± 0.02
97
WW8
–
SA
Ozonation
6.15 ± 0.03
98
9.90 ± 0.02
97
16.11 ± 0.01
98
4.62 ± 0.03
98
20.66 ± 0.01
99
WW9
Well
SA
Ozonation
11.04 ± 0.01
99
14.82 ± 0.01
97
9.76 ± 0.01
96
0.96 ± 0.05
96
8.72 ± 0.02
99
WW10
Well
SA
Ozonation
4.20 ± 0.03
99
8.99 ± 0.02
96
10.82 ± 0.01
98
0.55 ± 0.05
96
9.50 ± 0.02
99
WW11
Well
SA
Ozonation
12.16 ± 0.01
99
9.54 ± 0.01
97
6.18 ± 0.03
99
3.82 ± 0.03
98
12.36 ± 0.01
99
WW12
Well
SA
–
10.97 ± 0.01
97
12.22 ± 0.01
99
1.67 ± 0.04
96
2.44 ± 0.03
96
16.74 ± 0.01
99
WW13
Well
SA
Ozonation
13.54 ± 0.01
96
15.88 ± 0.01
98
11.34 ± 0.02
99
10.22 ± 0.01
99
7.26 ± 0.03
97
WW14
Well
SA
Ozonation
18.32 ± 0.01
98
11.65 ± 0.01
98
8.99 ± 0.02
96
0.68 ± 0.05
96
9.96 ± 0.02
98
WW15
Well
SA
Ozonation
12.02 ± 0.01
99
10.92 ± 0.01
97
1.65 ± 0.04
97
3.11 ± 0.03
97
22.64 ± 0.01
99
WW16
–
SA
Ozonation
10.42 ± 0.01
97
9.73 ± 0.01
96
3.87 ± 0.03
96
2.36 ± 0.03
96
8.72 ± 0.02
96
WW17
–
SA
Ozonation
17.75 ± 0.01
97
13.67 ± 0.01
99
7.30 ± 0.03
98
0.74 ± 0.04
96
16.36 ± 0.01
99
WW18
Well
SA
Ozonation
13.89 ± 0.01
98
10.84 ± 0.01
98
10.66 ± 0.02
98
4.15 ± 0.03
99
23.44 ± 0.01
99
WW19
Well
SA
–
11.61 ± 0.01
98
11.42 ± 0.01
98
2.10 ± 0.03
96
0.84 ± 0.04
96
36.10 ± 0.01
99
WW20
Well
SA
–
19.77 ± 0.01
97
17.91 ± 0.01
99
6.87 ± 0.03
99
0.63 ± 0.04
96
23.68 ± 0.01
99
WW21
Well
SA
Ozonation
9.10 ± 0.01
99
10.08 ± 0.02
97
12.84 ± 0.01
98
3.56 ± 0.03
98
33.71 ± 0.01
99
WW22
Well
SA
Ozonation
12.05 ± 0.01
96
8.91 ± 0.02
98
1.27 ± 0.04
98
5.88 ± 0.03
99
12.88 ± 0.01
99
WW23
Well
SA
Ozonation
8.68 ± 0.02
99
12.34 ± 0.01
96
9.54 ± 0.01
99
3.30 ± 0.03
98
18.23 ± 0.01
98
WW24
Well
SA
Ozonation
13.06 ± 0.01
99
14.55 ± 0.01
98
5.41 ± 0.03
97
2.71 ± 0.03
99
7.14 ± 0.03
96
WW25
Well
SA
Ozonation
10.67 ± 0.01
96
10.07 ± 0.02
99
10.34 ± 0.02
99
0.62 ± 0.05
97
13.22 ± 0.01
99
WW26
Well
SA
Ozonation
16.02 ± 0.01
98
8.05 ± 0.02
96
8.82 ± 0.02
99
9.98 ± 0.01
99
8.76 ± 0.02
97
WW27
Well
SA
Ozonation
7.73 ± 0.02
97
14.22 ± 0.01
99
7.26 ± 0.02
98
3.25 ± 0.03
97
16.98 ± 0.01
99
WW28
Well
SA
Ozonation
10.09 ± 0.01
96
9.82 ± 0.02
98
13.97 ± 0.01
99
0.87 ± 0.04
96
11.76 ± 0.01
98
WW29
Well
SA
–
8.35 ± 0.02
99
13.02 ± 0.01
97
1.38 ± 0.05
96
4.22 ± 0.03
99
6.23 ± 0.03
96
WW30
Well
SA
Ozonation
12.44 ± 0.01
99
13.87 ± 0.01
99
2.46 ± 0.03
96
0.43 ± 0.06
96
8.82 ± 0.02
97
WW31
Well
SA
–
9.28 ± 0.01
99
8.64 ± 0.03
97
10.82 ± 0.02
99
3.22 ± 0.03
99
13.54 ± 0.01
98
WW32
Well
SA
Ozonation
8.49 ± 0.02
98
15.13 ± 0.01
99
7.36 ± 0.02
98
0.74 ± 0.04
96
10.67 ± 0.02
97
WW33
–
SA
Ozonation
15.66 ± 0.01
96
12.41 ± 0.02
98
2.99 ± 0.03
98
0.53 ± 0.05
96
8.44 ± 0.02
98
WW34
Well
SA
Ozonation
21.33 ± 0.01
98
9.43 ± 0.03
99
6.82 ± 0.02
99
4.91 ± 0.03
99
14.36 ± 0.01
99
Tap watera,b
35ClO4−, µg/L ± sd
R, %
81BrO3−, µg/L ± sd
R, %
NO3−,mg/L ± sd
R, %
NO2−,mg/L ± sd
R, %
SO32 –,mg/L ± sd
R, %
TWR1
2.46 ± 0.02
96
7.54 ± 0.01
96
3.68 ± 0.02
97
2.25 ± 0.02
97
12.86 ± 0.02
99
TWR2
7.37 ± 0.02
95
6.78 ± 0.02
98
1.33 ± 0.02
95
1.74 ± 0.01
96
9.98 ± 0.00
98
TWR3
0.98 ± 0.03
94
9.65 ± 0.02
97
2.86 ± 0.02
96
1.68 ± 0.02
96
23.54 ± 0.03
99
TWR4
1.22 ± 0.03
96
12.36 ± 0.02
98
5.44 ± 0.02
98
2.39 ± 0.02
97
8.70 ± 0.02
97
TWR5
4.51 ± 0.02
97
10.68 ± 0.01
97
1.77 ± 0.02
96
3.23 ± 0.02
97
11.31 ± 0.01
99
TWJ1
3.77 ± 0.02
96
15.68 ± 0.03
98
1.82 ± 0.03
96
3.97 ± 0.02
98
14.16 ± 0.02
99
TWJ2
6.62 ± 0.02
97
9.23 ± 0.02
97
6.33 ± 0.02
98
2.46 ± 0.02
97
15.76 ± 0.02
99
TWJ3
2.06 ± 0.02
96
12.89 ± 0.03
98
4.93 ± 0.03
98
1.77 ± 0.01
96
8.35 ± 0.02
98
TWJ4
3.93 ± 0.02
96
8.26 ± 0.02
97
1.24 ± 0.02
96
0.95 ± 0.03
96
5.40 ± 0.02
97
TWJ5
1.93 ± 0.03
96
5.82 ± 0.03
96
3.62 ± 0.02
97
1.29 ± 0.02
96
13.33 ± 0.02
99
TWD1
5.38 ± 0.02
97
6.99 ± 0.02
95
1.12 ± 0.03
95
1.32 ± 0.03
96
6.68 ± 0.02
98
TWD2
3.67 ± 0.02
96
14.14 ± 0.02
98
5.40 ± 0.02
97
0.76 ± 0.02
96
23.26 ± 0.01
99
TWD3
3.89 ± 0.02
96
10.87 ± 0.02
97
1.69 ± 0.03
96
3.35 ± 0.03
97
16.20 ± 0.01
99
TWD4
1.92 ± 0.03
96
5.15 ± 0.02
96
1.42 ± 0.03
95
2.88 ± 0.03
97
7.34 ± 0.02
98
TWD5
3.29 ± 0.02
97
11.29 ± 0.02
98
4.87 ± 0.02
98
1.55 ± 0.02
96
13.66 ± 0.01
99
TWQ1
1.91 ± 0.03
96
5.65 ± 0.02
96
3.33 ± 0.03
97
0.68 ± 0.04
96
6.84 ± 0.02
99
TWQ2
0.89 ± 0.04
97
13.40 ± 0.01
99
4.1 ± 0.03
98
1.65 ± 0.03
96
14.22 ± 0.01
97
TWQ3
4.93 ± 0.02
98
8.68 ± 0.02
97
1.63 ± 0.03
96
2.12 ± 0.03
97
20.31 ± 0.01
99
TWQ4
1.77 ± 0.03
97
10.89 ± 0.01
97
5.41 ± 0.02
98
0.83 ± 0.04
96
5.56 ± 0.02
96
TWQ5
2.54 ± 0.03
96
7.63 ± 0.02
96
3.67 ± 0.03
97
1.74 ± 0.03
96
16.64 ± 0.01
97
TWA1
1.74 ± 0.03
95
9.13 ± 0.01
98
3.91 ± 0.03
98
1.16 ± 0.04
96
9.39 ± 0.02
97
TWA2
2.04 ± 0.03
97
7.88 ± 0.02
97
3.35 ± 0.03
97
0.96 ± 0.04
96
10.82 ± 0.01
97
TWA3
2.68 ± 0.01
97
8.25 ± 0.02
97
3.22 ± 0.03
97
1.15 ± 0.04
96
8.90 ± 0.02
96
TWA4
3.04 ± 0.03
97
9.72 ± 0.02
98
2.95 ± 0.03
96
0.88 ± 0.04
96
11.22 ± 0.01
99
TWA5
1.99 ± 0.03
95
8.22 ± 0.02
98
3.88 ± 0.03
97
1.05 ± 0.04
96
9.62 ± 0.02
99
TWN1
2.63 ± 0.03
96
5.77 ± 0.02
96
4.26 ± 0.03
98
2.24 ± 0.03
97
9.72 ± 0.01
99
TWN2
1.45 ± 0.04
96
6.29 ± 0.02
95
3.84 ± 0.03
97
1.95 ± 0.03
97
11.87 ± 0.01
99
TWN3
1.75 ± 0.03
96
7.11 ± 0.01
96
4.03 ± 0.03
98
1.85 ± 0.03
96
9.53 ± 0.01
99
TWN4
2.90 ± 0.03
95
5.91 ± 0.02
95
4.67 ± 0.03
98
2.05 ± 0.03
97
10.17 ± 0.01
99
TWN5
1.44 ± 0.04
96
6.95 ± 0.02
96
3.79 ± 0.03
97
2.15 ± 0.03
97
10.69 ± 0.01
99
2.3 Analysis of water samples
For the purpose of system calibration curve and standard addition procedures, the individual stock solution was diluted and mixed all together at needed concentrations. The calibration solutions were prepared ranging from 5 to 100 µg/L (ClO4−), 5–50000 µg/L (BrO3−, NO3−, NO2− and SO32–). The standard addition solutions were prepared at concentrations comprising two non-spiked and three spiked levels. Solutions including water samples were filtered using polytetrafluoroethylene (Chromafil Xtra, PTFE) syringe filter (0.20 μm) (Macherey-Nagel GmbH, Duren, Germany). To evade any microbial contamination in solutions and water samples, they were refrigerated until UPLC-ESI/MS analysis. Ultra-pure water (Milli–Q) was screened out for the presence of oxyhalides and inorganic ions, found free from these compounds. Subsequently, the Milli–Q water was used for the preparation of standards and mobile phase.
To assess the efficacy of the optimized UPLC-ESI/MS technique and matrix influence on 35ClO4−, 81BrO3−, NO3−, NO2− and SO32– retention time, peaks symmetry and their intensities, determination was performed by standard addition quantification method which contain two non-spiked samples at zero levels and spiked samples at three levels (50%, 200% and 600%). The levels demonstrating that the amounts of 37ClO4−, 35ClO4−, 81BrO3−, 79BrO3−, NO3−, NO2− and SO32– increase after spiking in the studied samples. All samples were analyzed in triplicates (n = 3), three individual analyses of each sample. Estimation procedures were carried out using a statistical models based on analysis of variance (ANOVA). The recovery of the studied compounds was calculated from the slope achieved between the spiked and found concentrations of the 35ClO4−, 81BrO3−, NO3−, NO2− and SO32– in analyzed samples.
2.4 UPLC
For the efficient separation of 35ClO4−, 81BrO3−, NO3−, NO2− and SO32– in drinking water, we used an ultra-performance liquid chromatography (UPLC) from Waters (Milford, USA). All compounds were separated using an analytical column based on BEH C18 with dimension 50 mm × 2.1 mm i.d. and particle size of 1.7 µm (Waters, Milford, USA). To save the column during sample analysis, a pre-column based on VanGuard™ BEH C18 with particle size 1.7 µm was used. The best chromatographic parameters for the determination of 35ClO4−, 81BrO3−, NO3−, NO2− and SO32– in water samples was attained by isocratic mobile phase elution mode, comprising methanol (75%) and MilliQ water (24.99%, HCOOH 0.01%) mobile phase at a flow speed of 0.2 mL/min. The column temperature was maintained at 25 °C during the sample analysis. The sample was injected with a volume of 5 µL.
2.5 ESI/MS
The proficient identification of 35ClO4−, 81BrO3−, NO3−, NO2− and SO32– in drinking water, a triple quadrupole mass spectrometer (Quattro Premier™, Micromass, Milford, USA) comprising an electrospray ionization source (ESI, Z–spray) attached with UPLC system. The apparatus was functioned in negative electrospray ionization mode. To choose the utmost abundant ions from individual compounds, data acquisition was carried out in full scan mode with mass-to-charge ratio values (m/z, 0–150). The selected ion recording (SIR) scanning mode was used to record the ions having greater intensities. Features affecting the target compounds ion transmission were optimized through infusing a ClO4−, BrO3−, NO3−, NO2− and SO32– standard mixture solution at concentration 5 µg/mL. Optimized ESI/MS operational conditions were monitors for instance capillary voltage (3.5 kV), desolvation temperature (350 °C), source temperature (120 °C), cone gas flow speed (60 L/h), desolvation gas flow speed (600 L/h), and cone voltage (V): 37ClO4− (50 V, m/z 101.14), 35ClO4− (46 V, m/z 99.13), 81BrO3− (36 V, m/z 129.06), 79BrO3− (50 V, m/z 127.09), NO3− (42 V, m/z 62.17), NO2− (72 V, m/z 46.25) and SO32– (60 V, m/z 80.09). For cone gas, nitrogen of high purity was obtained from nitrogen generator of NM30LA model (Peak Scientific Inchinann, United Kingdom). For collision gas, argon of high purity was obtained from Speciality Gas Centre (Jeddah, Saudi Arabia). The mass spectrometer primary vacuum was produced from Oerlikon rotary vacuum pump of SOGEVAC SV40 BI model (Paris, France). The instrument handling and data acquisition were carried out by means of MassLynx V4.1 software (Waters, Milford, USA). The MS SIR parameters have been presented in Table 3.
Compoundsb
Mass (m/z)
Ionization mode
Cone voltage (V)
Dwell time (s)
37ClO4−
101.14
ES-
50
0.025
35ClO4−
99.13
ES-
46
0.025
81BrO3−
129.06
ES-
36
0.025
79BrO3−
127.09
ES-
50
0.025
NO3−
62.17
ES-
42
0.025
NO2−
46.25
ES-
72
0.025
SO32 −
80.09
ES-
60
0.025
2.6 Method validation
The performance of the optimized UPLC-ESI/MS method was evaluated in terms of linearity, limits of detection (LOD, signal-to-noise ratio of 3), limits of quantification (LOQ, signal-to-noise ratio of 10), and precision (run–to–run, five replicate analysis of a standard mixture solution in the same day) and (day–to–day, five replicate analysis of the same standard mixture solution over three successive days.
3 Results and discussion
3.1 Method optimization (UPLC-ESI/MS)
The studied disinfection by-products oxyhalides (35ClO4− and 81BrO3−) and inorganic anions (NO3−, NO2− and SO32–) in drinking water were fully resolved by the UPLC-ESI/MS method, the chromatograms with high peak symmetry has been demonstrated in Fig. 1. The ESI mass spectra were primarily studied via infusing solution mixture of ClO4−, BrO3−, NO3−, NO2− and SO32– standards at concentration of 5 µg/mL. The mass spectra achieved during ESI/MS optimization has been shown in Fig. 2. The mass spectra of these oxyhalides and inorganic ions are illustrating high intensities with higher ion counts. The ClO4− and BrO3− have resulted two isotopes, 37ClO4− (m/z, 101.14) and 35ClO4− (m/z, 99.13), and 81BrO3− (m/z, 129.06) and 79BrO3− (m/z, 127.09). The oxyhalides demonstrate the identical mass transitions. The NO3−, NO2− and SO32– have resulted single ion with higher intensities and ion counts i.e. NO3− (m/z, 62.17), NO2− (m/z, 46.25) and SO32– (m/z, 80.09) (Fig. 2). The oxyhalides isotopic transitions 37ClO4− and 81BrO3−, and individual inorganic anions transitions used for quantification purposes. Current result specified that in the negative ESI method, the studied compounds could form the lesser mass ions by deprotonation (removal of a proton, H+) (Gioumouxouzis et al., 2015). The selected on recording (SIR) conditions acquired with the ESI/MS system has been illustrated in Table 3. The NO3−, NO2− and SO32– ion transitions do not display an uninterrupted interference with ClO4− and BrO3− ion transitions. Nevertheless, in most of the commercial or municipal drinking waters, NO3−, NO2− and SO32– existing at amounts much greater than those of the studied ClO4− and BrO3− ions (Alsohaimi et al., 2012; Khan et al., 2013, 2014, 2016, 2020a, 2020b). To authenticate the occurrence and influence of NO3−, NO2− and SO32– on ClO4− and BrO3− ion transitions, the ion transitions of NO3−, NO2− and SO32– were tested by means of individual standards and subsequently examined along with the ClO4− and BrO3− ion transitions, and found no ions interference that could effect on the performance of the method. Based on these outcomes, the water samples were directly analyzed after micro filtration, found no matrix interferences and offered more consistent quantification of the targeted compounds (Alsohaimi et al., 2012; Khan et al., 2013, 2016, 2020b).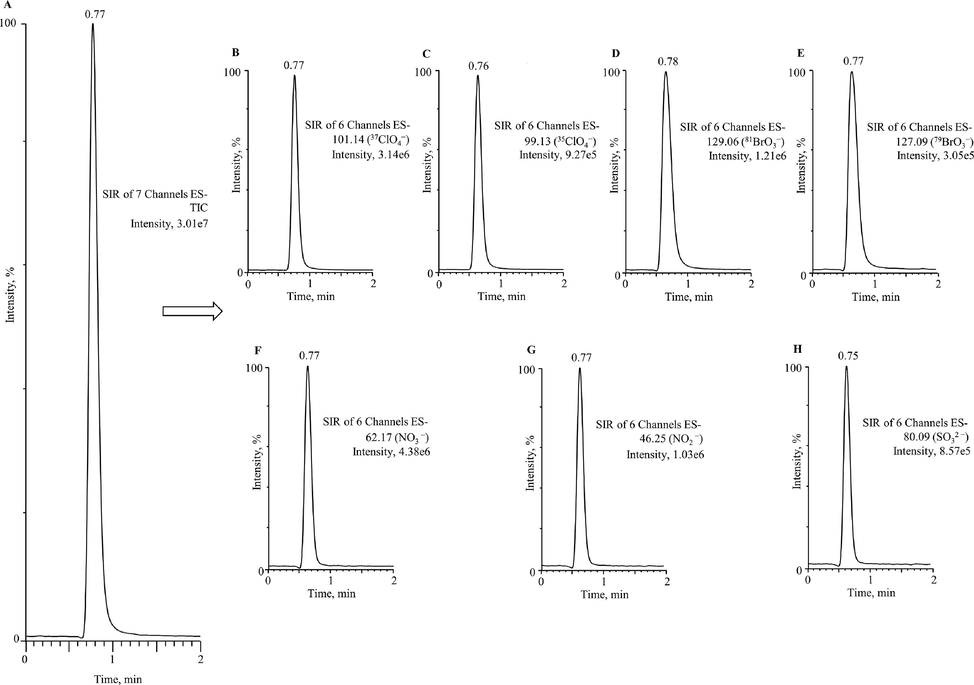
Optimized UPLC-ESI/MS chromatograms of oxyhalides isotopes 37ClO4− (m/z, 101.14) and 35ClO4− (m/z, 99.13), and 81BrO3− (m/z, 129.06) and 79BrO3− (m/z, 127.09), and inorganic anions NO3− (m/z, 62.17), NO2− (m/z, 46.25) and SO32– (m/z, 80.09) (1 µg/mL).
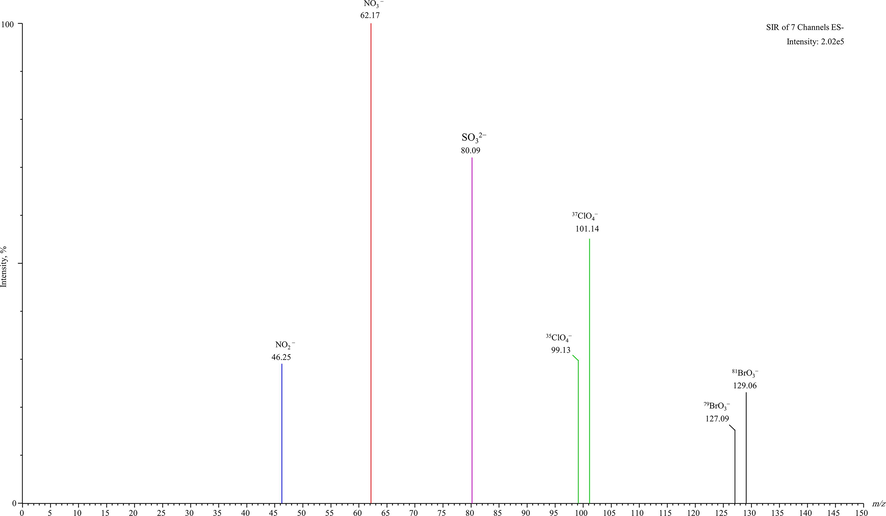
Mass spectra (ion signal as a function of mass-to-charge ratio) of 37ClO4− (m/z, 101.14) and 35ClO4− (m/z, 99.13), and 81BrO3− (m/z, 129.06) and 79BrO3− (m/z, 127.09), and NO3− (m/z, 62.17), NO2− (m/z, 46.25) and SO32– (m/z, 80.09) in some of the analyzed water sample.
The best separation behavior of ClO4−, BrO3−, NO3−, NO2− and SO32– was achieved using UPLC. Primarily, various analytical columns based on hydrophilic interaction liquid chromatography (HILIC) and UPLC™ Ethylene Bridged Hybrid (BEH) C8 and C18 columns of 1.7 µm particle were studied. The columns characteristically offer great retention of oxyhalides and inorganic ions (Khan et al., 2016, 2020b). Individual columns were optimized by means of a standard mixture solution (1 µL/mL) of ClO4−, BrO3−, NO3−, NO2− and SO32– at different mobile phase flow speed ranged from 100 to 500 µL/min. Mobile phases for instance acetonitrile, methanol and water were optimized either separately or in diverse proportions in isocratic elution mode. The sample injection volume was fixed (5 µL) in all cases. Nevertheless, it did not effect on analysis as reported in the previous studies (Khan et al., 2016, 2020a, 2020b). The aim was to achieve the excellent symmetric peaks of the analyzed compounds by applying these conditions. Initially, the columns were studied using separate mobile phase at various flow rates, the outcomes show the weaker retention characteristics and formed asymmetrical peaks with complex base peak noise and the elution time of the targeted compounds. To maintain the symmetrical peak shape, the organic modifier (formic acid) was also added in the separate mobile phase nonetheless the symmetry of the respective peaks was enhanced, but formed peaks with diminutive complex base noise and the elution time. Subsequently, the columns were investigated by means of numerous mobile phase proportions comprising HCOOH as organic modifier at certain levels. The column BEH C18 and isocratic binary mobile phase methanol (75%) and water (24.99%, HCOOH 0.01%) at a flow rate 0.2 mL/min offered high intense peaks with tremendous symmetry of the studied compounds. The column dead volume was studied and found to be 0.48 min, and the ClO4−, BrO3−, NO3−, NO2− and SO32– eluted between 0.75 min and 0.78 min, depending on the types of compounds (Fig. 1). The higher mobile phase flow speed may offer the elution of targeted compounds at lower retention time, but the response of the peak intensity may have decreased owing to the presence of additional ions arise from applied mobile phases into the ESI/MS (Khan et al., 2020a), consequently low ionization of the targeted compounds occur and led to lower the intensities of the compounds (Khan et al., 2020a). So, the BEH C18 column and mobile phase methanol (75%) and water (24.99%, HCOOH 0.01%) at a flow rate 0.2 mL/min were preferred for the quantitative identification of ClO4−, BrO3−, NO3−, NO2− and SO32– in bottled and tap water samples. To avoid any sample carryover, initially the Milli-Q water was analyzed and found free from ClO4−, BrO3−, NO3−, NO2− and SO32–. Subsequently, the Milli-Q water was injected after each analyzed samples and found no any unwanted compounds or sample matrices remain present throughout the analysis. To our knowledge, the current optimized UPLC-ESI/MS method is as one of the highly sensitive and rapid method, which offered analysis times lower than one minute without need of sample pretreatment and column preconditioning during the analysis.
3.2 Performance of the method
The method validation in terms of coefficient of determination (R2), limits of detection (LOD), limits of detection (LOQ) and precision was evaluated. The R2 was measured at concentrations ranged from 5 to 100 µg/L (ClO4−) and 5 to 50000 µg/L (BrO3−, NO3−, NO2− and SO32–), and R2 values found > 0.995–0.999 depending upon the type of compounds. The LOD and LOQ were established at signal-to-noise ratio of 3 and 10, respectively. The LOD (0.016–0.043 µg/L) and LOQ (0.051–0.104 µg/L) were achieved. The precision repeatability was assessed from five replicate analysis of a standard mixture solution of ClO4−, BrO3−, NO3−, NO2− and SO32– at 0.03 µg/mL in the similar day, and reproducibility was determined from five replicate analysis of the identical standard mixture solution over three successive days. The precision repeatability (1.54–2.28%) and reproducibility (3.13–4.08%) in terms of RSD% were achieved. The obtained R2, LOD, LOQ, repeatability and reproducibility values of the optimized UPLC-ESI/MS method have been presented in Table 4. The system has offered the excellent quality parameters, hence the UPLC-ESI/MS method could be proposed for the reliable analysis of oxyhalides and inorganic ions in drinking water. LOD, limit of detection (S/N, 3:1); LOQ, limit of quantification (S/N, 10:1); RSD, relative standard deviation; sd, standard deviation, acquired from three replicates
Compounds
Linear range (µg/L)
Coefficient of determination, (R2)
LOD (µg/L) ± sd
LOQ (µg/L) ± sd
Repeatability RSD (%)
Reproducibility RSD (%)
37ClO4−
5–100
0.999
0.021 ± 0.002
0.064 ± 0.002
1.97
3.95
35ClO4−
5–100
0.996
0.016 ± 0.002
0.051 ± 0.002
1.82
3.63
81BrO3−
5–50000
0.999
0.029 ± 0.002
0.090 ± 0.001
1.68
3.54
79BrO3−
5–50000
0.995
0.043 ± 0.001
0.136 ± 0.001
1.82
3.92
NO3−
5–50000
0.999
0.021 ± 0.002
0.067 ± 0.002
1.54
3.13
NO2−
5–50000
0.999
0.033 ± 0.001
0.104 ± 0.001
1.83
3.64
SO32 −
5–50000
0.998
0.020 ± 0.002
0.064 ± 0.002
2.68
3.38
3.3 Application of the real samples
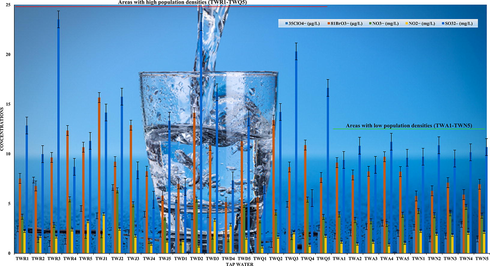
The optimized method (UPLC–ESI/MS) was practically applied for the analysis of ClO4−, BrO3−, NO3−, NO2− and SO32– in drinking water obtained from spring, well and tap water sources. A total of seventy-five samples were analyzed, the outcomes (amounts and recovery) have been presented in Table 1 and 2. It is noticeable that all samples contain both oxyhalides and inorganic ions at higher concentrations. In spring water, the amounts of ClO4− (5.33–22.64 µg/L), BrO3− (7.52–16.73 µg/L), NO3− (5.42–12.14 mg/L), NO2− (1.08–4.37 mg/L) and SO32– (6.84–32.45 mg/L) were found, whereas well and tap water contained ClO4− (4.20–21.33 µg/L), BrO3− (8.05–15.13 µg/L), NO3− (1.27–16.11 mg/L), NO2− (0.43–10.77 mg/L) and SO32– (7.14–36.10 mg/L), and ClO4− (0.89–7.37 µg/L), BrO3− (5.15–14.68 µg/L), NO3− (1.12–6.33 mg/L), NO2− (0.67–3.95 mg/L) and SO32– (5.40–23.26 mg/L), respectively. The recovery values of the study compounds were found between 96% and 99% in spring and well water samples, however, the tap water produced 94% and 99%. The reason might be due to tap water contained higher amounts of salt and other matrices than spring and well water. The high recovery values specify that compounds loss in the filtration phase and ion suppression in the MS source (ESI) were negligible. In Fig. 3, the UPLC–ESI/MS chromatograms of ClO4−, BrO3−, NO3−, NO2− and SO32– in spring water sample (SW1) have been presented. The method offered chromatographic peaks with excellent symmetry and no other interfering compounds eluting at the same retention time of the targeted compounds. The investigation about the occurrence of ClO4−, BrO3−, NO3−, NO2− and SO32– in drinking water are essentially unexplored, many earlier studies reported either single or few of them were determined in drinking water (Liu et al., 2002; Alsohaimi et al., 2012; Khan et al., 2016, 2020a, 2020b; Liu and Croué, 2016; Djam et al., 2020). The oxyhalides for instance chlorite, chlorate and BrO3− were measured by IC in 168 bottled water (mineral and drinking water) samples commercialized in Iran, and the obtained amounts ranged from 37.04 and 33.58 μg/L (Djam et al., 2020). Liu et al., have analyzed Beijing’s drinking water for the determination of trace level BrO3− and ClO4− by IC with an evaporative preconcentration method, and achieved 0.58 μg/L and 0.79 μg/L, respectively (Liu et al., 2002). Khan et al., have also determined either single or in combination of three ions in drinking water and non-alcoholic beer by UPLC-MS method (Alsohaimi et al., 2012; Khan et al., 2013, 2014, 2016, 2020a, 2020b). The amounts of these ions in various matrices were found in good agreement with those achieved in the current study. Nonetheless, the increasing demand of uncontaminated drinking water either in the form of tap, spring or bottled water, and guidelines established by various national and international regulatory agencies (Food and Administration, 1986; EPA, 2018), it was highly essential to optimized a reliable method (UPLC-ESI/MS) that could analyze such type of compounds in drinking water. In this study, the amounts of ClO4−, BrO3−, NO3−, NO2− and SO32– were found beyond the MCL and DWEL regulated by the EPA (EPA, 2018) and FDA (Food and Administration, 1986), respectively. The outcomes also revealed that the tap water produced lower levels of these contaminants especially in cities with low population densities (Fig. 4). The ClO4−, BrO3−, NO3−, NO2− and SO32– were remain present in Saudi Arabian drinking water. Therefore, the identifying and reducing the level of these compounds in water samples are highly required additional fears to meet better essentials of policies for end users.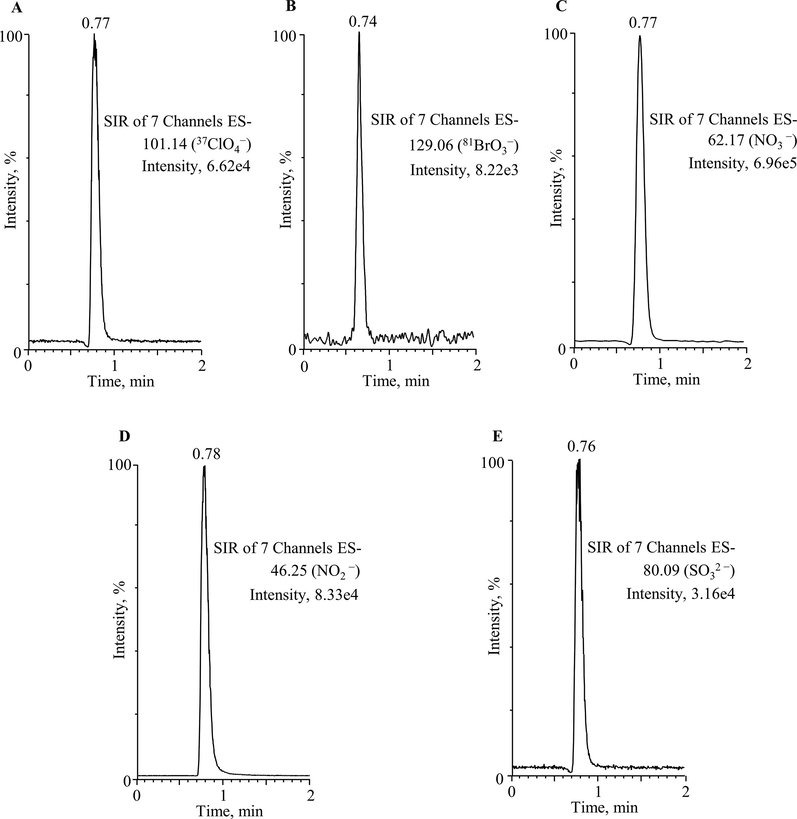
UPLC-ESI/MS chromatograms of 37ClO4− (m/z, 101.14), 81BrO3− (m/z, 129.06), NO3− (m/z, 62.17), NO2− (m/z, 46.25) and SO32– (m/z, 80.09) obtained in spring water sample (SW1).
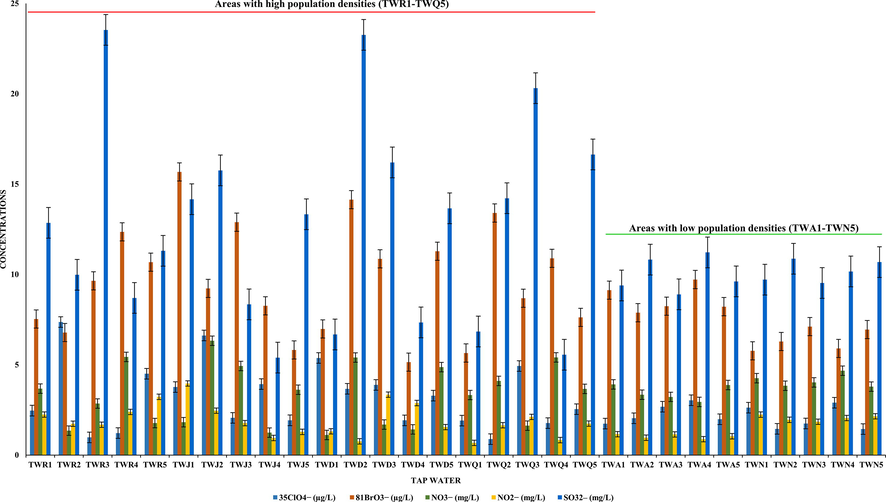
Variation of oxyhalides and inorganic anions concentrations vs population density.
4 Conclusions
This study establishes a new method based on UPLC–ESI/MS for the determination of disinfection by-products 35ClO4−, 81BrO3−, NO3−, NO2− and SO32– in spring, bottled and tap water. Under optimized UPLC–ESI/MS conditions, compounds were eluted within 1 min with high coefficient of determination (R2 > 0.995–0.999), sensitivity (0.016–0.043 µg/L); high precision (<5%) and recovery values (>94%). In addition, the method has also offered excellent chromatographic peaks with high symmetry which is an advantageous for testing the drinking water. Moreover, the benefit of applying mass spectrometric analysis coupled with triple quadruple mass analyzer is the attainment of target examination in SIR monitoring mode that offers a consistent confirmation of the compounds throughout the analysis. The analysis of 35ClO4−, 81BrO3−, NO3−, NO2− and SO32– in seventy-five bottled spring, bottled and tap water samples displayed that the concentrations of these compounds were found beyond recommended levels in many cases. The outcomes also revealed that comparatively tap water produced lower levels of these contaminants especially in cities with low population densities. In addition, the geographical sampling site would be helpful to categorize the tap water samples. The outcomes also specify that the drinking water comprises these compounds above recommendation limits can cause a severe human health issues. In order to avoid excessive human exposure, it is advisable that end users should be conscious of drinking water which contains high amounts of these compounds.
Acknowledgements
The authors would like to extend their sincere appreciation to the Deanship of Scientific Research at King Saud University, Riyadh, Saudi Arabia for funding this work through the Research Group No. RG-1437-004.
Declaration of Competing Interest
The authors declare that they have no known competing financial interests or personal relationships that could have appeared to influence the work reported in this paper.
References
- Rapid and highly selective colorimetric detection of nitrite based on the catalytic-enhanced reaction of mimetic Au nanoparticle-CeO2 nanoparticle-graphene oxide hybrid nanozyme. Talanta. 2021;224:121875.
- [CrossRef] [Google Scholar]
- Selective and sensitive determination of bromate in bread by ion chromatography-mass spectrometry. J. Chromatogr. A. 2020;1615:460765.
- [CrossRef] [Google Scholar]
- Determination of bromate in drinking water by ultraperformance liquid chromatography–tandem mass spectrometry. J. Sep. Sci.. 2012;35(19):2538-2543.
- [Google Scholar]
- Worldwide occurrence and origin of perchlorate ion in waters: a review. Sci. Total Environ.. 2019;661:737-749.
- [Google Scholar]
- LC-ESI-MS/MS determination of oxyhalides (chlorate, perchlorate and bromate) in food and water samples, and chlorate on household water treatment devices along with perchlorate in plants. Chemosphere. 2019;235:757-766.
- [Google Scholar]
- Bottled water safety evaluations in IRAN: determination of bromide and oxyhalides (chlorite, chlorate, bromate) by ion chromatography. J. Environ. Health Sci. Eng.. 2020;18(2):609-616.
- [Google Scholar]
- EPA, U., 2018. Edition of the drinking water standards and health advisories Tables. EPA 822-F-18-001. Washington, DC: United States Environmental Protection.
- Nitrate in drinking water and bladder cancer risk in Spain. Environ. Res.. 2015;137:299-307.
- [Google Scholar]
- Negative electrospray ionization mode in mass spectrometry: a new perspective via modeling. J. Chromatogr. B. 2015;998-999:97-105.
- [Google Scholar]
- Nitrate-nitrite exposure through drinking water and diet and risk of colorectal cancer: a systematic review and meta-analysis of observational studies. Clin. Nutr. 2020
- [CrossRef] [Google Scholar]
- Fate and reduction of bromate formed in advanced water treatment ozonation systems: a critical review. Chemosphere. 2021;266:128964.
- [CrossRef] [Google Scholar]
- Quantitative analysis of bromate in non-alcoholic beer using ultra performance liquid chromatography-electrospray ionization mass spectrometry. Anal. Methods. 2014;6(12):4038.
- [CrossRef] [Google Scholar]
- An ultra performance liquid chromatography-electrospray ionization-mass spectrometry method for the rapid analysis of nitrate in drinking water. Anal. Methods. 2013;5(5):1225.
- [CrossRef] [Google Scholar]
- Ultra-performance liquid chromatography/tandem mass spectrometry for the trace-level identification of perchlorate in filtered drinking water treated with ozonation and chlorination disinfection processes. J. King Saud Univ.-Sci.. 2021;33(1):101267.
- [CrossRef] [Google Scholar]
- Method for the fast determination of bromate, nitrate and nitrite by ultra performance liquid chromatography–mass spectrometry and their monitoring in Saudi Arabian drinking water with chemometric data treatment. Talanta. 2016;152:513-520.
- [Google Scholar]
- Assessment of inorganic ion in drinking water using new method based on ultra-performance liquid chromatography-mass spectrometry. J. King Saud. 2020;32(4):2329-2335.
- [Google Scholar]
- HPLC-ICPMS/MS shows a significant advantage over HPLC-ICPMS for the determination of perchlorate in ground, tap, and river water. Anal. Chim. Acta. 2020;1094:11-17.
- [Google Scholar]
- Hurdle technology applied to meat products of the shelf stable product and intermediate moisture food types. In: Simatos D., Multon J.L., eds. Properties of Water in Foods. Dordrecht: Springer Netherlands; 1985. p. :309-329.
- [CrossRef] [Google Scholar]
- Formation of bromate and halogenated disinfection byproducts during chlorination of bromide-containing waters in the presence of dissolved organic matter and CuO. Environ. Sci. Technol.. 2016;50(1):135-144.
- [Google Scholar]
- Determination of trace level bromate and perchlorate in drinking water by ion chromatography with an evaporative preconcentration technique. J. Chromatogr. A. 2002;956(1-2):85-91.
- [Google Scholar]
- Enhancing ammonium oxidizing bacteria activity was key to single-stage partial nitrification-anammox system treating low-strength sewage under intermittent aeration condition. Bioresour. Technol.. 2017;231:36-44.
- [Google Scholar]
- Carcinogenic effect of potassium bromate on tongue of adult male albino rats. J. Radiat. Res. Appl. Sci.. 2020;13(1):121-131.
- [Google Scholar]
- European Commission Council Directive 91/676/EEC concerning the Protection of Waters against Pollution caused by Nitrates from Agricultural Sources.
- Environmental exposure to perchlorate: a review of toxicology and human health. Toxicol. Appl. Pharmacol.. 2018;358:102-109.
- [Google Scholar]
- Determination of sulfite with emphasis on biosensing methods: a review. Anal. Bioanal. Chem.. 2013;405(10):3049-3062.
- [Google Scholar]
- Sulfite concentration and the occurrence of headache in young adults: a prospective study. Eur. J. Clin. Nutr.. 2019;73(9):1316-1322.
- [Google Scholar]
- One-step sample processing method for the determination of perchlorate in human urine, whole blood and breast milk using liquid chromatography tandem mass spectrometry. Ecotoxicol. Environ. Saf.. 2019;174:175-180.
- [Google Scholar]
- Method development and validation for the determination of sulfites and sulfates on the surface of mineral atmospheric samples using reverse-phase liquid chromatography. Talanta. 2020;219:121318.
- [CrossRef] [Google Scholar]
- Perchlorate in environmental waters of the Laurentian Great Lakes watershed: Evidence for uneven loading. J. Great Lakes Res.. 2019;45(2):240-251.
- [Google Scholar]
- Drinking water nitrate and human health: an updated review. Int. J. Environ. Res. Public Health. 2018;15(7):1557.
- [CrossRef] [Google Scholar]


