

Translate this page into:
Unique formulation of edible blended oil from sesame and mustard seeds grown in Bangladesh
⁎Corresponding author at: Oils, Fats and Waxes Research Division, Bangladesh Council of Scientific and Industrial Research (BCSIR), Rajshahi Laboratoty, Rajshahi 6206, Bangladesh. lisabcsir@yahoo.com (Mst. Sarmina Yeasmin) sarmina-raj@bcsir.gov.bd (Mst. Sarmina Yeasmin)
-
Received: ,
Accepted: ,
This article was originally published by Elsevier and was migrated to Scientific Scholar after the change of Publisher.
Abstract
Edible oils are vulnerable to oxidation-induced degradation, leading to off-flavors, carcinogenic products, and reduced nutritional content. This work aimed to prepare a blended oil (BO) from indigenous mustard and sesame seeds to extend the oil’s shelf life and boost its nutritional value. Four blends were formulated with sesame oil (SO) and mustard oil (MO) in the ratios of SO50:MO50, SO60:MO40, SO70:MO30 and SO80:MO20. GCMS analyses showed that the SO80:MO20 blend had an erucic acid content of 4.22 %, which is below the internationally accepted limit of 5 %, and an ideal fatty acid ratio of 1:1.3:1; saturated fatty acid (SFA): monounsaturated fatty acid (MUFA): polyunsaturated fatty acid (PUFA), close to the WHO/FAO permissible limit. The blend SO80:MO20 was then assessed and related to single oil. The physicochemical properties of the blended oil were superior to those of the individual oils. BO exhibited higher levels of lignan (48.96 %) and tocopherol (13.58 %) than SO (48.89 % and 12.74 %) and MO (0.24 % and 6.22 %). Additionally, BO’s sterol content was 18.7 %, surpassing SO’s 14.7 % but falling short of MO’s 21.13 %. Moreover, BO’s flash point (318 °C) closely resembled that of SO (320 °C) and MO (316 °C). Aflatoxin and trace metal levels were detected and found to be well below than permitted ranges. The blend had a total antioxidant capacity of 95 % with an IC50 value of 0.575 mg/mL, which was higher than that of the individual oils and comparable to standards. Over 180 days of storage at room temperature, the moisture content, refractive index, free fatty acids, peroxide value, p-anisidine value, saponification value, iodine value, and totox value of the BO showed a slower increase compared to the individual oils. The estimated fatty acid ratio and enriched antioxidant in the blended oil enhanced its stability and nutritional potency over the individual oils. The results of this work may represent Bangladesh’s first unique oil blend composition.
Keywords
Sesame oil
Mustard oil
Blend
Fatty acid ratio
Antioxidant, Shelf life

- SO
-
Sesame oil
- MO
-
Mustard oil
- BO
-
Blended oil
- GCMS
-
Gas Chromatogram Mass Spectrometer
- SFA
-
Saturated fatty acids
- MUFA
-
Monounsaturated fatty acids
- PUFA
-
Polyunsaturated fatty acids
- WHO
-
World Health Organization, FAO: Food and Agriculture Organization
- BHT
-
Butylated hydroxy toluene
- BHA
-
Butylated hydroxy anisole
- BARI
-
Bangladesh Agricultural Research Institute
- DPPH
-
2,2-diphenyl-1-picrylhydrazyl
Abbreviations
1 Introduction
Indigenous edible oils are very important for human diets due to their fat-soluble micronutrients and high energy content. About 90 % of indigenous oils are used for food, with demand steadily rising. In a balanced diet, 10 % of total calories should come from saturated fats, and 20–35 % from unsaturated fats (Hasan et al. 2016). Oils must maintain stability, appropriate fatty acid composition, and physicochemical properties to meet consumer demands. Though SFAs enhance oil stability, their high consumption is not recommended. Studies have shown that oils with high SFA levels are less healthy, and increase bad cholesterol (LDL-C) (Tabee et al. 2008). Conversely, MUFAs and PUFAs have beneficial effects but are prone to oxidation, reducing oil quality and increasing undesirable odors. Highly unsaturated oils require hydrogenation for storage, which creates trans fats that lower good cholesterol (HDL-C) and raise inflammation.
Researchers are working on improving the quality and storage longevity of edible oil without resorting to hydrogenation techniques. Edible oils are often marketed as blends of two or three types (Murthi et al. 1987); offering increased nutritional benefits, thermal and oxidative stability, and desirable properties (Chugh and Dhawan 2014).
According to WHO and other health agencies, an ideal edible oil should have a fatty acid ratio of 1:1–2:1 for SFA:MUFA:PUFA; however, no single oil meets this requirement (Chugh and Dhawan 2014; Hashempour-Baltork et al. 2016; Yeasmin et al. 2024). To combat this, the oil industry increasingly blends two or more indigenous oils to achieve the desired ratio, as blending is a cost-effective and simple method to modify fats for various applications. Researches on indigenous oil have shown improved oxidative stability in blends compared to single oils (Azimah, Azrina, and Khoo 2017; Chugh and Dhawan 2014; Semwal and Arya 2001; Yeasmin et al. 2024).
However, blending of indigenous oils like mustard seed oil and sesame seed oil, crucial to Bangladesh, has not been studied. Bangladesh’s soil and climate are suitable for cultivating various oilseeds, with mustards (Brassica rapa) being the most widely used and sesame (Sesamum indicum L.) (Razzaque and Karim 2007).
Mustard production in Bangladesh is 262,000 tons, covering over 60 % of the total oilseed area, while sesame occupies 9.4 % (Hasan et al., 2013). Mustard oil has anti-inflammatory, therapeutic, and nutritional benefits, but it contains more erucic acid than the recommended limit (5–5.1 %), making it less desirable (Downey 1983; Khansili and Rattu 2017). Despite having 80–87 % unsaturated fatty acids, which are heart-healthy, mustard oil is prone to oxidation, leading to harmful products and trans fats that raise bad cholesterol.
Bangladeshi sesame seed oil is rich in saturated fatty acids (44 %), which negatively affect heart, blood vessel, mental, and respiratory health when consumed in excess. However, it contains phenols that act as antioxidants against lipid peroxidation. Antioxidants inhibit oxidation and play a crucial role in detoxification, growth, and immune responses. Combining the distinct properties of different oils can enhance nutritional and functional quality.
Synthetic antioxidants are used to prevent oil oxidation, but they are harmful, promoting hemolytic activities, lung carcinogens, and tumor growth (Likhitrungrat, Chokethaworn, and Suttajit 2009). Researchers are seeking alternative antioxidants, and blending oils could be a viable solution to enrich antioxidant content naturally.
Blending sesame and mustard oils can make a product with a balanced fatty acid ratio, reduced erucic acid, and improved antioxidant and physicochemical properties.
2 Materials and methods
2.1 Materials
The research test samples were sesame oilseed (Sesamum indicum L.) and BARI Sarisha-14 mustard oilseed (Brassica rapa), both locally grown and purchased from Katakhali Bazar, Rajshahi, Bangladesh. Most chemicals used were of analytical grade, with some being GC grade. A FAME mix standard of 37 compounds was obtained from Supelco (Sigma-Aldrich, USA).
2.2 Extraction of oils and preparation of blends
Locally purchased oil seeds were manually cleaned, sundried and ground. The oil extraction process was performed using a Soxhlet extraction unit (Model D3165, KOTTERMANN, Germany) and yield percentages was determined as following (Agroindustriais 2013):
Sesame oil (SO) and mustard oil (MO) were weighed separately and mixed at four different ratios: 50:50, 60:40, 70:30 and 80:20 (SO:MO); following the method (Yeasmin et al. 2021) (Scheme 1).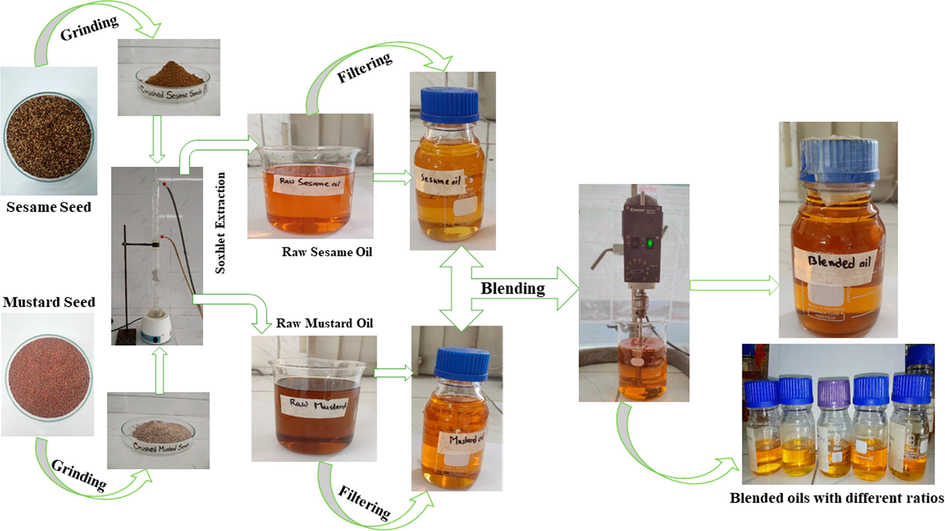
Experimental setup and schematic diagram for the preparation of blended oil.
2.3 Characterization
Physico-chemical characterization was carried out following the AOAC method (Agroindustriais 2013) with slight modification in some cases, to monitor oil quality and edibility. The instruments used to measure flashpoint, fatty acids and tocopherols, trace metals and p-anisidine value were flash point apparatus (NCL 440, NORMALAB, Belgium), GCMS (GCMS-QP-2020, Shimadju, Japan), ICPMS (NexION 2000, PerkinElmer, USA) and oil fat analyzer (CDR Food Lab, Italy) respectively. Aflatoxin of oil was detected applying effective Enzyme Linked Immunosorbent Assay (ELISA) test following by the method (Qi et al. 2019).
2.4 Statistical analysis
Statistical analyses were performed applying SPSS software version 22 to understand significant difference to all parameters. Variables were compared by one way analysis of variance (ANOVA) with post-hoc Duncan Multiple Rank Test (DMRT).
3 Results and discussion
Initially, the fatty acid percentages of four blends were analyzed to achieve the optimal ratio within the WHO/FAO approved range (1:1–2:1 of SFA:MUFA:PUFA) and to ensure erucic acid content was below 5 %. Next, the fatty acid ratio was calculated using these percentages. Subsequently, the oil with the resulting ideal ratio was termed as blended oil (BO) and compared with each individual oil in terms of physicochemical characteristics and other distinct assessments.
3.1 Fatty acid percentage and fatty acids ratio analyses
Table 1 presents the fatty acid percentages and ratios for each individual oil and their four blends. Sesame oil comprises six fatty acids, while mustard oil contains nine. Major common fatty acids in both oils include palmitic (16:0), linoleic (18:2), oleic (18:1), and stearic (18:0), with minor common ones being 13-octadecenoic (18:1) and heneicosanoic acids (21:0). Notably, erucic (22:1), gondoic (20:1), and linolenic (18:3) acids are exclusive to mustard oil. Linolenic acid, an essential ω-3 polyunsaturated fatty acid crucial for brain health and heart function, is absent in sesame oil. Gondoic and erucic acids, monounsaturated omega-9 fatty acids, offer diverse health benefits such as skin radiance, neuroprotection, and anti-inflammatory properties (Farag and Gad 2022), enhancing the appeal of sesame oil when blended with mustard oil. Values are present as means ± standard deviations (SD) from triplicate measurements (n = 3). The row bearing different superscripts indicate statistically significant differences at the level p < 0.05 among the different oil samples. SFA: Saturated fatty acid; MUFA: monounsaturated fatty acid, PUFA: polyunsaturated fatty acid.
Name of Sample
Retention Time
Fatty acids percentage %
Sesame oil (SO)
Mustard oil (MO)
SO50:MO50
SO60:MO40
SO70:MO30
SO80:MO20
Palmitic acid
18.186
22.06 ± 0.017a
8.32 ± 0.005g
17.50 ± 0.012f
18.67 ± 0.012d
18.13 ± 0.012e
19.74 ± 0.008c
Linoleic acid
20.974
25.13±
0.008d
16.78 ± 0.024g
18.58 ± 0.009f
19.28 ± 0.008e
29.19 ± 0.017c
31.05 ± 0.021b
Oleic acid
21.088
25.51 ± 0.005d
23.52 ± 0.008e
21.86 ± 0.008g
22.23 ± 0.005f
32.12 ± 0.003c
33.25 ± 0.005b
13-Octadecenoic acid
21.171
5.58 ± 0.025a
1.43 ± 0.022d
2.47 ± 0.022c
2.54 ± 0.017b
1.13 ± 0.012e
1.04 ± 0.016f
Stearic acid
21.501
19.28 ± 0.008a
3.59 ± 0.017g
13.60 ± 0.016c
14.26 ± 0.005b
8.48 ± 0.009f
9.03 ± 0.017e
Linolenic acid
23.922
ND
5.31 ± 0.008a
3.75 ± 0.005b
3.02 ± 0.012c
1.25 ± 0.009d
0.72 ± 0.008e
Gondoic acid
24.008
ND
1.24 ± 0.040a
0.86 ± 0.017b
0.67 ± 0.009c
0.27 ± 0.014d
0.15 ± 0.016e
Heneicosanoic acid
24.279
2.43 ± 0.009a
1.29 ± 0.033d
1.94 ± 0.005b
1.89 ± 0.017c
0.93 ± 0.021e
0.82 ± 0.009f
Erucic acid
26.496
ND
38.52 ± 0.012a
19.44 ± 0.009b
17.46 ± 0.008c
8.51 ± 0.005d
4.22 ± 0.012e
Fatty acid ratio (SFA:MUFA:PUFA)
1.7:1.2:1
1:4.9:1.7
1.5:2:1
1.6:1.9:1
1:1.5:1.1
1:1.3:1
Sesame oil exhibits higher levels of saturated palmitic (22 %) and stearic (19.3 %) acids compared to mustard oil, which contains lower amounts of saturated palmitic (8.32 %) and stearic (3.6 %) acids. Conversely, mustard oil shows higher concentrations of unsaturated oleic acid (23.52 %), linolenic acid (5.31 %), and erucic acid (38.52 %). In the blends, palmitic, linoleic, and oleic acids significantly (p < 0.05) increased from 17.50 % to 19.74 %, 18.58 % to 31.05 %, and 21.86 % to 33.25 %, respectively. The blends also showed variations in other fatty acids such as 13-octadecenoic, stearic, linolenic, gondoic, and heneicosanoic acids. Erucic acid content in the blends ranged from 19.44 % to 4.22 %, with the SO80:MO20 blend containing the lowest level, well below the permissible range (5–5.1 %) (Downey 1983; Khansili and Rattu 2017), making it superior for edible purposes.
The percentages of SFA, MUFA and PUFA also depicted graphically in Fig. 1. Sesame oil exhibits a higher proportion of SFA (43.774 %), a lower proportion of PUFA (25.127 %), and a moderate proportion of MUFA (31.098 %). Conversely, mustard oil contains a very low percentage of SFA (13.199 %) and PUFA (22.076 %), but a notably high percentage of MUFA (64.725 %). Blending two oils at different ratios results in a significant decrease (p < 0.05) in SFA content in sesame oil and MUFA content in mustard oil, while PUFA content significantly increases (p < 0.05) from the SO50:MO50 blend to the SO80:MO20 blend. At the SO80:MO20 blend, the percentages of SFA and PUFA are almost equal (29.58 % and 31.781 %, respectively), with MUFA slightly higher (38.639 %). Fatty acid composition plays a crucial role in oil stability, with oils containing higher unsaturation and lower saturation being more prone to oxidation and rapid spoilage (de Camargo et al. 2016).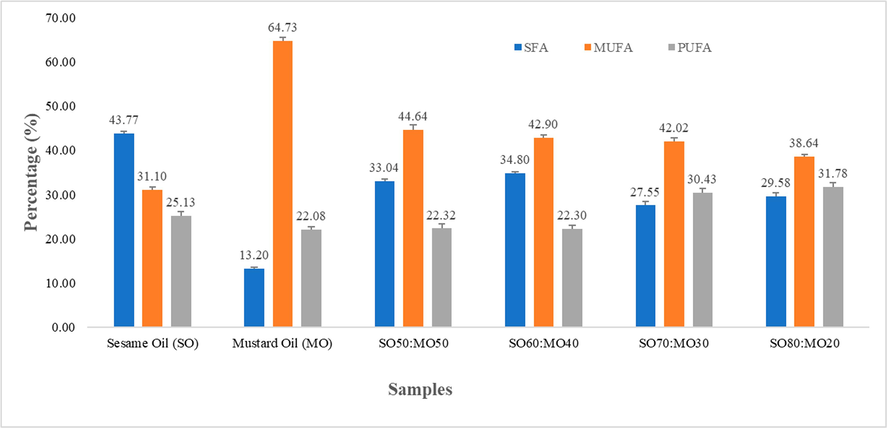
Comparative analysis of fatty acid percentages in various oil samples.
The fatty acid ratios (SFA:MUFA:PUFA) are presented in Table 2 for sesame oil, mustard oil, SO50:MO50, SO60:MO40, SO70:MO30 and SO80:MO20 blended oils. Among these, blend SO80:MO20 exhibits a balanced fatty acid ratio (1:1.3:1) closer to the recommended guidelines for health agencies and is thus more suitable for edible purposes. Based on the results, it can be concluded that among the four blends of sesame oil and mustard oil, the SO80:MO20 blend achieved an optimal fatty acid ratio. Additionally, its erucic acid content of 4.22 % was below the permissible threshold (<5%). Numerous studies have highlighted the potential toxic effects of high doses of erucic acid on the heart, emphasizing the importance of limiting its concentration to 5–5.1 % (Downey 1983; Khansili and Rattu 2017). Blending two or more different oils can yield advantageous effects due to their distinct fatty acid compositions and functions. Similar observations have been made by various researchers, underscoring that no single indigenous oil is nutritionally optimal for edible purposes (Chugh and Dhawan 2014). Values are present as means ± standard deviations (SD) from triplicate measurements (n = 3). Different superscripts in the same row indicate statistically significant differences at the level p < 0.05 among the oils.
Parameters
Sesame oil
Mustard oil
Blended oil (SO80:MO20)
Oil yield (%)
38 ± 0.816
45 ± 0.943
−-
Colour
Bright yellow in colour
Amber in colour
Reddish yellow in colour
Odour
Acceptable and good smell
Slight pungent and penetrating odour
Inoffensive and pleasant smell
Specific gravity at 25 °C (g/cm3)
0.9105 ± 0.0031a
0.9081 ± 0.0002b
0.9019 ± 0.002c
Refractive index at 25 °C
1.4698 ± 0.1247a
1.4669 ± 0.0012a
1.4655 ± 0.002a
Viscosity (cP) at 28 °C
45.43 ± 0.1247a
39.64 ± 0.0249c
41.88 ± 0.0205b
Moisture content (%)
0.04 ± 0.008a
0.06 ± 0.013a
0.05 ± 0.008a
Free Fatty Acid (as oleic %)
0.26 ± 0.017a
0.15 ± 0.008b
0.14 ± 0.008b
Peroxide value (meq O2/kg)
1.96 ± 0.016a
1.05 ± 0.021b
1.26 ± 0.012c
P-anisidine value (meq O2/kg)
1.90 ± 0.013a
1.24 ± 0.017b
1.0 ± 0.022c
TOTOX value (meq O2/kg)
5.82 ± 0.013a
3.34 ± 0.013b
3.52 ± 0.008c
Iodine value (g I2/100 g)
100.67 ± 0.170c
119.30 ± 0.021a
110 ± 0.817b
Saponification value (mg KOH/g)
189.42 ± 0.025a
170.31 ± 0.043c
181.68 ± 0.008b
Lignan (%)
48.89 ± 0.091a
0.24 ± 0.035b
48.96 ± 0.074a
Tocopherol (%)
12.74 ± 0.082b
6.22 ± 0.056c
13.58 ± 0.025a
Sterol content (%)
14.7 ± 0.033c
21.13 ± 0.012a
18.7 ± 0.009b
Flash point (°C)
318 ± 0.400b
320 ± 0.200a
316 ± 0.300c
3.2 Physico-chemical properties
For each oil and their SO80:MO20 blend, various physical and chemical parameters were measured and tabulated in Table 2. Understanding physical and chemical properties enables us to evaluate the oil’s suitability for human consumption or industrial use. These metrics serve as important indicators of edible oil quality, as highlighted by previous studies (Azimah et al. 2017; Hashempour-Baltork et al. 2016).
3.2.1 Colour and odour
Sesame oil was bright yellow in color, mustard oil was amber, and the blended oil was reddish-yellow hue. The odor of sesame oil was an acceptable and pleasant, whereas mustard oil slight pungent and more penetrating. The blended oil smelled inoffensive and pleasant. The color and odor of the oil are attributed to the presence of carotenoids, chlorophyll, and other antioxidants, as pure oils are typically odorless, colorless, and tasteless (Uzoma, 2014). Variations in color and odor can result from differences in extraction, crushing, refining, blending, and storage processes (Kılıç et al., 2007).
3.2.2 Specific gravity
At 25 °C, the specific gravity of sesame oil was higher (0.910 g/cm3) due to its higher saturation, while mustard oil had a slightly lower specific gravity of 0.908 g/cm3 owing to its higher unsaturation. The specific gravity of the blended oil (0.902 g/cm3) falls between that of sesame and mustard oils and lies within the range specified by the Codex standard (0.899–0.920) (Codex 2011). Research by Bako et al., (2017), corroborates our findings, indicating that specific gravity decreases with an increase in unsaturated fatty acid content.
3.2.3 Refractive index
The refractive index of sesame oil was 1.4698, significantly higher than the Codex standards (1.4655–1.4662), while mustard oil had a refractive index of 1.4669, falling within the Codex standard range (1.4610–1.4690) (Codex 2011). The refractive index of the blended oil was 1.4655, lower than that of mustard oil, with no significant differences observed among the three oil samples. The refractive index is indicative of the likelihood of rancidity due to oxidation, is essential for assessing oil cleanliness and detecting adulteration (Alhibshi, Ibraheim, and Hadad 2016).
3.2.4 Viscosity
In Table 2, sesame oil exhibited higher viscosity at 45.43 cP, while mustard oil showed lower viscosity at 39.64 cP. However, the viscosity decreased to 41.88 cP in the blended oil when 20 % highly unsaturated mustard oil was mixed with sesame oil. Viscosity varied significantly (p<0.05), and factors impacting viscosity included oil thickness, fatty acid unsaturation, and molecular structure, as supported by previous research (Hashempour-Baltork et al. 2016).
3.2.5 Moisture content
Moisture content in oil, measured as the presence of water or liquid, was highest in mustard oil at 0.06 % and lowest in sesame oil at 0.04 %. The blended oil exhibited a moisture content of 0.05 %, with no significant difference observed among the three oil samples. The maximum allowable range of moisture content in edible oils is 0.2 % (Federation 2011).
3.2.6 Free fatty acid
Sesame and mustard oils exhibited FFA values of 0.26 % and 0.15 %, respectively. The FFA value of the SO80:MO20 blend was significantly lower (p<0.05) at 0.14 %, comparable to mustard oil. The allowable range of FFA for edible indigenous oil is 0.6 mg KOH/g according to Codex standards (Codex 2011); and all the studied values were lower than this standard. Higher FFA leads to increased acid value and rancidity (Decker and Schwartz 2005).
3.2.7 Peroxide value
Table 2 illustrates that the peroxide values for SO, BO, and MO were 1.96 meqO2/kg, 1.26 meqO2/kg oil, and 1.05 meqO2/kg, respectively, with significant differences observed among the oils (p < 0.05). The standard quality for edible indigenous oil should not exceed 10 meqO2/kg according to Codex standards (Codex 2011) and all the reported values were well below this limit.
3.2.8 P-anisidine value
In Table 2, sesame oil and mustard oil exhibited values of 1.90 and 1.24 meqO2/kg, respectively. However, the SO80:MO20 blend showed a significantly lower value (1.0 meqO2/kg oil), indicating greater oxidative stability compared to individual oils. These values differed significantly among the samples (p < 0.05) and were well below the safety limit of 20 meqO2/kg (Codex 2011). A higher anisidine value indicates increased oil degradation (Arslan et al. 2017).
3.2.9 TOTOX value
Table 2 shows that sesame oil had the highest total oxidation (TOTOX) value at 5.82 meqO2/kg, while mustard oil had the lowest at 3.34 meqO2/kg. The blended oil had a TOTOX value of 3.52 meqO2/kg, falling within the range of SO and MO. All values complied with the Codex standard of 26 meqO2/kg (Codex 2011). TOTOX is the primary and secondary oxidation products in oil or fat, commonly used to estimate lipid degradation due to oxidation. A lower value indicates greater oxidative stability and lower rancidity (Wai et al., 2009).
3.2.10 Iodine value
Table 2 compares the Iodine value (IV) of all oils with the Codex standard (Codex 2011). In this study, sesame oil exhibited the lowest IV at 100.67gI2/100 g oil, while mustard oil had the highest at 119.30 gI2/100 g oil, falling within the standard range. The blended oil had an IV of 110 gI2/100 g oil, comparable to sunflower oil and rice bran oil, indicating good quality and semi-drying characteristics (Fenando and Akujobi 1987).
3.2.11 Saponification value
Saponification values for sesame oil and mustard oil were 189.42 mg KOH/g and 170.3 mg KOH/g, respectively, falling within the Codex Alimentarius Commission’s defined ranges (Codex 2011). The SO80:MO20 blend had a saponification value of 181.68 mg KOH/g, significantly higher (p < 0.05) than mustard oil and lower than sesame oil. A higher saponification value indicates higher levels of low molecular weight fatty acids, with values above 200 mg KOH/g indicating unsuitability for thermal stabilization and soap production in the industry (Muhammad et al., 2006).
3.2.12 Flash point and nutritional value
The flash point of BO (318 °C), closely resembled that of SO (320 °C) and MO (316 °C). All samples exhibited higher flash points, indicating reduced ignition risks. BO contained 48.96 % lignin and 13.58 % tocopherol, while SO had 48.89 % lignin and 12.74 % tocopherol, and MO possessed only 0.24 % lignin and 6.22 % tocopherol. Moreover, BO had an 18.7 % sterol content, surpassing SO's 14.7 % but falling short of MO's 21.13 %. Oils with elevated levels of lignin, sterol, and tocopherol contribute to enhanced oxidative stability.
3.3 Concentration of toxic trace metals
Monitoring toxic trace metals in edible oils is crucial for food safety and shelf-life. Metals like As, Cd, Cr, Pb, and Hg accelerate oil oxidation and pose health risks if consumed in excess. Recent research worldwide has focused on determining heavy metal levels in edible oils (Alrajhi and Idriss 2020).
The concentrations of toxic metals (Hg, As, Pb, Ni, Cr, Cd, Be, Se) in the SO80:MO20 blend and individual oils were measured and compared to WHO/FAO permissible levels (Table 3). Results showed that all metals in SO, MO, and BO were within the recommended limits established by WHO/FAO (Berg and Licht 2002). There were no significant differences among the oils, and all values were well below the maximum tolerable range for indigenous oils. Initial metal content affects oil stability during storage (List et al., 2005). The prepared blended oil had very low concentrations of toxic trace metals, making it suitable for consumption. All of the presented results are the means ± standard deviation of three independent experiment.
Metals
Average concentration (studied values) in ppb
Recommended level by WHO/FAO for edible vegetable oils in ppb (Berg & Licht, 2002)
Sesame oil (SO)
Mustard oil (MO)
Blended oil (BO)
As
2.20 ± 0.200
2.60 ± 0.200
2.50 ± 0.200
100
Be
0.01 ± 0.001
0.02 ± 0.001
0.01 ± 0.001
120
Cd
3.20 ± 0.300
3.00 ± 0.300
3.10 ± 0.300
50–100
Cr
0.10 ± 0.000
0.20 ± 0.000
0.20 ± 0.000
50–100
Hg
0.33 ± 0.03
0.34 ± 0.030
0.32 ± 0.030
1
Ni
51.10 ± 4.00
51.00 ± 4.000
54.20 ± 4.000
100000–300000
Pb
8.50 ± 1.00
8.00 ± 1.000
8.40 ± 1.000
100
Se
0.57 ± 0.10
0.55 ± 0.100
0.59 ± 0.100
550
3.4 Aflatoxin determination
Aflatoxin level was determined in blended oil (SO80:MO20) and compared them with other edible oils (Table 4). Two soybean oil brands (Rupchanda and Teer) and three mustard oil brands (Hasan Wali, Radhuni, and Suresh) were tested. Aflatoxin levels varied significantly (p < 0.05). Teer Soybean Oil had the highest aflatoxin content at 2.959 ppb, followed by Radhuni Mustard Oil at 2.060 ppb. Rupchanda Soybean Oil, Hasan Wali Mustard Oil, and Suresh Mustard Oil had lower levels at 0.986, 1.153, and 0.125 ppb respectively. Blended oil had the lowest aflatoxin level at 0.015 ppb, well below the EU limit of 4 ppb for indigenous oils (Egmond et al., 2007). The result for blended oil was significantly lowered as compared to European’s limit. Yang et al., (2011) investigated a range of aflatoxin contamination (0.15 to 2.72 ppb) in edible oil grown in China. Each value is the average of three analyses ± SD. The column bearing different superscripts is significantly different (p < 0.05).
Description of sample
Amount (ppb)
Test parameter (ELISA Test Kit method)
Acceptable limit as per European Union for vegetable oil
Soyabean Oil (Rupchanda)
0.986 ± 0.001d
Aflatoxins
(B1, B2, G1, G2)4 ppb
Soyabean Oil (Teer)
2.959 ± 0.002a
Aflatoxins
(B1, B2, G1, G2)
Mustard Oil (Radhuni)
2.060 ± 0.004b
Aflatoxins
(B1, B2, G1, G2)
Mustard Oil (Hasan Wali)
1.153 ± 0.001c
Aflatoxins
(B1, B2, G1, G2)
Mustard Oil (Suresh)
0.125 ± 0.003e
Aflatoxins
(B1, B2, G1, G2)
Blended Oil (SO80:MO20)
0.015 ± 0.002e
Aflatoxins
(B1, B2, G1, G2)
3.5 Total antioxidant as DPPH free radicals scavenging capacity percentage
DPPH scavenging percentages were determined at different concentrations, as shown in Fig. 2A. Results indicated that scavenging percentages increased with concentration up to 1.0 mg/mL, then plateaued. IC50 values, representing the concentration needed to scavenge 50 % of DPPH radicals, were calculated and presented in Fig. 2B. Lower IC50 values indicate higher antioxidant activity (Khatoon et al. 2013).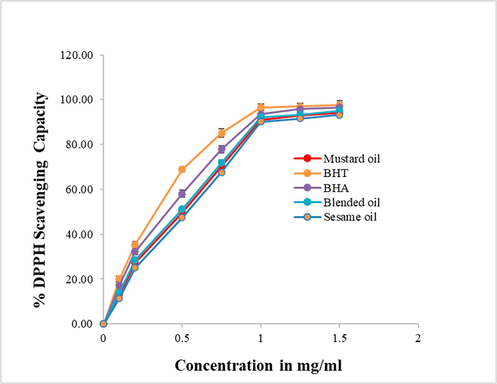
DPPH radical scavenging percentage across a varieties of samples.
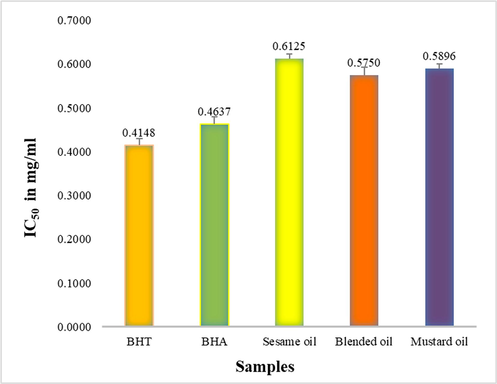
IC50 value of different samples.
At 1.5 mg/mL, blended oil showed the highest DPPH scavenging capacity at 95 % with an IC50 of 0.5750 mg/mL, outperforming sesame and mustard oils. Mustard oil had a scavenging capacity of 94 % and an IC50 of 0.5896 mg/mL, while sesame oil showed 93 % scavenging with an IC50 of 0.6125 mg/mL. BHT and BHA demonstrated higher antioxidant capacities (97.6 % and 96.5 %, respectively) with IC50 values of 0.4148 and 0.4637 mg/mL. The blended oil’s radical scavenging capacity was comparable to BHT and BHA at 1.5 mg/mL. A diet rich in antioxidants protects cells from free radicals, potentially preventing cancer, heart disease, and Alzheimer’s (Umamaheswari and Chatterjee 2008). Therefore, blended oil, with its additional antioxidants, is superior to single oils.
3.6 Shelf-life study
Table 5 shows the results, indicating a slight increase in moisture content for all samples, with a significant rise (p < 0.05) after 180 days, but all remained below the Codex Alimentarius limit of 0.2 % (Codex 2011). Each value is the average of three analyses ± standard deviation. The row bearing different superscripts is significantly different at the level p < 0.05 among the days.
Parameters
Oil
0 days
60 days
120 days
180 days
Moisture content (%)
Sesame oil
0.04 ± 0.008b
0.07 ± 0.011b
0.09 ± 0.009b
0.16 ± 0.005a
Mustard oil
0.06 ± 0.013b
0.06 ± 0.012b
0.06 ± 0.007b
0.13 ± 0.005a
Blended oil
0.05 ± 0.008b
0.06 ± 0.012b
0.07 ± 0.011b
0.12 ± 0.013a
Specific gravity at 25 °C (g/cm3)
Sesame oil
0.9105 ± 0.0031a
0.9104 ± 0.0030a
0.9101 ± 0.0031a
0.910 ± 0.0033a
Mustard oil
0.9081 ± 0.0002b
0.9081 ± 0.0002b
0.9077 ± 0.0006b
0.9075 ± 0.0002b
Blended oil
0.9019 ± 0.002a
0.9017 ± 0.001a
0.9017 ± 0.001a
0.9016 ± 0.002a
Refractive index at 25 °C
Sesame oil
1.4698 ± 0.1247a
1.4698 ± 0.1240a
1.4701 ± 0.1233a
1.4707 ± 0.1248a
Mustard oil
1.4669 ± 0.0012a
1.4669 ± 0.0011a
1.4671 ± 0.0012a
1.4673 ± 0.001a
Blended oil
1.4655 ± 0.002a
1.4655 ± 0.001a
1.4657 ± 0.002a
1.4657 ± 0.001a
Free Fatty Acid (as oleic %)
Sesame oil
0.26 ± 0.017b
0.29 ± 0.012b
0.49 ± 0.005a
0.60 ± 0.021a
Mustard oil
0.15 ± 0.008b
0.16 ± 0.002b
0.40 ± 0.005a
0.46 ± 0.021a
Blended oil
0.14 ± 0.008a
0.16 ± 0.012a
0.17 ± 0.005a
0.19 ± 0.022a
Peroxide value (meqO2/kg)
Sesame oil
1.96 ± 0.016d
4.58 ± 0.005c
5.09 ± 0.018b
8.05 ± 0.017a
Mustard oil
1.05 ± 0.021d
3.50 ± 0.005c
4.08 ± 0.003b
7.99 ± 0.005a
Blended oil
1.26 ± 0.012d
1.87 ± 0.005c
2.09 ± 0.009b
5.22 ± 0.008a
p-anisidine value (meqO2/kg)
Sesame oil
1.90 ± 0.013d
4.8 ± 0.012c
7.4 ± 0.008b
12.5 ± 0.013a
Mustard oil
1.24 ± 0.017d
3.03 ± 0.016c
6.4 ± 0.017b
10.1 ± 0.017a
Blended oil
1.0 ± 0.022d
1.8 ± 0.012c
4.4 ± 0.021b
9.5 ± 0.024a
TOTOX value (meq O2/kg)
Sesame oil
5.82 ± 0.013d
13.96 ± 0.012c
17.58 ± 0.005b
28.60 ± 0.007a
Mustard oil
3.34 ± 0.013d
10.03 ± 0.012c
14.56 ± 0.005b
26.08 ± 0.008a
Blended oil
3.52 ± 0.008d
5.54 ± 0.012c
8.58 ± 0.005b
19.94 ± 0.007a
Iodine value (g I2/100 g)
Sesame oil
100.67 ± 0.170c
100.01 ± 0.471a
99.89 ± 0.816b
86.91 ± 0.471b
Mustard oil
119.30 ± 0.021a
118.1 ± 0.471a
116.40 ± 0.816b
115.4 ± 0.471b
Blended oil
110 ± 0.816a
110 ± 0.471a
107 ± 0.816b
104 ± 0.471b
Saponification value (mg KOH/g)
Sesame oil
189.42 ± 0.025a
187.55 ± 0.022b
180.48 ± 0.017c
178.63 ± 0.022d
Mustard oil
170.31 ± 0.043c
170.01 ± 0.032b
169.99 ± 0.047c
168.02 ± 0.027d
Blended oil
181.67 ± 0.008a
180.55 ± 0.022b
180.48 ± 0.031c
179.99 ± 0.007d
The specific gravity of the blended oil (BO) decreased more slowly compared to soybean oil (SO) and mustard oil (MO), with non-significant decreases at 25 °C. The refractive index of BO increased slowly over 6 months, with no significant differences among the oils over time.
Free fatty acid (FFA) values ranged from 0.26 to 0.60 for SO and 0.15 to 0.46 for MO, showing a significant increase after 120 days. BO showed a very slow FFA increase (0.14 to 0.19) over 180 days, all within the safety limit of 0.6 % (Codex 2011).
Peroxide values increased over time, reaching 8.05 meqO2/kg for SO, 7.99 meqO2/kg for MO, and 5.22 meqO2/kg for BO at 180 days. BO had a slower rise in peroxide value, with significant differences (p < 0.05) in all oils over time, consistent with previous studies on olive oil (Méndez and Falqué 2007). Peroxide levels above 10 meqO2/kg indicate oxidation and off-flavors (Chugh and Dhawan 2014).
Over 180 days, SO had the highest p-anisidine value (1.90 to 12.5), followed by MO (1.24 to 10.1) and BO (1.0 to 9.5), with significant differences (p < 0.05). Peroxides break down into harmful chemicals, increasing the p-anisidine value and leading to oxidative rancidity.
The TOTOX value of the stored SO80:MO20 blended oil ranged from 3.52 to 19.94 meqO2/kg oil, staying within the Codex standard limit of 26 meqO2/kg oil (Codex 2011). In contrast, the TOTOX values for soybean oil (5.82 to 28.60 meqO2/kg oil) and mustard oil (3.34 to 26.08 meqO2/kg oil) exceeded the permissible range after 180 days, indicating rapid oxidation.
Iodine values (IV) decreased significantly (p < 0.05) from 100.67 to 86.91 gI2/100 g for SO and from 119.30 to 115.4 for MO after 120 days, reflecting the decomposition of double bonds in the oil. BO showed a non-significant decrease in IV from 110 to 104 over 180 days. The saponification value decreased slightly for all oils over 180 days, with significant differences (p < 0.05) observed.
After 180 days of storage, the moisture content, refractive index, FFA, peroxide value, p-anisidine value, saponification value, iodine value, and TOTOX value of BO showed a slower increase compared to SO and MO. Despite some significant and non-significant changes, BO maintained consistent quality without developing an unpleasant smell over six months. The natural antioxidants in sesame and mustard oils likely contributed to this stability by preventing rapid oxidation.
Overall, the study found that the designed oil blend had superior shelf life and stability compared to individual oils. The desired fatty acid ratio in the blend may enhance its nutritional value and durability, consistent with findings from other research on indigenous oil blends (Murthi et al. 1987).
4 Conclusions
In Bangladesh, sesame and mustard oils are the most affordable and widely available edible indigenous oils. Sesame oil, rich in natural antioxidants such as sesamolin, sesamin and tocopherol, can lower blood cholesterol and pressure. On the other hand, Mustard oil contains beneficial phytosterols, tocopherols, and minerals, but its high erucic acid content, which has negative health impacts, is restricted by health agencies. Sesame oil has six fatty acids with higher saturation, while mustard oil has nine fatty acids with higher unsaturation. Blending sesame and mustard oils results in a product of superior quality compared to individual oils. The result indicated that the SO80:MO20 blend from sesame and mustard seeds oils offers nutritional benefits with an increased number of fatty acids and an ideal fatty acid ratio. The blend demonstrated good storage stability, met recommended standards, and exhibited improved antioxidant and physico-chemical properties. This blend, free from synthetic stabilizers, could be widely used in Bangladesh as an edible oil.
Funding source
This study was conducted as part of an R&D project funded by the Bangladesh Council of Scientific and Industrial Research (BCSIR), Dhaka, Bangladesh, entitled “Unique formulation of edible blended oil from rice bran and other indigenous oils,” during the 2018–2021 fiscal year ((BCSIR Ref no. 39.02.8140.038.14.198.21/803 dated 30.12.2021).
CRediT authorship contribution statement
Mst. Sarmina Yeasmin: Writing – review & editing, Writing – original draft, Conceptualization. Ali Ahsan Muzahid: Conceptualization. G.M. Masud Rana: Data curation. Tahmina Akter Chowdhury: Formal analysis. Subarna Sandhani Dey: Methodology. Md. Jasim Uddin: Writing – review & editing, Data curation. Md. Mahmudur Rahman: Investigation. Lailatul Ferdousi: Methodology. Jaytirmoy Barmon: Validation. Bijoy Chandra Ghos: Resources. Md. Salim Khan: Supervision.
Acknowledgment
We are appreciative to the Bangladesh Council of Scientific and Industrial Research (BCSIR), Dhaka, Bangladesh, for providing the resources required to complete this study.
References
- AOAC. official methods of analysis of the association of official analytical chemists. Caracterização, Propagação E Melhoramento Genético De Pitaya Comercial E Nativa Do Cerrado. 2013;26(74):62.
- [Google Scholar]
- Effect of Heat Processing and Storage on Characteristic and Stability of Some Edible Oils. In: In Proceedings of the 6th Int’l Conference on Agriculture, Environment and Biological Sciences (ICAEBS’16). 2016. p. :105-109.
- [Google Scholar]
- Concentration of trace metals in some major edible oils of riyadh. Revista Internacional De Contaminación Ambiental. 2020;36(4):977-984.
- [Google Scholar]
- A study on monitoring of frying performance and oxidative stability of cottonseed and palm oil blends in comparison with original oils. Int. J. Food Prop.. 2017;20(3):704-717.
- [Google Scholar]
- Criteria for the extraction of fish oil. Agric. Eng. Int. CIGR J.. 2017;19(3):120-132.
- [Google Scholar]
- International Legislation on Trace Elements as Contaminants in Food: a Review. Food Addit. Contam.. 2002;19(10):916-927.
- [Google Scholar]
- Codex, STAN. 2011. “Codex Standard for Named Vegetable Oils (CODEX STAN 210-1999).” Food and Agriculture Organization of the United Nations and World Health Organization, Rome, Italy.
- de Camargo, Adriano Costa, Marisa Aparecida Bismara Regitano-d’Arce, Severino Matias de Alencar, Solange Guidolin Canniatti-Brazaca, Thais Maria Ferreira de Souza Vieira, and Fereidoon Shahidi. (2016). “Chemical Changes and Oxidative Stability of Peanuts as Affected by the Dry-Blanching.” Journal of the American Oil Chemists’ Society 93:1101–9.
- Handbook of food analytical chemistry, volume 1: water proteins, enzymes, lipids and carbohydrates. Wiley. 2005
- [Google Scholar]
- The origin and description of the brassica oilseed crops. High and Low Erucic Acid Rapeseed Oils 1983:1-20.
- [Google Scholar]
- Regulations relating to mycotoxins in food: perspectives in a global and european context. Anal. Bioanal. Chem.. 2007;389:147-157.
- [Google Scholar]
- Omega-9 fatty acids: potential roles in inflammation and cancer management. J. Genet. Eng. Biotechnol.. 2022;20(1):1-11.
- [Google Scholar]
- Federation, Australian Oilseeds. 2011. “Section 1: Quality Standards, Technical Information & Typical Analysis.” Australian Oilseeds Federation, Australia Square 40–45.
- Chemical analysis of selected vegetable oils and fats of sokoto state. Nigeria J. Basic and Appl. Sci.. 1987;1:11-14.
- [Google Scholar]
- Hasan, Md Nazmul, M. Shahadat Hossain, Md Rafiqul Islam, Md Abdul Bari, Dilruba Karim, and M. Ziaur Rahman. (2013). “Trends in the Availability of Agricultural Land in Bangladesh.” Soil Resource Development Institute (SERDI), Ministry of Agriculture, Bangladesh, Dhaka. Available from URL: Http://Www. Nfpcsp. Org/Agridrupal/Sites/Default/Files/Trends-in-the-Availability-Ofagricultural-Land-in-Bangladesh-SRDI-Supported-by-NFPCSP-FAO. .
- Study on physicochemical properties of edible oils available in bangladeshi local market. Archives of Current Res. Int.. 2016;6(1):1-6.
- [Google Scholar]
- Vegetable oil blending: a review of physicochemical, nutritional and health effects. Trends Food Sci. Technol.. 2016;57:52-58.
- [Google Scholar]
- A comparative study of hidden characteristics of canola and mustard oil. Int. J. Chem. Stud.. 2017;5(3):632-665.
- [Google Scholar]
- Estimation of total phenol and in vitro antioxidant activity of albizia procera leaves. BMC. Res. Notes. 2013;6:1-7.
- [Google Scholar]
- A novel method for color determination of edible oils in L* A* B* format. Eur. J. Lipid Sci. Technol.. 2007;109(2):157-164.
- [Google Scholar]
- Butylated hydroxytoluene in edible vegetable oils from local markets of chiang mai and mae hong son and its thermal stability in different cooking conditions. Thai J. Toxicology. 2009;24(2):113.
- [Google Scholar]
- Storage, handling and transport of oils and fats. Bailey’s Industrial Oil and Fat Products. 2005;5:191-221.
- [Google Scholar]
- Effect of storage time and container type on the quality of extra-virgin olive oil. Food Control. 2007;18(5):521-559.
- [Google Scholar]
- Comparative analysis of vegetable oils in bodinga, Sokoto State, Nigeria. Bio. Environ. J. Trop. 2006;3(1):113-116.
- [Google Scholar]
- Storage stability of edible oils and their blends. J. Food Sci. Technol. (Mysore). 1987;24(2):84-87.
- [Google Scholar]
- Aflatoxin B1 in peanut oil from western guangdong, China, during 2016–2017. Food Additives & Contaminants: Part B. 2019;12(1):45-51.
- [Google Scholar]
- Effect of varying concentrations of certain salts on germination and seedling vigor of two rape (Bassica Napus L.) varieties. Mesopotamia J. Agric.. 2007;14(2):25-40.
- [Google Scholar]
- Studies on the stability of some edible oils and their blends during storage. J. Food Sci. Technol. (Mysore). 2001;38(5):515-558.
- [Google Scholar]
- Effects of Α-tocopherol on oxidative stability and phytosterol oxidation during heating in some regular and high-oleic vegetable oils. J. American Oil Chemists’ Society. 2008;85(9):857-867.
- [Google Scholar]
- In Vitro antioxidant activities of the fractions of coccinia grandis L. leaf extract. Afr. J. Tradit. Complement. Altern. Med.. 2008;5(1):61-73.
- [Google Scholar]
- Uzoma, Obeagu Getrude. 2014. “EXTRACTION AND PARTIAL CHARACTERIZATION OF MUSTARD SEED (BRASSICA SPP.) OIL.”.
- Determination of TOTOX value in palm oleins using a FI-potentiometric analyzer. Food Chem.. 2009;113(1):285-290.
- [Google Scholar]
- Determination of aflatoxins in edible oil from markets in hebei province of china by liquid chromatography-tandem mass spectrometry. Food Additives and Contaminants: Part B. 2011;4(4):244-327.
- [Google Scholar]
- Physico-chemical properties and GCMS analyses of indigenous rice bran and mustard seed oils and their blends. Biomed. J. Sci. Tech. Res.. 2021;34(5):27167-27172.
- [Google Scholar]
- A comparison of indigenous vegetable oils and their blends with optimal fatty acid ratio. Appl. Food Res.. 2024;4(1)
- [Google Scholar]
Appendix A
Supplementary data
Supplementary data to this article can be found online at https://doi.org/10.1016/j.jksus.2024.103355.
Appendix A
Supplementary data
The following are the Supplementary data to this article:


