

Translate this page into:
Understanding the structural framework controlling the sedimentary basins from the integration of gravity and magnetic data: A case study from the east of the Qattara Depression area, Egypt
⁎Corresponding author. saada.elsayed@suezuniv.edu.eg (Saada Ahmed Saada)
-
Received: ,
Accepted: ,
This article was originally published by Elsevier and was migrated to Scientific Scholar after the change of Publisher.
Peer review under responsibility of King Saud University.
Abstract
Determining the main structures that control sedimentary basins from magnetic and gravity data is an important step for hydrocarbon exploration. In this study, the structural features of the area, east of the Qattara Depression, was deduced utilizing the gravity and magnetic data. Regional-residual separation, lineament analysis, tilt derivative and spectral analysis techniques were utilized to realize this main goal. Fast Fourier transform (FFT) was used for regional and residual separation. The structural patterns of the area were outlined by lineament analysis. The bedrock depth was calculated by applying the spectral analysis method on twenty gravity and magnetic profiles. The coupled 2D and 2.5D modeling along the three gravity and magnetic profiles indicated that the region consists of horsts and grabens blocks, consisting of both acidic and basic rocks. Consequently, a structural map was made to identify the main basins and highs. Besides, it was observed that the thickness of the sedimentary cover varies between 2.5 and 5.5 km in the study area.
Keywords
Western Desert
FFT
Modeling
Tilt derivative
Structural map

1 Introduction
Gravity and magnetics (GM) are popular geophysical methods used in hydrocarbon exploration. Moreover, gravity and magnetics have numerous application fields for detection the geological sources. In oil prospecting, the GM methods are particularly appropriate in unexplored basins, salt regions, and foothills and overthrust belts. The GM methods are used to outline the underground geology and to estimate resources for specific considerable sulfide- and magnetized-ore bodies. Furthermore, there has been a notable expansion in the application of GM techniques in specific studies for crustal, shallow targets, deep structures, archeology, mineralization, geothermal and hydrogeological studies (Eldosouky et al., 2021a,b; Pham et al., 2021, Sehsah and Eldosouky, 2020; Eldosouky and Mohamed, 2021; Saada et al., 2020; 2021).
Western Desert (WD) province is the best encouraging region for hydrocarbon exploration afterward Gulf of Suez. It covers 68% of the terrestrial surface of Egypt. WD is a large platform by an approximate altitude of 500 m overhead sea level containing thick-layered of sedimentary rocks on which tectonic disturbances had no effect (Said, 1990). According to Shahin (1989), the northerly region of the WD (north to latitude 29◦ N) contains various prospective sedimentary rocks, in Matruh-Shushan, Alamein, Gharadig, and Faghur basins.
The GM interpretation stills a primary step in petroleum and/or mineral assessments. The GM surveys are used to outline the depth of resources. In the present work, we have focused on: (1) determining the structural pattern of the region in the east of the c, Egypt by using its potential field data; (2) the fault pattern affecting the study area; (3) the types of the magnetic sources of the study area. Several drilled wells were used to validate the modeled profiles.
2 Geological setting
The investigated region is to the east of Qattara Depression area. It covers a region between latitudes 29° 00ʹ–30° 00ʹ N and longitudes 28° 00ʹ–30° 00ʹ E (Fig. 1). The surface is covered by sediments of Miocene, Oligocene, and Quaternary sand dunes (Fig. 1). Oligocene sediments (To) consist of fluvial clastics and gravel pieces. Quaternary deposits (Q), located to the South, consist of sand and gravel. Furthermore, sand dunes (Qd), generally lie along the NNW direction, are related to Pliocene-Recent age.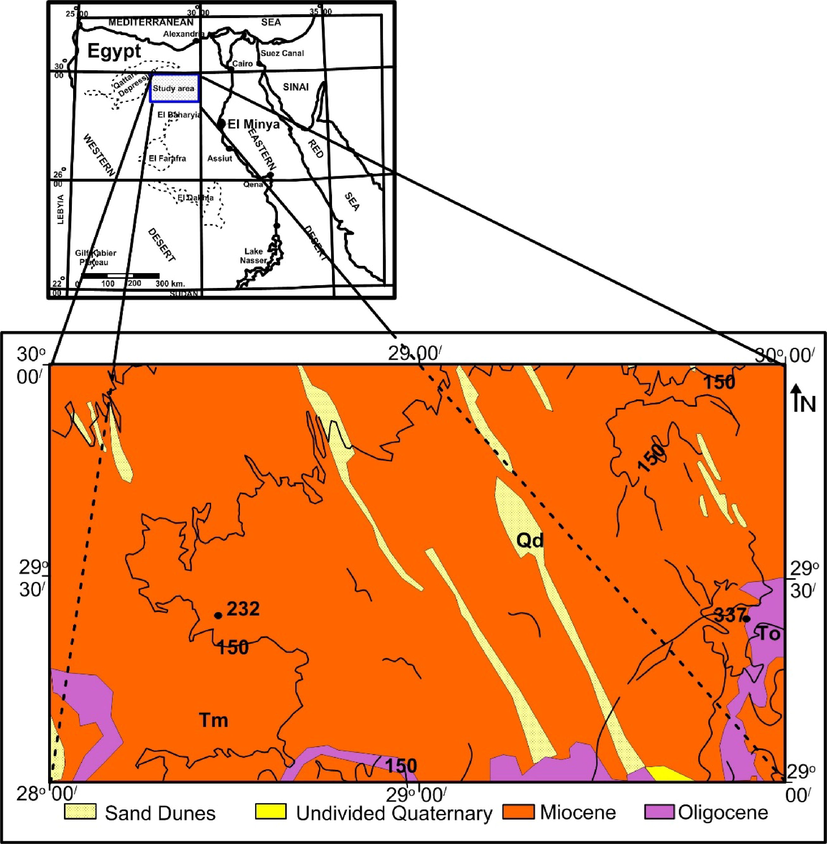
Geologic map of the area (Egyptian Geological Survey, 1981).
The WD includes three tectonic provinces controlling its stratigraphic and structural pattern. These are: (1) the Arabian-Nubian massif (Owienat region); (2) The stable shelf (the middle strip of Egypt), (3) the unstable shelf (the northern portion of the WD) (Youssef, 2003). The investigated region lies within the unstable shelf (Said, 1962). The asymmetric linear folding and faulting denote the stratigraphic system in several portions. Precambrian to Recent tectonic events affected the examined area. The trends of Precambrian tectonic include East African, Suez and Tibesti trends that are well-maintained in basement rocks of northern WD (Meshref, 1990, 1995). Newer trends seemed in Paleozoic Era that causes the formation of E-W trend. Meshref (1990) indicated that this trend is recorded in regional magnetic and isopach maps of WD.
Stratigraphically, the area demonstrates rocks age varies from Cambrian to Recent, as revealed from the drilled wells (E. Bahariya-32A, Diyur-1, WD 57-1, and Rabat-1). The northern stratigraphy of the WD was divided by Barakat (1984) into three sections: a- the lower section (has a Cambrian to Early Mesozoic age mainly clastic rocks); b- the middle section (has a Cenomanian to Late Eocene age mostly calcareous rocks); and c- the upper section (has age ranges from Oligocene to Recent of clastic rocks). Fig. 2 illustrates the stratigraphic column of the Western Desert. It shows that the rocks from the Cambro-Ordovician to the present were recorded unconformably over the Precambrian rocks (El Shaarawy, 1994).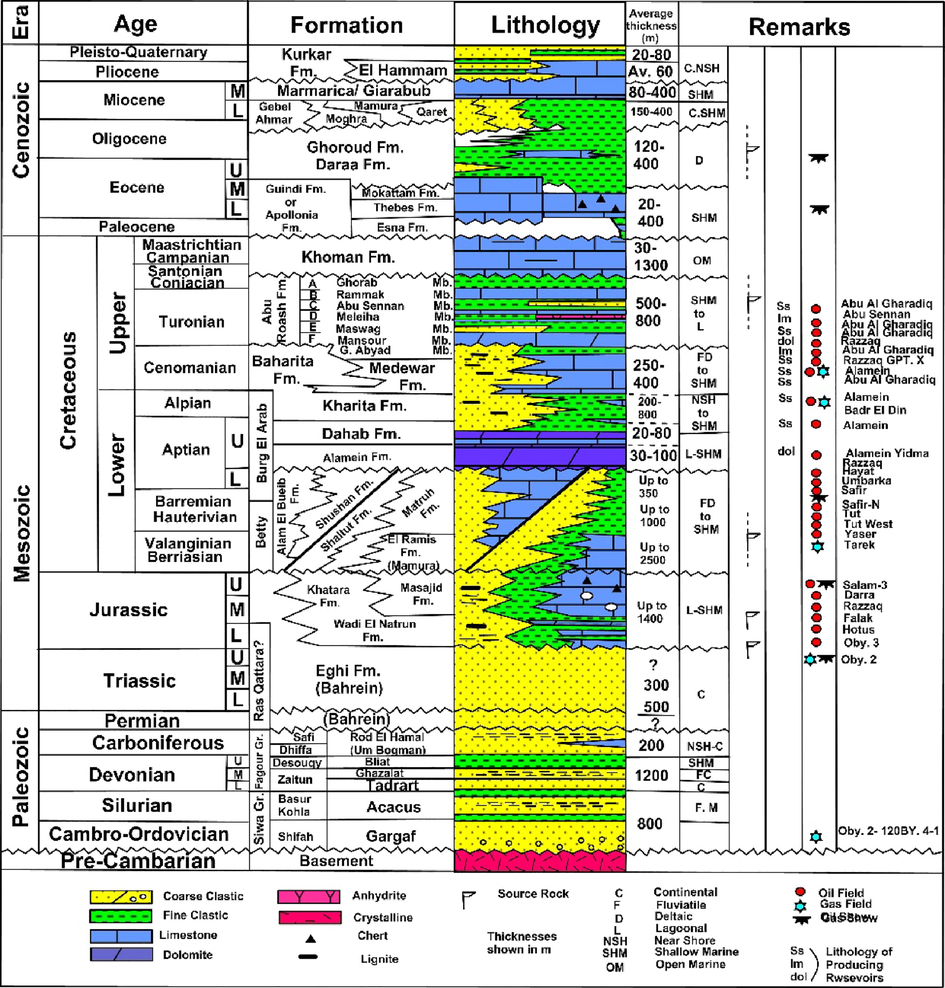
The Stratigraphic sequence of the WD (after BAPETCO, 2007).
3 Methodology
3.1 Tilt derivative (TDR)
Miller and Singh (1994) presented the first phase-based technique, named the tilt derivative (TDR). The method uses the horizontal gradient magnitude to balance the vertical gradient of the potential data. The method is given by:
3.2 Separation
The separation of regional-residual components was applied to the GM data to separate the anomalies produced by shallower geologic sources from those of deeper ones. Eliminating the regional field from the observed field; ensuing the residual one. Usually, regional anomalies are wide and smooth due to their deeper and greater structures whereas, residual ones are considered sharp slopes and high-frequencies because of their shallow sources (Abu El-Ata et al., 2012; Maden et al., 2015). These residual anomalies have great importance in geophysical prospecting. In general, several approaches are used for determining the residuals components. Examination of the radial power spectrum of GM data is a suitable and dependable apparatus for guessing the ensemble depths of different GM prospects of different changes in density or magnetic susceptibilities (Spector and Grant, 1970).
4 Data and results
The Bouguer and the total field intensity (TF) aeromagnetic maps are primary data used in the study. The Bouguer anomaly map was collected by the General Petroleum Company in 1984 by a scale of 1:200,000, a station interval of 1000 m, line spacing 5000 m and 1 mGal contour interval (Fig. 3). The Free-Air and the Bouguer corrections were applied using standard values of 0.3086 mGal/m and 2670 kg/m3, respectively. The TF magnetic map (Fig. 4a) was surveyed and compiled by the Egyptian General Petroleum Corporation (EGPC) in 1994, the scale was 1:250,000 and contour interval is 2 nT, and altitude 610 m. The 41° N and 0.25°E were used as inclination and declination angles, respectively to build the reduced to north magnetic pole (RTP) map (Fig. 4b). Several drilled wells were used to compel the modeled profiles.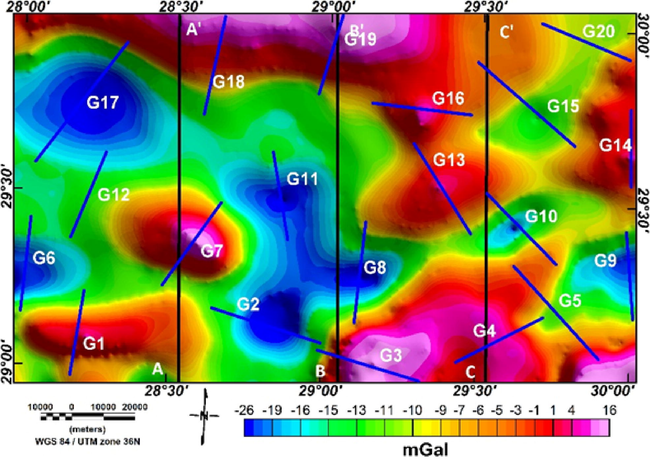
The Bouguer anomaly map showing the locations of spectral analysis (G1-G20) and coupled GM modeling profiles (AA', BB', and CC').
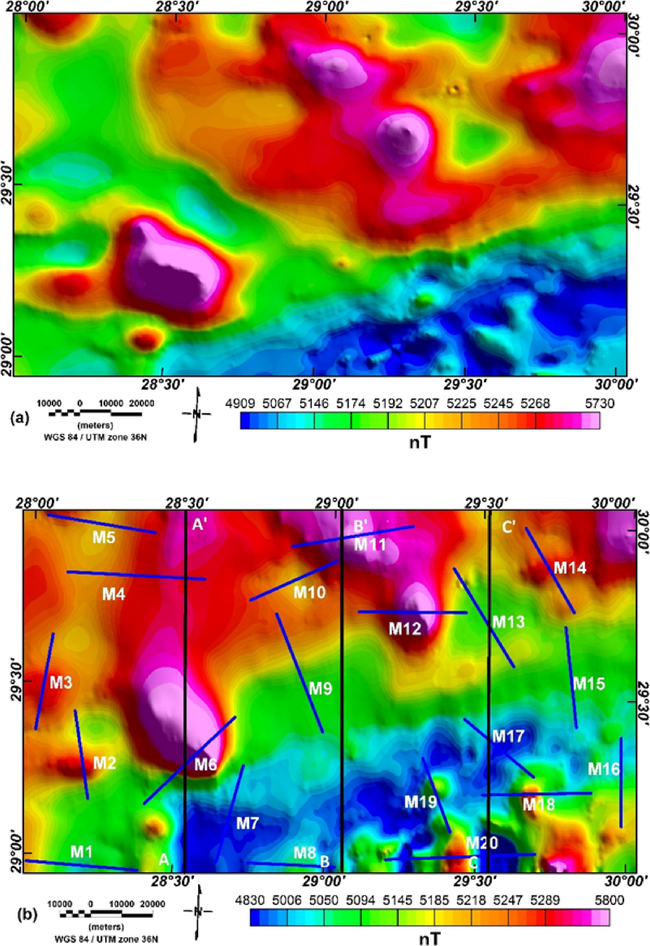
(a) The TF aeromagnetic map of the area. (b) The RTP map (EGPC, 1994) showing the locations of the SPA (M1-M20) and the coupled GM modeling profiles (AA', BB', and CC').
The Bouguer map (Fig. 3) displays four negative anomalies indicating basins or down-faulted blocks of amplitudes ranging from −26 to −10 mGal and trending in the E-W to ENE directions. Conversely, positive anomalies are interpreted as uplifted blocks surrounding these basins. The extreme positive anomaly remarks the northern region has an amplitude of 16 mGal is related to high density or horst block. Positive anomalies show E-W, ENE, and WNW trends. Linear anomalies that indicate faults reveal an E-W trend.
The RTP map (Fig. 4b) reveals a chain of positive and negative anomalies characterized by different dimensions, forms, lineation, and extensions of uniform or moderate gradients. These anomalies are trending in NE, ENE, and NW directions. The southern region has the smallest amplitude of 4830 nT with ENE direction. Conversely, the largest amplitude of 5800 nT is exposed close to the middle part.
4.1 Regional-residual separation
The regional (low-pass) and residual (high-pass) are separated using the FFT. Fig. 5 displays the power spectrum for gravity (Fig. 5a) and magnetic (Fig. 5b) maps. The examination of the radially averaged power spectrum indicates that low wavenumbers slope, denoted by the blue line, and reproduces the deep sources. Conversely, the high wavenumbers signify the shallow (red line) contributions (residual component).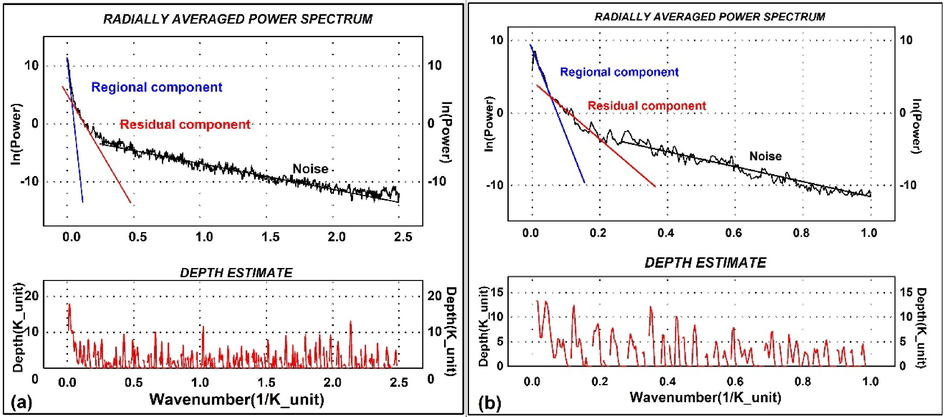
The power spectrum of the Buoguer (a) and the RTP magnetic data (b).
The regional maps show the long wavelength anomalies, which signify deep sources. The low-pass gravity map is displayed in Fig. 6a using 0.02 Rad/m cut-off wavenumber. It reveals five closed gravity anomalies. The regional gravity field ranges from −24 to 20 mGal. The low-pass magnetic map (Fig. 6b) reveals deep magnetic sources. It outlines the probable magnetic layer of the crust (Rama Rao et al., 2011). This figure reflects positive anomalies in the northern region whereas negative ones are situated in the southern area.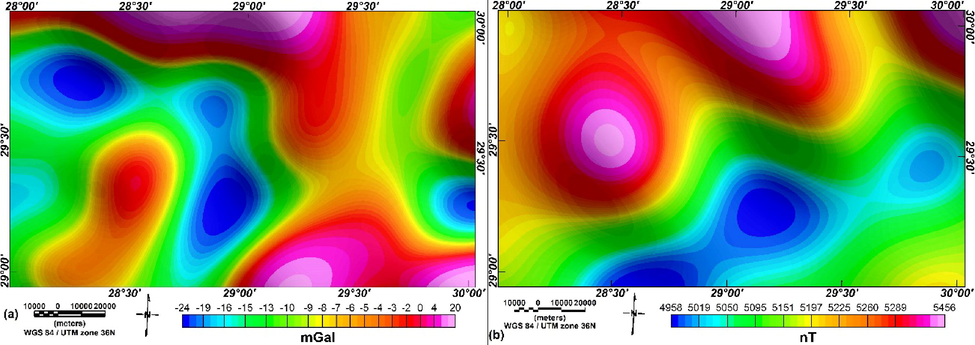
The low-pass filtered gravity (a) and magnetic (b) maps with 0.02 Rad/m cut-off wavenumber.
The high-pass GM maps (Fig. 7a and b) show the distribution of both fields when eliminating the regional effect. The maps indicate different anomalies reflecting different causative GM bodies of shallow depths. The high-pass gravity map is described by some insignificant elongated anomalies disseminated in the region with amplitude of −11.8 to 16.5 mGal. The gravity anomalies take three main trends which are ENE, WNW, and E-W directions. After eliminating the regional magnetic field, the residual RTP map is nearly free of deep heterogeneities and displays the scattering of several high and low anomalies, with amplitudes of −280 to 536 nT. From this filtration process, the main dominant trends in the study area are the NW, N-S, and NE trends.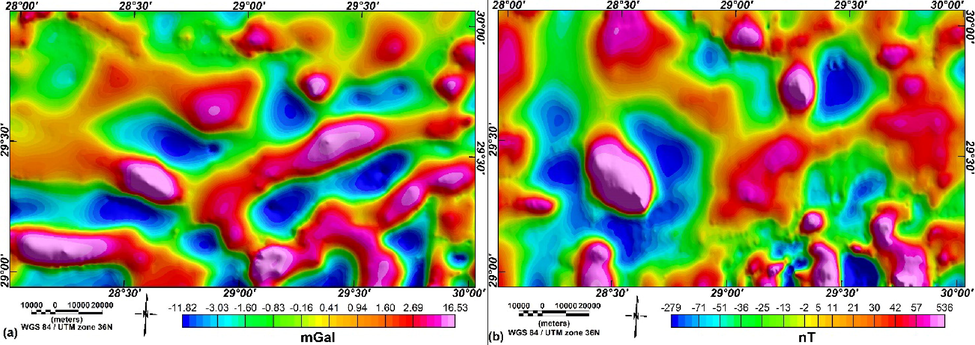
The high-pass filtered gravity (a) and magnetic (b) maps with 0.02 Rad/m cut-off wavenumber.
4.2 Lineament analysis
The deduced lineaments from GM anomalies support themselves. The GM trend patterns are utilized to delineate subsurface tectonics (Affleck, 1963). The lineament analysis aims to statistically define the main tectonic trends that affected the Precambrian rocks and the sedimentary section of the region (El-Gezeery, 2006).
Affleck's (1963) technique is used to interpret trends from GM maps. These trends reveal different forces that were taken place through different geologic times. These trends were numbered and lengthened each 10°clockwise and anticlockwise from the North. The statistical results of these trends are shown in Fig. 8. It illustrates that the E-W and ENE (Tethean and Syrian Arc) are the main trends for gravity maps. The magnetic maps indicate that the NW and ENE (Suez and Syrian Arc) are the principal trends. The figure displays that the N-S (East African), NE (Tebisti) and NNE (Aqaba) trends also affected the region.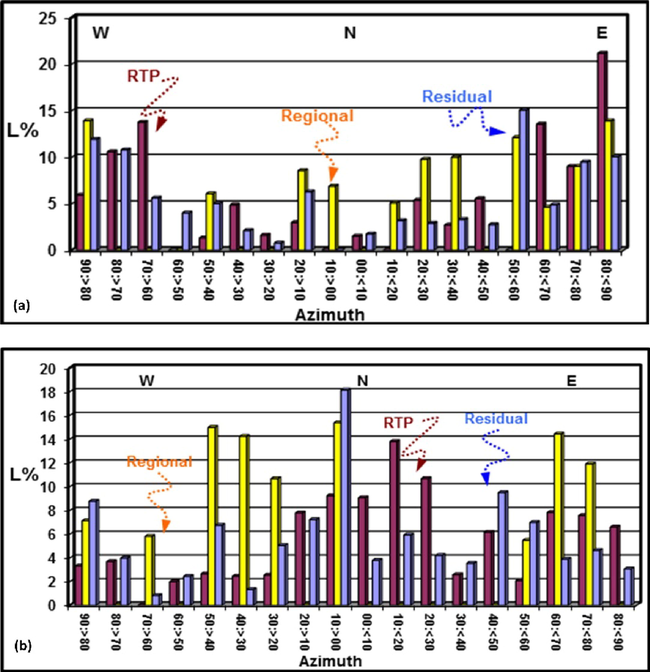
Block diagrams of the detected lineaments for both gravity (a) and magnetic (b) data.
The TDR gravity map (Fig. 9a) indicates the edges of uplifted and down-faulted blocks. The edges depth reveals 2.5–6 km as deduced from the half horizontal distance between −0.785 and +0.785 rad lines. The TDR magnetic map (Fig. 9b) exposes, unlike edges as matched to the gravity one. The delineated edges of the magnetic sources reflect diverse dimensions, forms, and trends. The depths of the edges appear to be small than those of the gravity ones. It differs from 2 to 6 km in most parts. Mostly, the southern region reveals shallow magnetic sources described by high frequencies with small extensions.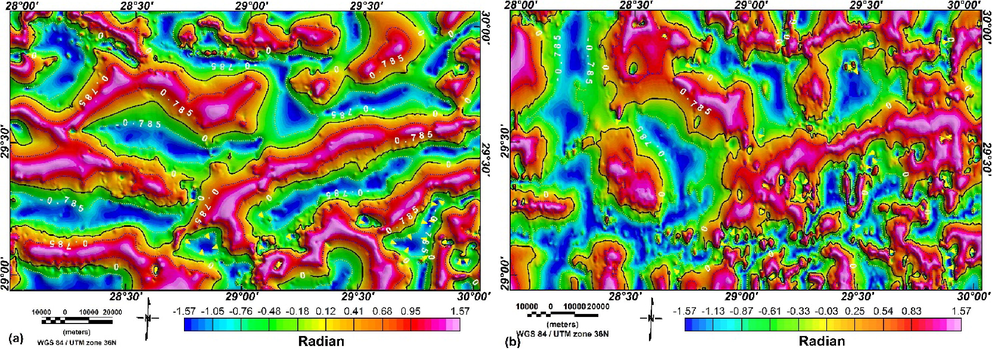
The TDR maps of gravity (a) and magnetic (b) anomalies.
4.3 Estimating basement depths
The spectral analysis (SPA) technique was utilized to assess the basement depth along twenty GM profiles using Spector and Grant's (1970) method. The locations of gravity profiles (G1–G20) are plotted in Fig. 3. Magnetic profiles (M1–M20) are also plotted on Fig. 5. Two examples for the application of SPA technique to gravity (profile G3) and magnetic (Profile M8) data are shown in Fig. 10. Moreover, results of the application of SPA to GM data are summarized in Table 1. Low depth values to basement rocks are noticed in southern regions, which range from 2084 m to 3580 m including profiles (G1, G2, G3, …, G9). The depth values of the northern area reveal deep basement rocks, where these values range from 3623 to 5943 m along profiles G13, G14, ……., G18. The magnetic profiles indicate smaller depth values as compared with those of gravity ones. Generally, the depths to basement rocks vary from 1650 m in the southern part (profile M8) to exceed 4000 m in western and northern regions (Profiles M1-M2 and M10-M11, respectively).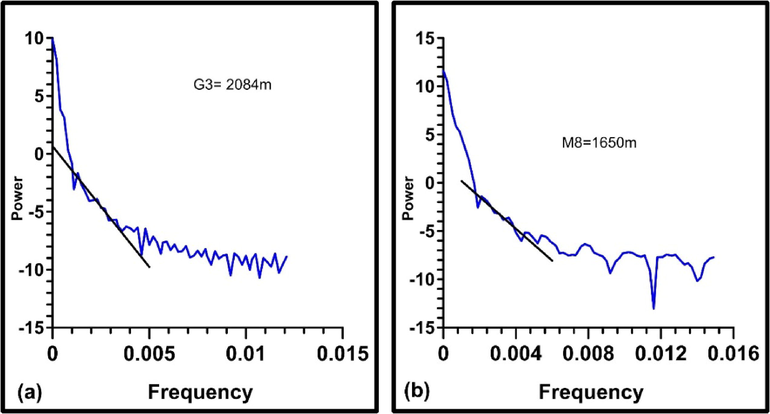
Two examples for the application of SPA technique on the GM (profile, G3 and M8, respectively).
Gravity Profiles
Magnetic Profiles
Profile No.
Depth (m)
Profile No.
Depth (m)
G1
3116
M1
4640
G2
3537
M2
4810
G3
2084
M3
2937
G4
2143
M4
4477
G5
3117
M5
3515
G6
2140
M6
3102
G7
2652
M7
2138
G8
3580
M8
1650
G9
3393
M9
3592
G10
4348
M10
4198
G11
3444
M11
4064
G12
3337
M12
3955
G13
4035
M13
3332
G14
3623
M14
3578
G15
3052
M15
3358
G16
5493
M16
3417
G17
4249
M17
3032
G18
4384
M18
3950
G19
2770
M19
3020
G20
3592
M20
2930
4.4 Structural basement map
The deduced structural map (Fig. 10) was achieved from all previous (RTP, Bouguer, high-pass, and TDR) maps. The best appropriate map is the high-pass gravity one that provides satisfactory matching in most areas. Thus, it was selected to overlap the constructed structural map on it. The map displays a central high/uplifted block (Appolonia- South Delta- North Sinai uplift) that runs in the ENE trend dividing Gharadig Basin to northern and southern sub-basins. Generally, both uplifted and down-faulted blocks appear to be interchanged positions taking ENE to E-W trends and intersected in by WNW trends. These sub-basins are linked with negative anomalies of GM high-pass maps. The fault configuration looks to be restricted by ENE (Syrian Arc), NE (Tibesti), E-W (Tethyan), and NW (Suez) trends. Plotting productive drilled wells on the map indicates that these wells lie mostly on or close to uplifted blocks as presented in Fig. 11.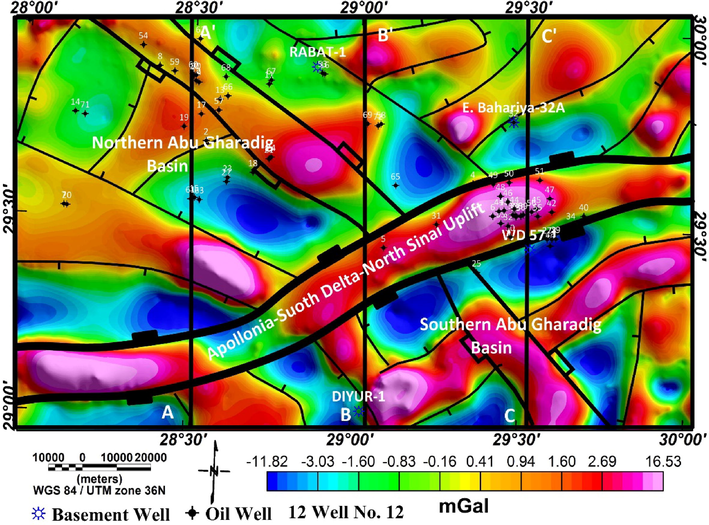
Structural map showing the locations of oil wells in the area.
4.5 The forward modeling profiles
To investigate the basement composition and structures besides determining the sedimentary cover thickness, three GM models were built along profiles AA’, BB’ and CC’ by the GM-SYS program of Oasis Montaj. locations of the profiles are plotted on the Bouguer (Fig. 3) and RTP (Fig. 5) maps passing the strong GM signatures. These profiles run from South to North and were constrained by eleven wells (Table 2). The sedimentary rocks were modeled as upper and lower layers with 2.2 and 2.5 gr/cc, respectively. Both rocks have zero magnetic susceptibility. The modeled sections were shown with 50 km depth. The modelled profiles show that there is a good aggrement between the calculated and observed profiles. These profiles extend about 111.4 km.
Model
Constrained wells
Long.
Lat.
FTD (km)
FM TD
AA'
AGNES-1
28.515
29.405
2.9
Jurassic
GPT-3
28.611
29.603
2.3
Kharita
BED 4–1
28.504
29.898
3.92
Kharita
BB'
Diyur-1
29.032
29.042
1.62
Basement
El Diyur-4
29.089
29.455
2.04
Baharyia
Ramak-1
29.026
29.544
2.38
Kharita
WD 33–4
29.030
29.766
3.57
Bahariya
Rabat-1
28.878
29.904
2.2
Basement
CC'
WD 57–1
29.517
29.462
2.99
Basement
Rawda-1
29.540
29.638
3.20
Baharyia
E. Bahariya-32A
29.459
29.781
4.44
Basement
Profile AA’ lies in the western region along Longitude 28◦ 30ʹE (Fig. 3). The observed anomaly of this profile shows a gravitational field varies from −16 to 9 mGal forming two positive and negative anomalies. Alternatively, the magnetic field reveals a central positive anomaly corresponding to the Agnes high with a value of 5720 nT. Generally, the magnetic field increases northward. Three wells (Agnes-1, GPT SW3, and BED 4–1) constrain the sedimentary cover and basement depths along this profile (Fig. 12). The modeled section displays a sedimentary cover that varies from 1600 to 5000 m. The magnetic layer was modeled by depth values differing from 25 km (the southern portion) to 20 km (the northern area). It was modeled by six polygons with densities varies from 2.55 to 2.69 gr/cc, while magnetic susceptibilities range from 0.0001 to 0.015 cgs unit. In general, low magnetic susceptibilities are related to acidic rocks, signifying granitic basement rocks of continental type while high values relate to basaltic type (Telford et al., 1990) that are related to the Agnes area. The depth to Moho discontinuity decreases from 36 km to 32 km northward.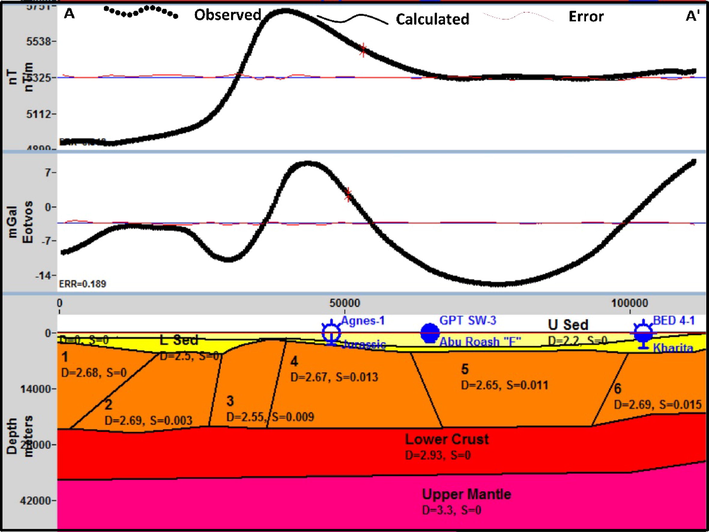
Coupled GM model along profile AA'.
Profile BB’ lies in the middle portion on Longitude 29◦ 00ʹ E. The gravity values vary from −20 to 16 mGal. The magnetic values differ from 4955 to 5490 nT. Five wells (Diyur-1, El Dayuir-4, Ramak-1, WD 34, and Rabat E-1) control this profile. The thickness of the sedimentary cover changes from about 0.5 km to 6 km. The basement blocks were modeled by 5 polygons (Fig. 13). These polygons demonstrate a wide range of magnetic susceptibilities ranging from 0.0004 in the southern portion to 0.01 CGS in the northern region. The depth to the bottom of 2.5D blocks varies from 23 to 21.6 km. The density of the modeled basement blocks ranges from 2.67 to 2.7 gr/cc. The depth to Moho discontinuity slightly decreases from 32.8 to 32.3 km northward.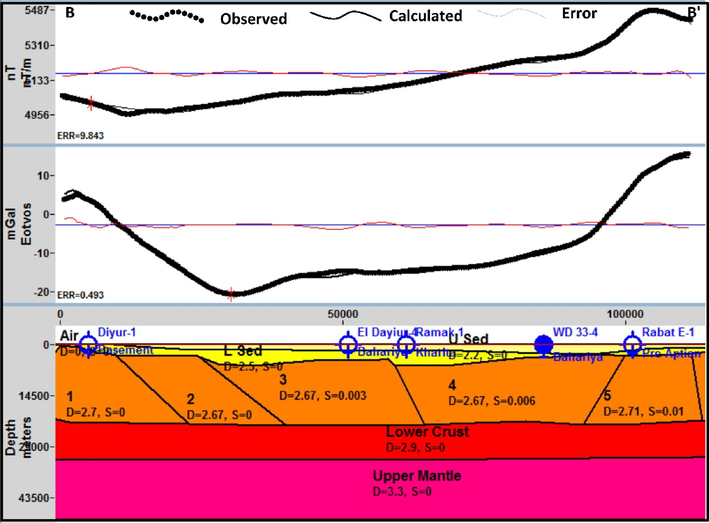
Coupled GM model along profile BB'.
Profile CC’ (Fig. 14) is taken through the eastern part along Longitude 29 30ʹ E and extends about 111.2 km. The amplitude of the gravity anomaly varies from −14 to 5.5mGal while the magnetic values range from 4930 to 5220 nT. Two basement wells (WD57-1 and E Bahariya-32A) were used to constrain the basement surface. Rawda-1 well was used to constrain the sedimentary cover. The magnetic layer is represented by 8 polygons. These polygons demonstrate a magnetic susceptibility range from 0.002 to 0.008 CGS indicating granitic to intermediate rocks along these profiles. The density of the modeled polygons ranges from 2.67 to 2.71 gr/cc. The depth to Moho discontinuity seems to be constant along these profiles at depth 32 km.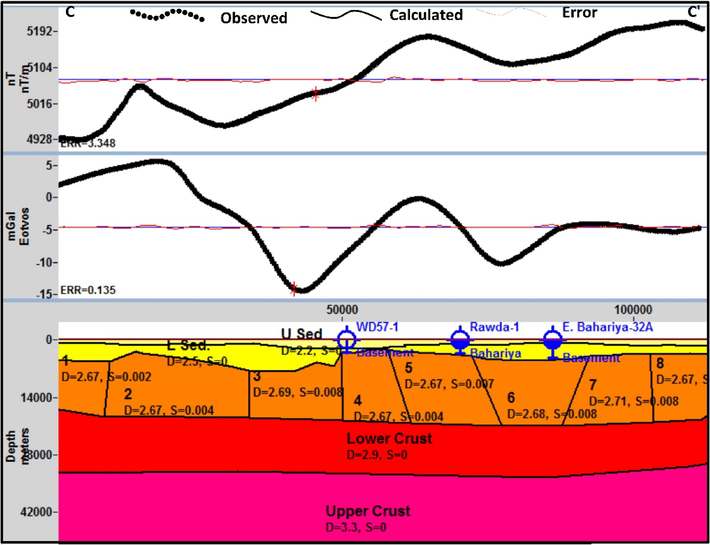
Coupled GM model along profile CC'.
5 Discussion
The work area lies inside the unstable shelf, which is affected by folding and faulting systems. The trend analysis of GM maps indicates that the area was highly affected by ENE (Syrian Arc), and E-W (Mediterranean) tectonic trends. According to Said (1962), Syrian Arc trend is the principle controlling tectonic factor of major folding in the unstable shelf region. This trend is related to Pre-Cambrian stress and has been rejuvenated during Hercynian Orogeny and during the Laramide time with some growth in Late Tertiary and Recent time (Halsey and Gardner, 1975). Meshref et al. (1976) and Bayoumi (1983) indicated that the (E-W) trend is the common fault direction in the Pre-Cambrian rocks of Egypt that play a great role in the structural pattern within the area.
The resulted residual and TDR maps of GM data were used to form the structure tectonic map of the area. It presents a large similarity to that of Meshref (1990) with more details where Appolonia-Qattaniya uplift with ENE trend divides Gharadig Basin into Northern and Southern Gharadig sub-basins. Coupled GM models were built to realize the superfluous information about the nature of the basement rocks. They reveal density values agreeable to that of Makris (1976), Makris et al. (1994), Salem et al. (2004), and Saada and El-Khadragy (2015). According to Telford et al. (1990), the magnetic susceptibilities of acidic rocks range from 0 to 0.0064 CGS, while basic rocks reach 0.014 CGS. Therefore, basement rocks expose granitic and sometimes basaltic where their magnetic susceptibilities reach 0.013 and 0.015 in CGS units at the uplifted or intruded blocks below Agnes-1 and BED 4–1 wells, respectively. Azab (2014) studied the Agnes high area and indicated that this high has GM association, which is mostly formed by near-surface igneous intrusions of a NW trend. The models indicate that depth to mantle of the area has a general trend to decrease northward because of its proximity to the transition boundary of the African plate (Salem et al., 2004).
6 Summary and conclusions
The stratigraphic sequence of the region extends from Cambro-Ordovician to the Quaternary sediments. These deposits replicate a wide variety of depositional environments. The regional–residual separation was applied to GM anomaly maps to produce shallow anomalies. The qualitative interpretation suggests several alternative highs and basins.
The obtained depth of basement rocks using SPA technique ranges from 2080 m in the southern region to 4800 m and 4454 m in the northern area.
The constructed structure map indicates a main uplift (Appolonia-Qattaniya) situated in the middle part with an ENE trend dividing Gharadig Basin into northern and southern sub-basins. The area includes smaller uplifts trending ENE and NW directions.
Three constructed forward GM models reveal a sedimentary cover has a thickness range from 1000 m to about 5500 m. The basement rocks reveal granitic and occasionally basaltic rocks as inferred from magnetic susceptibilities values (0.0001–0.015 in CGS unit). The depth to the Moho discontinuity decreases from 35 km to 31.5 km northward.
Acknowledgements
This research was supported by Researchers Supporting Project number (RSP-2021/249), King Saud University, Riyadh, Saudi Arabia.
Declaration of Competing Interest
The authors declare that they have no known competing financial interests or personal relationships that could have appeared to influence the work reported in this paper.
References
- Contribution of potential field data in delineating the structural-tectonic set-up of the eastern Qattara Depression area, Western Desert, Egypt. Aust. J. Basic Appl. Sci.. 2012;6(3):204-223.
- [Google Scholar]
- Agnes high, Western Desert, Egypt: A structural study in view of potential data modelling. Egypt. J. Pet.. 2014;23(2):229-245.
- [Google Scholar]
- Generalized LithoStratigraphic Column of Western Desert. Internal report 2007:1-10.
- [Google Scholar]
- Barakat, M.G., 1984: General review of the petroliferous provinces of Egypt with special emphasis on their geologic setting and oil potentialities. Petrol. Gas Proj., Cairo Univ. MIT Technology planning program.
- Tectonic origin of the Gulf of Suez, Egypt, as deduced from gravity data CRC. Handbook of Geophysical Explor. USA 1983:417-432.
- [Google Scholar]
- Egyptian Geological Survey and Mining Authority 1981. Geologicmap of Egypt.
- Eldosouky A.M., Pham L.T., El-Qassas R.A.Y., Hamimi Z., Oksum E., 2021a. Lithospheric Structure of the Arabian–Nubian Shield Using Satellite Potential Field Data. In: Hamimi Z., Fowler AR., Liégeois JP., Collins A., Abdelsalam M.G., Abd EI-Wahed M. (eds) The Geology of the Arabian-Nubian Shield. Regional Geology Reviews. Springer, Cham. https://doi.org/10.1007/978-3-030-72995-0_6.
- Integration of ASTER satellite imagery and 3D inversion of aeromagnetic data for deep mineral exploration. Adv. Space Res., ISSN. 2021;68(9):3641-3662.
- [CrossRef] [Google Scholar]
- Edge detection of aeromagnetic data as effective tools for structural imaging at Shilman area, South Eastern Desert, Egypt. Arab. J. Geosci.. 2021;14:13.
- [CrossRef] [Google Scholar]
- El Shaarawy, O.A., 1994: Structural analysis and oil potentialities of the area north of the Qattara Depression. Western Desert, Egypt, based on geophysical and subsurface geological data. Geology Department, Ain Shams University, Cairo. 1994, 196.
- Crustal thickness and structure of the northwestern part of the western desert, as deduced from integrated gravity and deep seismic data. Egypt.Geophys. Soc. J.. 2006;4(1):77-88.
- [Google Scholar]
- General Petroleum Company (GPC), 1984: Bouguer gravity map of Egypt.
- Halsey, J.H., Gardner, W.C., 1975. Tectonic analysis of Egypt using Earth Satellite data. Lecture given to Egyptian Petrol Geol Cairo GPC.
- Determination of the Crustal and Thermal Structure of the Erzurum-Horasan-Pasinler Basins (Eastern Turkiye) Using Gravity and Magnetic Data. Pure Appl. Geophys.. 2015;172:1599-1614.
- [CrossRef] [Google Scholar]
- A dynamic model of the Hellenic Arc deduced from geophysical data. Tectonophysics. 1976;36(4):339-346.
- [Google Scholar]
- The magnetic field of the eastern Mediterranean Sea. In: In Cruise 5 of the research vessel' Akademik Nikolaj Strakhov' Geolog. Survey of Israel report 87–98. 1994.
- [Google Scholar]
- Meshref, W.M., Refai, E.M. and Abdel Baki, S.M., 1976: Structural interpretation of the Gulf of Suez and its oil potentialities. EGPC., 5th Petrol Explor. Semin., Cairo. 21p.
- Meshref, W.M., 1990. Tectonic framework. In R. Said (editor): The geology of Egypt (Rotterdam, Netherlands, A. A Balkema Publishers), 113–130.
- Well evaluation conference of Egypt. EGPC, Egypt: Schlumberger Technical Editing Services; 1995. p. :87.
- Potential field tilt—a new concept for location of potential field sources. J. Appl. Geophys.. 1994;32(2-3):213-217.
- [Google Scholar]
- On the performance of phase-based filters for enhancing lateral boundaries of magnetic and gravity sources: a case study of the Seattle uplift. Arab. J. Geosci.. 2021;14:129.
- [CrossRef] [Google Scholar]
- Delineation of intra crustal horizon in Eastern Dharwar Craton – an aeromagnetic evidence. J. Asian Earth Sci.. 2011;40(2):534-541.
- [Google Scholar]
- Delineating the subsurface geological features of the Southern Abu Gharadig Basin, North Western Desert, Egypt, based on gravity and magnetic data. Geol. Carpath.. 2020;71(1):47-60.
- [Google Scholar]
- Insights on the tectonic styles of the Red Sea rift using gravity and magnetic data, Marine and Petroleum Geology. ISSN. 2021;105253:0264-8172.
- [CrossRef] [Google Scholar]
- An Integrated Study of Gravity and Magnetic Data on West El-Minya Area, Western Desert, Egypt. J. Am. Sci.. 2015;11(12):169-184.
- [Google Scholar]
- Said, R., 1962: The Geology of Egypt. Amsterdam.
- The Geology of Egypt. Rotterdam: Bakema; 1990. p. :734.
- Structure and evolution of North African passive margin crust as inferred from 2-D gravity modeling of Nile Delta and its surrounding areas, Egypt. EGS J.. 2004;2(1):17-29.
- [Google Scholar]
- Neoproterozoic hybrid forearc – MOR ophiolite belts in the northern Arabian-Nubian Shield: no evidence for back-arc tectonic setting. Int. Geol. Rev. 2020
- [CrossRef] [Google Scholar]
- Shahin, A.N., 1989: Undiscovered reserves in the Northern Western Desert, Egypt: Application of Quantitative Modelling to Petroleum Exploration. Proc. 28th Int. Geol. Cong., Washington, D.C, 3, 3-82.
- Statistical models for interpreting aeromagnetic data. Geophysics. 1970;35(2):293-302.
- [Google Scholar]
- Applied geophysics (2nd ed.). Cambridge: Cambridge Univ. Press; 1990.
- Structural setting of central and south Egypt: An overview. Micropaleontology. 2003;49(Suppl_1):1-13.
- [Google Scholar]


